
12.6: Quadric Surfaces


- Last updated
- Jun 14, 2019
- Save as PDF
( \newcommand{\kernel}{\mathrm{null}\,}\)
- Identify a cylinder as a type of three-dimensional surface.
- Recognize the main features of ellipsoids, paraboloids, and hyperboloids.
- Use traces to draw the intersections of quadric surfaces with the coordinate planes.
We have been exploring vectors and vector operations in three-dimensional space, and we have developed equations to describe lines, planes, and spheres. In this section, we use our knowledge of planes and spheres, which are examples of three-dimensional figures called surfaces, to explore a variety of other surfaces that can be graphed in a three-dimensional coordinate system.
Identifying Cylinders
The first surface we’ll examine is the cylinder. Although most people immediately think of a hollow pipe or a soda straw when they hear the word cylinder, here we use the broad mathematical meaning of the term. As we have seen, cylindrical surfaces don’t have to be circular. A rectangular heating duct is a cylinder, as is a rolled-up yoga mat, the cross-section of which is a spiral shape.
In the two-dimensional coordinate plane, the equation x2+y2=9 describes a circle centered at the origin with radius 3. In three-dimensional space, this same equation represents a surface. Imagine copies of a circle stacked on top of each other centered on the z-axis (Figure 12.6.1), forming a hollow tube. We can then construct a cylinder from the set of lines parallel to the z-axis passing through the circle x2+y2=9 in the xy-plane, as shown in the figure. In this way, any curve in one of the coordinate planes can be extended to become a surface.
A set of lines parallel to a given line passing through a given curve is known as a cylindrical surface, or cylinder. The parallel lines are called rulings.
From this definition, we can see that we still have a cylinder in three-dimensional space, even if the curve is not a circle. Any curve can form a cylinder, and the rulings that compose the cylinder may be parallel to any given line (Figure 12.6.2).
Sketch the graphs of the following cylindrical surfaces.
- x2+z2=25
- z=2x2−y
- y=sinx
Solution
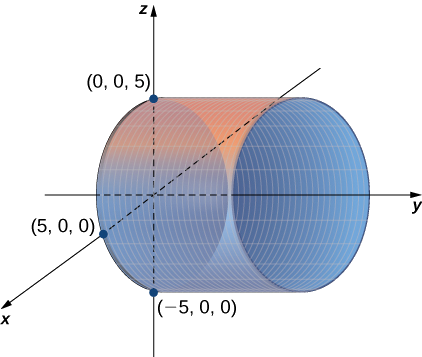
a. The variable y can take on any value without limit. Therefore, the lines ruling this surface are parallel to the y-axis. The intersection of this surface with the xz-plane forms a circle centered at the origin with radius 5 (see Figure 12.6.3).
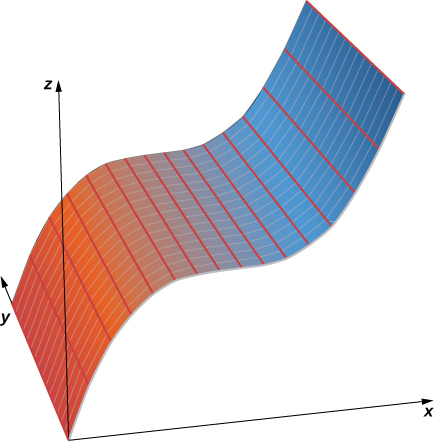
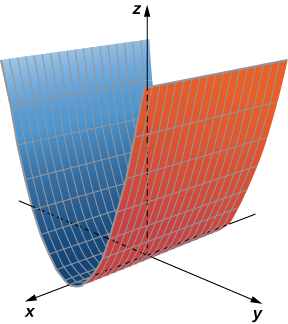
b. In this case, the equation contains all three variables —x,y, and z— so none of the variables can vary arbitrarily. The easiest way to visualize this surface is to use a computer graphing utility (Figure 12.6.4).
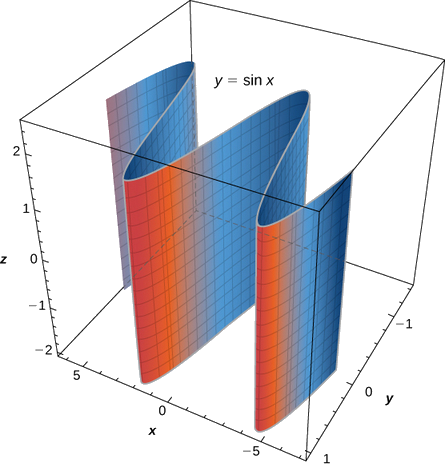
c. In this equation, the variable z can take on any value without limit. Therefore, the lines composing this surface are parallel to the z-axis. The intersection of this surface with the xy-plane outlines curve y=sinx (Figure 12.6.5).
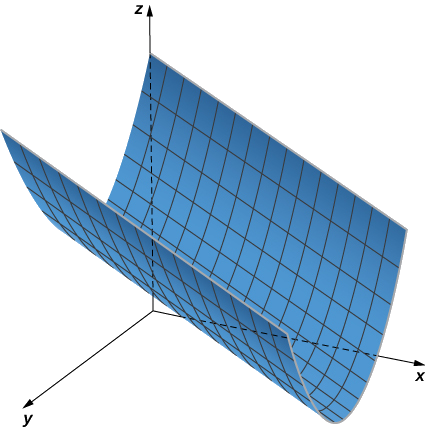
Sketch or use a graphing tool to view the graph of the cylindrical surface defined by equation z=y2.
- Hint
-
The variable x can take on any value without limit.
- Answer
-
When sketching surfaces, we have seen that it is useful to sketch the intersection of the surface with a plane parallel to one of the coordinate planes. These curves are called traces. We can see them in the plot of the cylinder in Figure 12.6.6.
The traces of a surface are the cross-sections created when the surface intersects a plane parallel to one of the coordinate planes.
Traces are useful in sketching cylindrical surfaces. For a cylinder in three dimensions, though, only one set of traces is useful. Notice, in Figure 12.6.6, that the trace of the graph of z=sinx in the xz-plane is useful in constructing the graph. The trace in the xy-plane, though, is just a series of parallel lines, and the trace in the yz-plane is simply one line.
Cylindrical surfaces are formed by a set of parallel lines. Not all surfaces in three dimensions are constructed so simply, however. We now explore more complex surfaces, and traces are an important tool in this investigation.
Quadric Surfaces
We have learned about surfaces in three dimensions described by first-order equations; these are planes. Some other common types of surfaces can be described by second-order equations. We can view these surfaces as three-dimensional extensions of the conic sections we discussed earlier: the ellipse, the parabola, and the hyperbola. We call these graphs quadric surfaces
Quadric surfaces are the graphs of equations that can be expressed in the form
Ax2+By2+Cz2+Dxy+Exz+Fyz+Gx+Hy+Jz+K=0.
When a quadric surface intersects a coordinate plane, the trace is a conic section.
An ellipsoid is a surface described by an equation of the form x2a2+y2b2+z2c2=1. Set x=0 to see the trace of the ellipsoid in the yz-plane. To see the traces in the xy- and xz-planes, set z=0 and y=0, respectively. Notice that, if a=b, the trace in the xy-plane is a circle. Similarly, if a=c, the trace in the xz-plane is a circle and, if b=c, then the trace in the yz-plane is a circle. A sphere, then, is an ellipsoid with a=b=c.
Sketch the ellipsoid
x222+y232+z252=1.
Solution
Start by sketching the traces. To find the trace in the xy-plane, set z=0:x222+y232=1 (Figure 12.6.7). To find the other traces, first set y=0 and then set x=0.
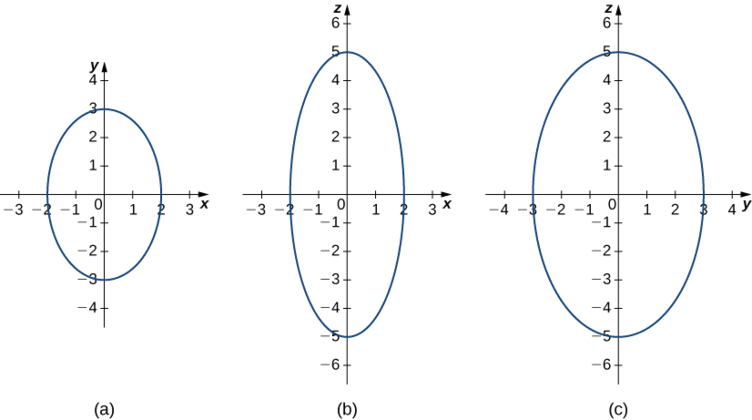
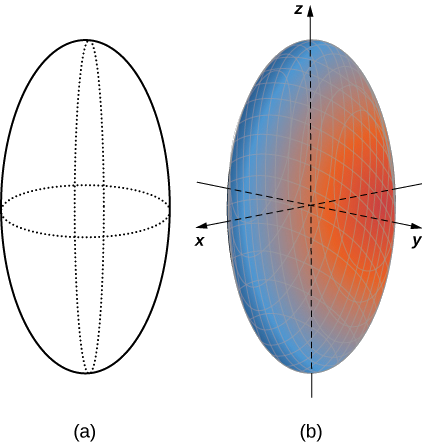
Now that we know what traces of this solid look like, we can sketch the surface in three dimensions (Figure 12.6.8).
The trace of an ellipsoid is an ellipse in each of the coordinate planes. However, this does not have to be the case for all quadric surfaces. Many quadric surfaces have traces that are different kinds of conic sections, and this is usually indicated by the name of the surface. For example, if a surface can be described by an equation of the form
x2a2+y2b2=zc
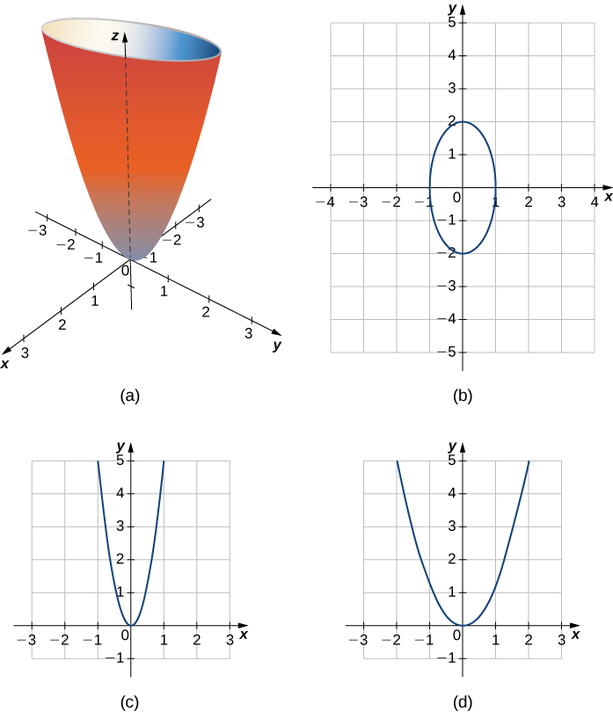
then we call that surface an elliptic paraboloid. The trace in the xy-plane is an ellipse, but the traces in the xz-plane and yz-plane are parabolas (Figure 12.6.9). Other elliptic paraboloids can have other orientations simply by interchanging the variables to give us a different variable in the linear term of the equation x2a2+z2c2=yb or y2b2+z2c2=xa.
Describe the traces of the elliptic paraboloid x2+y222=z5.
Solution
To find the trace in the xy-plane, set z=0:x2+y222=0. The trace in the plane z=0 is simply one point, the origin. Since a single point does not tell us what the shape is, we can move up the z-axis to an arbitrary plane to find the shape of other traces of the figure.
The trace in plane z=5 is the graph of equation x2+y222=1, which is an ellipse. In the xz-plane, the equation becomes z=5x2. The trace is a parabola in this plane and in any plane with the equation y=b.
In planes parallel to the yz-plane, the traces are also parabolas, as we can see in Figure 12.6.10.
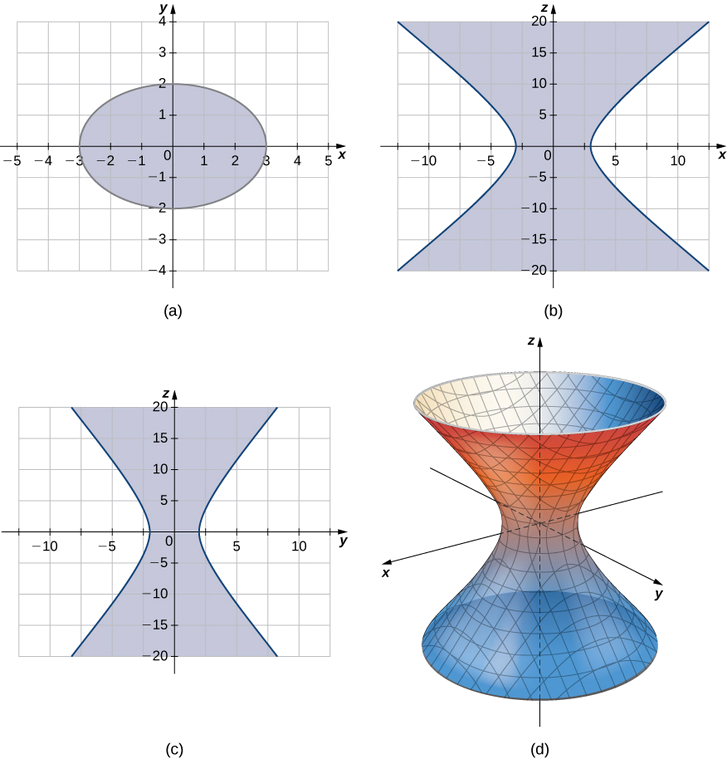
A hyperboloid of one sheet is any surface that can be described with an equation of the form x2a2+y2b2−z2c2=1. Describe the traces of the hyperboloid of one sheet given by equation x232+y222−z252=1.
- Hint
-
To find the traces in the coordinate planes, set each variable to zero individually.
- Answer
-
The traces parallel to the xy-plane are ellipses and the traces parallel to the xz- and yz-planes are hyperbolas. Specifically, the trace in the xy-plane is ellipse x232+y222=1, the trace in the xz-plane is hyperbola x232−z252=1, and the trace in the yz-plane is hyperbola y222−z252=1 (see the following figure).
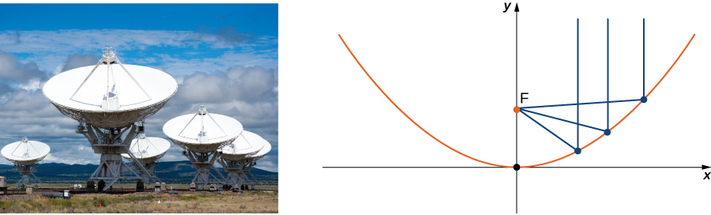
Hyperboloids of one sheet have some fascinating properties. For example, they can be constructed using straight lines, such as in the sculpture in Figure 12.6.11a. In fact, cooling towers for nuclear power plants are often constructed in the shape of a hyperboloid. The builders are able to use straight steel beams in the construction, which makes the towers very strong while using relatively little material (Figure 12.6.11b).
Energy hitting the surface of a parabolic reflector is concentrated at the focal point of the reflector (Figure 12.6.12). If the surface of a parabolic reflector is described by equation x2100+y2100=z4, where is the focal point of the reflector?
Solution
Since z is the first-power variable, the axis of the reflector corresponds to the z-axis. The coefficients of x2 and y2 are equal, so the cross-section of the paraboloid perpendicular to the z-axis is a circle. We can consider a trace in the xz-plane or the yz-plane; the result is the same. Setting y=0, the trace is a parabola opening up along the z-axis, with standard equation x2=4pz, where p is the focal length of the parabola. In this case, this equation becomes x2=100⋅z4=4pz or 25=4p. So p is 6.25 m, which tells us that the focus of the paraboloid is 6.25 m up the axis from the vertex. Because the vertex of this surface is the origin, the focal point is (0,0,6.25).
Seventeen standard quadric surfaces can be derived from the general equation
Ax2+By2+Cz2+Dxy+Exz+Fyz+Gx+Hy+Jz+K=0.
The following figures summarize the most important ones.
Identify the surfaces represented by the given equations.
- 16x2+9y2+16z2=144
- 9x2−18x+4y2+16y−36z+25=0
Solution
a. The x,y, and z terms are all squared, and are all positive, so this is probably an ellipsoid. However, let’s put the equation into the standard form for an ellipsoid just to be sure. We have
16x2+9y2+16z2=144.
Dividing through by 144 gives
x29+y216+z29=1.
So, this is, in fact, an ellipsoid, centered at the origin.
b. We first notice that the z term is raised only to the first power, so this is either an elliptic paraboloid or a hyperbolic paraboloid. We also note there are x terms and y terms that are not squared, so this quadric surface is not centered at the origin. We need to complete the square to put this equation in one of the standard forms. We have
9x2−18x+4y2+16y−36z+25=09x2−18x+4y2+16y+25=36z9(x2−2x)+4(y2+4y)+25=36z9(x2−2x+1−1)+4(y2+4y+4−4)+25=36z9(x−1)2−9+4(y+2)2−16+25=36z9(x−1)2+4(y+2)2=36z(x−1)24+(y−2)29=z.
This is an elliptic paraboloid centered at (1,2,0).
Identify the surface represented by equation 9x2+y2−z2+2z−10=0.
- Hint
-
Look at the signs and powers of the x,y, and z terms
- Answer
-
Hyperboloid of one sheet, centered at (0,0,1).
Key Concepts
- A set of lines parallel to a given line passing through a given curve is called a cylinder, or a cylindrical surface. The parallel lines are called rulings.
- The intersection of a three-dimensional surface and a plane is called a trace. To find the trace in the xy-, yz-, or xz-planes, set z=0,x=0, or y=0, respectively.
- Quadric surfaces are three-dimensional surfaces with traces composed of conic sections. Every quadric surface can be expressed with an equation of the form
Ax2+By2+Cz2+Dxy+Exz+Fyz+Gx+Hy+Jz+K=0.
- To sketch the graph of a quadric surface, start by sketching the traces to understand the framework of the surface.
- Important quadric surfaces are summarized in Figures 12.6.13 and 12.6.14.
Glossary
- cylinder
- a set of lines parallel to a given line passing through a given curve
- ellipsoid
- a three-dimensional surface described by an equation of the form x2a2+y2b2+z2c2=1; all traces of this surface are ellipses
- elliptic cone
- a three-dimensional surface described by an equation of the form x2a2+y2b2−z2c2=0; traces of this surface include ellipses and intersecting lines
- elliptic paraboloid
- a three-dimensional surface described by an equation of the form z=x2a2+y2b2; traces of this surface include ellipses and parabolas
- hyperboloid of one sheet
- a three-dimensional surface described by an equation of the form x2a2+y2b2−z2c2=1; traces of this surface include ellipses and hyperbolas
- hyperboloid of two sheets
- a three-dimensional surface described by an equation of the form z2c2−x2a2−y2b2=1; traces of this surface include ellipses and hyperbolas
- quadric surfaces
- surfaces in three dimensions having the property that the traces of the surface are conic sections (ellipses, hyperbolas, and parabolas)
- rulings
- parallel lines that make up a cylindrical surface
- trace
- the intersection of a three-dimensional surface with a coordinate plane