
2.2E: Exercises for Section 2.2


- Last updated
- Jun 30, 2021
- Save as PDF

( \newcommand{\kernel}{\mathrm{null}\,}\)
Intuitive Definition of Limits
For exercises 1 - 2, consider the function
1) [T] Complete the following table for the function. Round your solutions to four decimal places.
| 0.9 | a. | 1.1 | e. |
| 0.99 | b. | 1.01 | f. |
| 0.999 | c. | 1.001 | g. |
| 0.9999 | d. | 1.0001 | h. |
2) What do your results in the preceding exercise indicate about the two-sided limit
- Answer
-
does not exist because
For exercises 3 - 5, consider the function
3) [T] Make a table showing the values of
| -0.01 | a. | 0.01 | e. |
| -0.001 | b. | 0.001 | f. |
| -0.0001 | c. | 0.0001 | g. |
| -0.00001 | d. | 0.00001 | h. |
4) What does the table of values in the preceding exercise indicate about the function
- Answer
5) To which mathematical constant do the values in the preceding exercise appear to be approaching? This is the actual limit here.
In exercises 6 - 8, use the given values to set up a table to evaluate the limits. Round your solutions to eight decimal places.
6) [T]
| -0.1 | a. | 0.1 | e. |
| -0.01 | b. | 0.01 | f. |
| -0.001 | c. | 0.001 | g. |
| -0.0001 | d. | 0.0001 | h. |
- Answer
- a. 1.98669331; b. 1.99986667; c. 1.99999867; d. 1.99999999; e. 1.98669331; f. 1.99986667; g. 1.99999867; h. 1.99999999;
7) [T]
| -0.1 | a. | 0.1 | e. |
| -0.01 | b. | 0.01 | f. |
| -0.001 | c. | 0.001 | g. |
| -0.0001 | d. | 0.0001 | h. |
8) Use the preceding two exercises to conjecture (guess) the value of the following limit:
- Answer
[T] In exercises 9 - 14, set up a table of values to find the indicated limit. Round to eight significant digits.
9)
| 1.9 | a. | 2.1 | e. |
| 1.99 | b. | 2.01 | f. |
| 1.999 | c. | 2.001 | g. |
| 1.9999 | d. | 2.0001 | h. |
10)
| 0.9 | a. | 1.1 | e. |
| 0.99 | b. | 1.01 | f. |
| 0.999 | c. | 1.001 | g. |
| 0.9999 | d. | 1.0001 | h. |
- Answer
- a. −0.80000000; b. −0.98000000; c. −0.99800000; d. −0.99980000; e. −1.2000000; f. −1.0200000; g. −1.0020000; h. −1.0002000;
11)
| -0.1 | a. | 0.1 | e. |
| -0.01 | b. | 0.01 | f. |
| -0.001 | c. | 0.001 | g. |
| -0.0001 | d. | 0.0001 | h. |
12)
| -0.1 | a. | 0.1 | e. |
| -0.01 | b. | 0.01 | f. |
| -0.001 | c. | 0.001 | g. |
| -0.0001 | d. | 0.0001 | h. |
- Answer
- a. −37.931034; b. −3377.9264; c. −333,777.93; d. −33,337,778; e. −29.032258; f. −3289.0365; g. −332,889.04; h. −33,328,889
13)
| 0.1 | a. |
| 0.01 | b. |
| 0.001 | c. |
| 0.0001 | d. |
14)
| 1.9 | a. | 2.1 | e. |
| 1.99 | b. | 2.01 | f. |
| 1.999 | c. | 2.001 | g. |
| 1.9999 | d. | 2.0001 | h. |
- Answer
- a. 0.13495277; b. 0.12594300; c. 0.12509381; d. 0.12500938; e. 0.11614402; f. 0.12406794; g. 0.12490631; h. 0.12499063;
[T] In exercises 15 - 16, set up a table of values and round to eight significant digits. Based on the table of values, make a guess about what the limit is. Then, use a calculator to graph the function and determine the limit. Was the conjecture correct? If not, why does the method of tables fail?
15)
| -0.1 | a. | 0.1 | e. |
| -0.01 | b. | 0.01 | f. |
| -0.001 | c. | 0.001 | g. |
| -0.0001 | d. | 0.0001 | h. |
16)
| 0.1 | a. |
| 0.01 | b. |
| 0.001 | c. |
| 0.0001 | d. |
- Answer
-
a. 10.00000; b. 100.00000; c. 1000.0000; d. 10,000.000;
Guess:
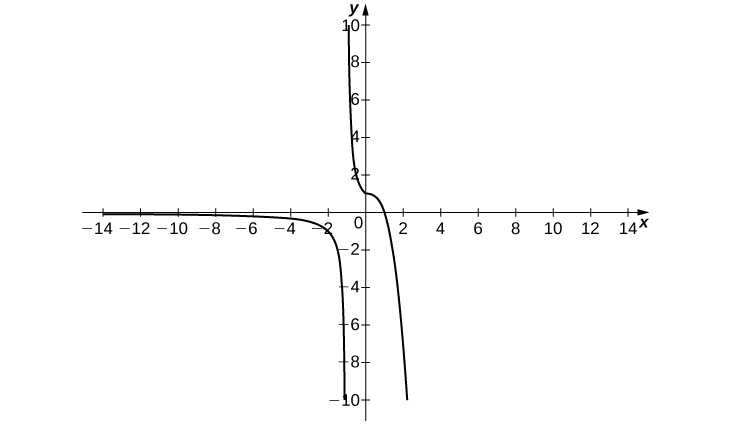
Actual: DNE , since the graph shows the function oscillates wildly between values approaching positive infinity and values approaching negative infinity, as the value ofapproaches from the positive side. ![A graph of the function (1/alpha) * cos (pi / alpha), which oscillates gently until the interval [-.2, .2], where it oscillates rapidly, going to infinity and negative infinity as it approaches the y axis.](https://math.libretexts.org/@api/deki/files/1863/CNX_Calc_Figure_02_02_214.jpeg?revision=1&size=bestfit&width=417&height=348)
In exercises 17 - 20, consider the graph of the function
17)
18)
- Answer
- False;
19)
20)
- Answer
- False;
DNE since
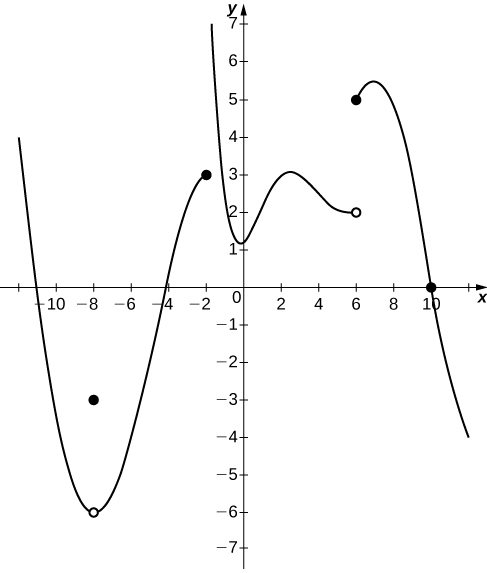
In exercises 21 - 25, use the following graph of the function
21)
22)
- Answer
23)
24)
- Answer
25)
In exercises 26 - 29, use the graph of the function
26)
- Answer
27)
28)
- Answer
- DNE
29)
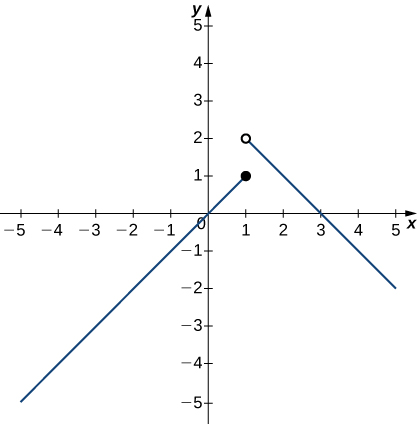
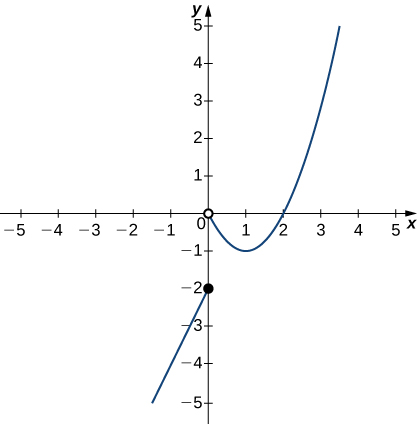
In exercises 30 - 35, use the graph of the function
![A graph of a piecewise function with three segments, all linear. The first exists for x < -2, has a slope of 1, and ends at the open circle at (-2, 0). The second exists over the interval [-2, 2], has a slope of -1, goes through the origin, and has closed circles at its endpoints (-2, 2) and (2,-2). The third exists for x>2, has a slope of 1, and begins at the open circle (2,2).](https://math.libretexts.org/@api/deki/files/1897/CNX_Calc_Figure_02_02_204.jpeg?revision=1&size=bestfit&width=417&height=424)
30)
- Answer
31)
32)
- Answer
- DNE
33)
34)
- Answer
35)
In exercises 36 - 38, use the graph of the function
36)
- Answer
37)
38)
- Answer
- DNE
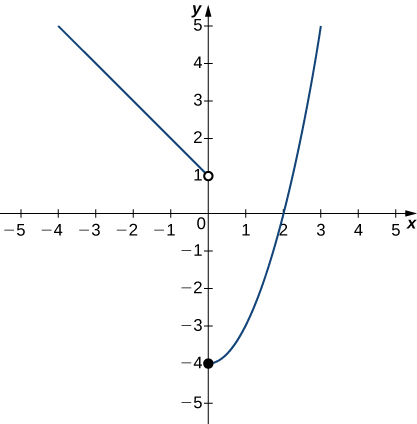
In exercises 39 - 41, use the graph of the function
39)
40)
- Answer
41)
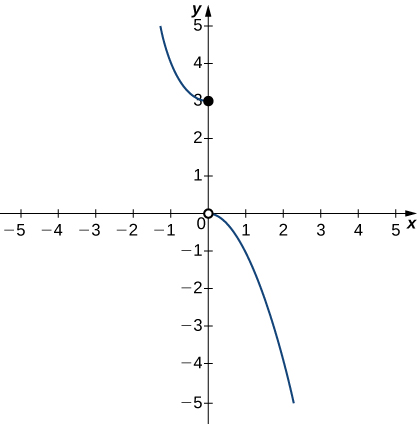
In exercises 42 - 46, use the graph of the function
42)
- Answer
43)
44)
- Answer
- DNE
45)
46)
- Answer
Infinite Limits
In exercises 47 - 51, sketch the graph of a function with the given properties.
47)
48)
- Answer
-
Answers may vary
49)
50)
- Answer
-
Answer may vary
51)
52) Shock waves arise in many physical applications, ranging from supernovas to detonation waves. A graph of the density of a shock wave with respect to distance,
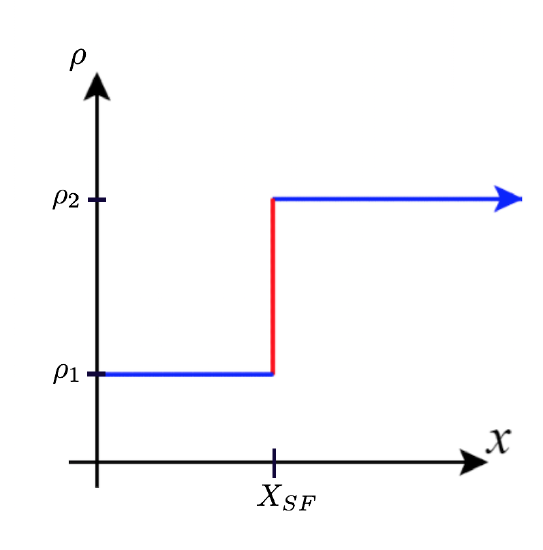
a. Evaluate
b. Evaluate
c. Evaluate
- Answer
- a.
b. c. DNE unless from the right, you are in the high-density area of the shock. When you approach from the left, you have not experienced the “shock” yet and are at a lower density.
53) A track coach uses a camera with a fast shutter to estimate the position of a runner with respect to time. A table of the values of position of the athlete versus time is given here, where
| 1.75 | 4.5 |
| 1.95 | 6.1 |
| 1.99 | 6.42 |
| 2.01 | 6.58 |
| 2.05 | 6.9 |
| 2.25 | 8.5 |