
9.4: Practice Problems
- Page ID
- 139301
\( \newcommand{\vecs}[1]{\overset { \scriptstyle \rightharpoonup} {\mathbf{#1}} } \)
\( \newcommand{\vecd}[1]{\overset{-\!-\!\rightharpoonup}{\vphantom{a}\smash {#1}}} \)
\( \newcommand{\dsum}{\displaystyle\sum\limits} \)
\( \newcommand{\dint}{\displaystyle\int\limits} \)
\( \newcommand{\dlim}{\displaystyle\lim\limits} \)
\( \newcommand{\id}{\mathrm{id}}\) \( \newcommand{\Span}{\mathrm{span}}\)
( \newcommand{\kernel}{\mathrm{null}\,}\) \( \newcommand{\range}{\mathrm{range}\,}\)
\( \newcommand{\RealPart}{\mathrm{Re}}\) \( \newcommand{\ImaginaryPart}{\mathrm{Im}}\)
\( \newcommand{\Argument}{\mathrm{Arg}}\) \( \newcommand{\norm}[1]{\| #1 \|}\)
\( \newcommand{\inner}[2]{\langle #1, #2 \rangle}\)
\( \newcommand{\Span}{\mathrm{span}}\)
\( \newcommand{\id}{\mathrm{id}}\)
\( \newcommand{\Span}{\mathrm{span}}\)
\( \newcommand{\kernel}{\mathrm{null}\,}\)
\( \newcommand{\range}{\mathrm{range}\,}\)
\( \newcommand{\RealPart}{\mathrm{Re}}\)
\( \newcommand{\ImaginaryPart}{\mathrm{Im}}\)
\( \newcommand{\Argument}{\mathrm{Arg}}\)
\( \newcommand{\norm}[1]{\| #1 \|}\)
\( \newcommand{\inner}[2]{\langle #1, #2 \rangle}\)
\( \newcommand{\Span}{\mathrm{span}}\) \( \newcommand{\AA}{\unicode[.8,0]{x212B}}\)
\( \newcommand{\vectorA}[1]{\vec{#1}} % arrow\)
\( \newcommand{\vectorAt}[1]{\vec{\text{#1}}} % arrow\)
\( \newcommand{\vectorB}[1]{\overset { \scriptstyle \rightharpoonup} {\mathbf{#1}} } \)
\( \newcommand{\vectorC}[1]{\textbf{#1}} \)
\( \newcommand{\vectorD}[1]{\overrightarrow{#1}} \)
\( \newcommand{\vectorDt}[1]{\overrightarrow{\text{#1}}} \)
\( \newcommand{\vectE}[1]{\overset{-\!-\!\rightharpoonup}{\vphantom{a}\smash{\mathbf {#1}}}} \)
\( \newcommand{\vecs}[1]{\overset { \scriptstyle \rightharpoonup} {\mathbf{#1}} } \)
\(\newcommand{\longvect}{\overrightarrow}\)
\( \newcommand{\vecd}[1]{\overset{-\!-\!\rightharpoonup}{\vphantom{a}\smash {#1}}} \)
\(\newcommand{\avec}{\mathbf a}\) \(\newcommand{\bvec}{\mathbf b}\) \(\newcommand{\cvec}{\mathbf c}\) \(\newcommand{\dvec}{\mathbf d}\) \(\newcommand{\dtil}{\widetilde{\mathbf d}}\) \(\newcommand{\evec}{\mathbf e}\) \(\newcommand{\fvec}{\mathbf f}\) \(\newcommand{\nvec}{\mathbf n}\) \(\newcommand{\pvec}{\mathbf p}\) \(\newcommand{\qvec}{\mathbf q}\) \(\newcommand{\svec}{\mathbf s}\) \(\newcommand{\tvec}{\mathbf t}\) \(\newcommand{\uvec}{\mathbf u}\) \(\newcommand{\vvec}{\mathbf v}\) \(\newcommand{\wvec}{\mathbf w}\) \(\newcommand{\xvec}{\mathbf x}\) \(\newcommand{\yvec}{\mathbf y}\) \(\newcommand{\zvec}{\mathbf z}\) \(\newcommand{\rvec}{\mathbf r}\) \(\newcommand{\mvec}{\mathbf m}\) \(\newcommand{\zerovec}{\mathbf 0}\) \(\newcommand{\onevec}{\mathbf 1}\) \(\newcommand{\real}{\mathbb R}\) \(\newcommand{\twovec}[2]{\left[\begin{array}{r}#1 \\ #2 \end{array}\right]}\) \(\newcommand{\ctwovec}[2]{\left[\begin{array}{c}#1 \\ #2 \end{array}\right]}\) \(\newcommand{\threevec}[3]{\left[\begin{array}{r}#1 \\ #2 \\ #3 \end{array}\right]}\) \(\newcommand{\cthreevec}[3]{\left[\begin{array}{c}#1 \\ #2 \\ #3 \end{array}\right]}\) \(\newcommand{\fourvec}[4]{\left[\begin{array}{r}#1 \\ #2 \\ #3 \\ #4 \end{array}\right]}\) \(\newcommand{\cfourvec}[4]{\left[\begin{array}{c}#1 \\ #2 \\ #3 \\ #4 \end{array}\right]}\) \(\newcommand{\fivevec}[5]{\left[\begin{array}{r}#1 \\ #2 \\ #3 \\ #4 \\ #5 \\ \end{array}\right]}\) \(\newcommand{\cfivevec}[5]{\left[\begin{array}{c}#1 \\ #2 \\ #3 \\ #4 \\ #5 \\ \end{array}\right]}\) \(\newcommand{\mattwo}[4]{\left[\begin{array}{rr}#1 \amp #2 \\ #3 \amp #4 \\ \end{array}\right]}\) \(\newcommand{\laspan}[1]{\text{Span}\{#1\}}\) \(\newcommand{\bcal}{\cal B}\) \(\newcommand{\ccal}{\cal C}\) \(\newcommand{\scal}{\cal S}\) \(\newcommand{\wcal}{\cal W}\) \(\newcommand{\ecal}{\cal E}\) \(\newcommand{\coords}[2]{\left\{#1\right\}_{#2}}\) \(\newcommand{\gray}[1]{\color{gray}{#1}}\) \(\newcommand{\lgray}[1]{\color{lightgray}{#1}}\) \(\newcommand{\rank}{\operatorname{rank}}\) \(\newcommand{\row}{\text{Row}}\) \(\newcommand{\col}{\text{Col}}\) \(\renewcommand{\row}{\text{Row}}\) \(\newcommand{\nul}{\text{Nul}}\) \(\newcommand{\var}{\text{Var}}\) \(\newcommand{\corr}{\text{corr}}\) \(\newcommand{\len}[1]{\left|#1\right|}\) \(\newcommand{\bbar}{\overline{\bvec}}\) \(\newcommand{\bhat}{\widehat{\bvec}}\) \(\newcommand{\bperp}{\bvec^\perp}\) \(\newcommand{\xhat}{\widehat{\xvec}}\) \(\newcommand{\vhat}{\widehat{\vvec}}\) \(\newcommand{\uhat}{\widehat{\uvec}}\) \(\newcommand{\what}{\widehat{\wvec}}\) \(\newcommand{\Sighat}{\widehat{\Sigma}}\) \(\newcommand{\lt}{<}\) \(\newcommand{\gt}{>}\) \(\newcommand{\amp}{&}\) \(\definecolor{fillinmathshade}{gray}{0.9}\)Some of the content on this page was adapted from OpenStax
Download for free at http://cnx.org/contents/30189442-699...2b91b9de@18.13
1. The histogram below shows the “Exam Scores” for a sample of 28 students.
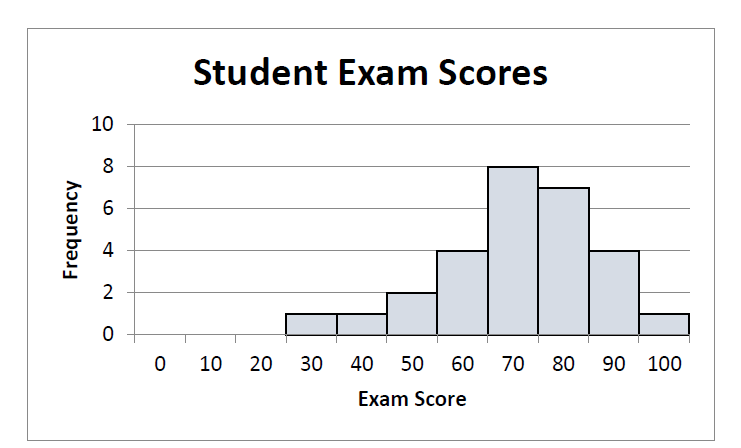
a. Is the distribution symmetric or skewed?
b. Classify the shape of the distribution as bell shaped, uniform, right-skewed, or left-skewed.
c. Do there appear to be any outliers in the data set? Why or why not?
2. The histogram below shows the “Exam Scores” for a sample of 28 students.
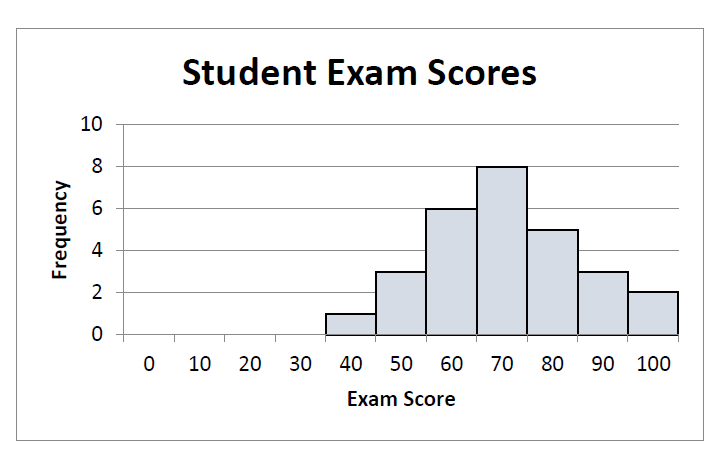
a. Is the distribution symmetric or skewed?
b. Classify the shape of the distribution as bell shaped, uniform, right-skewed, or left-skewed.
c. Do there appear to be any outliers in the data set? Why or why not?
3. The histogram below shows the "Exam Scores" for a sample of 28 students.

a. Is the distribution symmetric or skewed?
b. Classify the shape of the distribution as bell shaped, uniform, rightskewed, or left-skewed.
c. Do there appear to be any outliers in the data set? Why or why not?
4. A student started an online T-shirt business. The histogram below shows the "Number of T-Shirts Sold" over a period of 52 weeks.
T-Shirts Sold
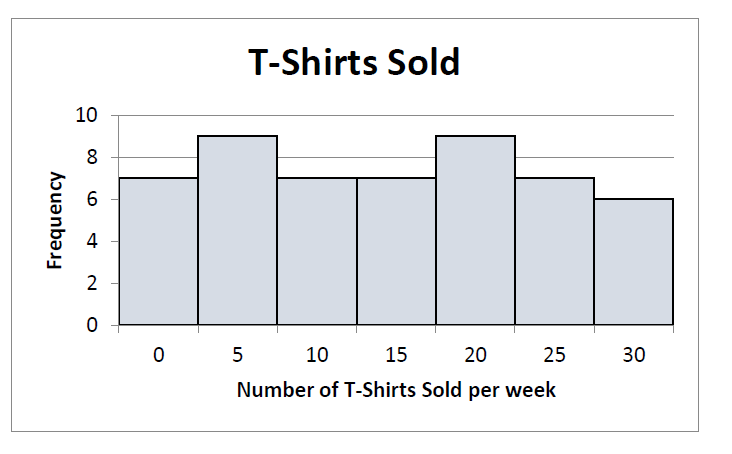
a. Is the distribution symmetric or skewed?
b. Classify the shape of the distribution as bell shaped, uniform, rightskewed, or left-skewed.
c. Do there appear to be any outliers in the data set? Why or why not?
5. A survey was administered at a gym asking people how many hours they spend exercising in one week. The histogram below shows the "Number of Hours Exercising" for a sample of 15 people.
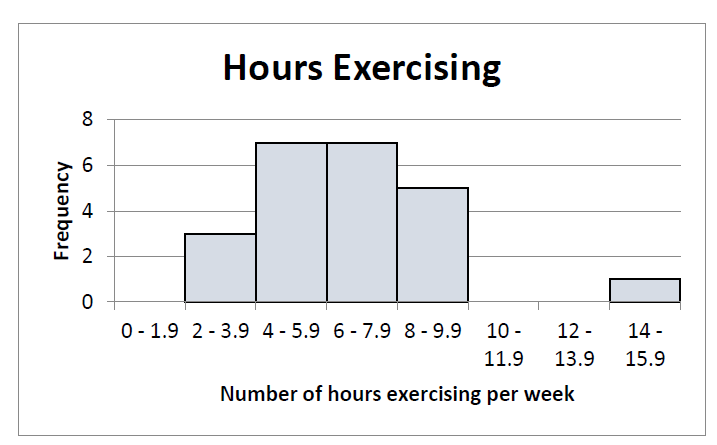
a. Is the distribution symmetric or skewed?
b. Classify the shape of the distribution as bell shaped, uniform, rightskewed, or left-skewed.
c. Do there appear to be any outliers in the data set? Why or why not?
6. A group of diners were asked how much they would pay for a meal. Their responses were: \(\$ 7.50, \$ 8.25, \$ 9.00, \$ 8.00, \$ 7.25, \$ 7.50, \$ 8.00, \$ 7.00\).
a. Find the mean.
b. Find the median.
c. Find the standard deviation.
7. You recorded the time in seconds it took for 8 participants to solve a puzzle. The times were: \(15.2,18.8,19.3,19.7,20.2,21.8,22.1,29.4\).
a. Find the mean.
b. Find the median.
c. Find the standard deviation.
8. Five real estate exam scores are 430, 430, 480, 480, and 495. Find the mode(s).
9. Refer back to the type of pet(s) owned by a sample of individuals:
Dog Dog Dog Cat Bird Cat Turtle Dog Cat Cat Bird Hamster Fish Bird Dog Dog Cat Turtle Hamster Dog Cat Dog Dog Bird
a. What is the mode for type of pet(s) owned?
b. Why is the mode the best measure of center for this data set?
10. Refer to the histogram:

a. What is the mode of the number of children for the group surveyed?
b. Compute the mean number of children for the group surveyed.
c. Compute the median number of children for the group surveyed.
11. Refer to the histogram:

a. What is the mode of the number of shipping days?
b. Compute the mean number of shipping days.
c. Compute the median number of shipping days.
12. Suppose that in a small town of 50 people, one person earns \(\$ 5,000,000\) per year and the other 49 each earn \(\$ 30,000\). Calculate both the mean and the median. Which is the better measure of the "center": the mean or the median?
13. The following table provides the tuition rates (in \(\$\) per credit hour) at a sample of 15 colleges and universities.
|
175 |
416 |
87 |
203 |
180 |
|
257 |
182 |
111 |
315 |
504 |
|
163 |
218 |
744 |
221 |
1300 |
a) Find the mean tuition rate.
b) Find the standard deviation of the tuition rate.
14. A survey of enrollment at 35 community colleges across the United States yielded the following figures:
\[
\begin{array}{l}
6414 ; 1550 ; 2109 ; 9350 ; 21828 ; 4300 ; 5944 ; 5722 ; 2825 ; 2044 ; 5481 ; 5200 ; \\
5853 ; 2750 ; 10012 ; 6357 ; 27000 ; 9414 ; 7681 ; 3200 ; 17500 ; 9200 ; 7380 ; 18314 ; \\
6557 ; 13713 ; 17768 ; 7493 ; 2771 ; 2861 ; 1263 ; 7285 ; 28165 ; 5080 ; 11622
\end{array}
\]
a) Organize the data into a chart with five intervals of equal width. Label the two columns "Enrollment" and "Frequency."
b) Construct a histogram of the data.
c) Calculate the sample mean.
d) Calculate the sample standard deviation.
15. On a baseball team, the ages of each of the players are as follows:
\[
\begin{array}{l}
21 ; 21 ; 22 ; 23 ; 24 ; 24 ; 25 ; 25 ; 28 ; 29 ; 29 ; 31 ; 32 ; 33 ; 33 ; 34 ; 35 ; 36 ; 36 ; 36 ; 36 ; \\
38 ; 38 ; 38 ; 40
\end{array}
\]
a) Organize the data into a chart with five intervals of equal width. Label the two columns "Age" and "Frequency."
b) Construct a histogram of the data.
c) Calculate the sample mean.
d) Calculate the sample standard deviation.
16. Following are the published weights (in pounds) of all of the team members of the San Francisco 49ers from a previous year.
177; 205; 210; 210; 232; 205; 185; 185; 178; 210; 206; 212; 184; 174; 185; 242; 188; 212; 215; 247; 241; 223; 220; 260; 245; 259; 278; 270; 280; 295; 275; 285; 290; 272; 273; 280; 285; 286; 200; 215; 185; 230; 250; 241; 190; 260; 250; 302; 265; 290; 276; 228; 265
a) Find the mean of the data.
b) Find the standard deviation of the data.