
3.1: Functions
- Page ID
- 130956

\( \newcommand{\vecs}[1]{\overset { \scriptstyle \rightharpoonup} {\mathbf{#1}} } \)
\( \newcommand{\vecd}[1]{\overset{-\!-\!\rightharpoonup}{\vphantom{a}\smash {#1}}} \)
\( \newcommand{\dsum}{\displaystyle\sum\limits} \)
\( \newcommand{\dint}{\displaystyle\int\limits} \)
\( \newcommand{\dlim}{\displaystyle\lim\limits} \)
\( \newcommand{\id}{\mathrm{id}}\) \( \newcommand{\Span}{\mathrm{span}}\)
( \newcommand{\kernel}{\mathrm{null}\,}\) \( \newcommand{\range}{\mathrm{range}\,}\)
\( \newcommand{\RealPart}{\mathrm{Re}}\) \( \newcommand{\ImaginaryPart}{\mathrm{Im}}\)
\( \newcommand{\Argument}{\mathrm{Arg}}\) \( \newcommand{\norm}[1]{\| #1 \|}\)
\( \newcommand{\inner}[2]{\langle #1, #2 \rangle}\)
\( \newcommand{\Span}{\mathrm{span}}\)
\( \newcommand{\id}{\mathrm{id}}\)
\( \newcommand{\Span}{\mathrm{span}}\)
\( \newcommand{\kernel}{\mathrm{null}\,}\)
\( \newcommand{\range}{\mathrm{range}\,}\)
\( \newcommand{\RealPart}{\mathrm{Re}}\)
\( \newcommand{\ImaginaryPart}{\mathrm{Im}}\)
\( \newcommand{\Argument}{\mathrm{Arg}}\)
\( \newcommand{\norm}[1]{\| #1 \|}\)
\( \newcommand{\inner}[2]{\langle #1, #2 \rangle}\)
\( \newcommand{\Span}{\mathrm{span}}\) \( \newcommand{\AA}{\unicode[.8,0]{x212B}}\)
\( \newcommand{\vectorA}[1]{\vec{#1}} % arrow\)
\( \newcommand{\vectorAt}[1]{\vec{\text{#1}}} % arrow\)
\( \newcommand{\vectorB}[1]{\overset { \scriptstyle \rightharpoonup} {\mathbf{#1}} } \)
\( \newcommand{\vectorC}[1]{\textbf{#1}} \)
\( \newcommand{\vectorD}[1]{\overrightarrow{#1}} \)
\( \newcommand{\vectorDt}[1]{\overrightarrow{\text{#1}}} \)
\( \newcommand{\vectE}[1]{\overset{-\!-\!\rightharpoonup}{\vphantom{a}\smash{\mathbf {#1}}}} \)
\( \newcommand{\vecs}[1]{\overset { \scriptstyle \rightharpoonup} {\mathbf{#1}} } \)
\(\newcommand{\longvect}{\overrightarrow}\)
\( \newcommand{\vecd}[1]{\overset{-\!-\!\rightharpoonup}{\vphantom{a}\smash {#1}}} \)
\(\newcommand{\avec}{\mathbf a}\) \(\newcommand{\bvec}{\mathbf b}\) \(\newcommand{\cvec}{\mathbf c}\) \(\newcommand{\dvec}{\mathbf d}\) \(\newcommand{\dtil}{\widetilde{\mathbf d}}\) \(\newcommand{\evec}{\mathbf e}\) \(\newcommand{\fvec}{\mathbf f}\) \(\newcommand{\nvec}{\mathbf n}\) \(\newcommand{\pvec}{\mathbf p}\) \(\newcommand{\qvec}{\mathbf q}\) \(\newcommand{\svec}{\mathbf s}\) \(\newcommand{\tvec}{\mathbf t}\) \(\newcommand{\uvec}{\mathbf u}\) \(\newcommand{\vvec}{\mathbf v}\) \(\newcommand{\wvec}{\mathbf w}\) \(\newcommand{\xvec}{\mathbf x}\) \(\newcommand{\yvec}{\mathbf y}\) \(\newcommand{\zvec}{\mathbf z}\) \(\newcommand{\rvec}{\mathbf r}\) \(\newcommand{\mvec}{\mathbf m}\) \(\newcommand{\zerovec}{\mathbf 0}\) \(\newcommand{\onevec}{\mathbf 1}\) \(\newcommand{\real}{\mathbb R}\) \(\newcommand{\twovec}[2]{\left[\begin{array}{r}#1 \\ #2 \end{array}\right]}\) \(\newcommand{\ctwovec}[2]{\left[\begin{array}{c}#1 \\ #2 \end{array}\right]}\) \(\newcommand{\threevec}[3]{\left[\begin{array}{r}#1 \\ #2 \\ #3 \end{array}\right]}\) \(\newcommand{\cthreevec}[3]{\left[\begin{array}{c}#1 \\ #2 \\ #3 \end{array}\right]}\) \(\newcommand{\fourvec}[4]{\left[\begin{array}{r}#1 \\ #2 \\ #3 \\ #4 \end{array}\right]}\) \(\newcommand{\cfourvec}[4]{\left[\begin{array}{c}#1 \\ #2 \\ #3 \\ #4 \end{array}\right]}\) \(\newcommand{\fivevec}[5]{\left[\begin{array}{r}#1 \\ #2 \\ #3 \\ #4 \\ #5 \\ \end{array}\right]}\) \(\newcommand{\cfivevec}[5]{\left[\begin{array}{c}#1 \\ #2 \\ #3 \\ #4 \\ #5 \\ \end{array}\right]}\) \(\newcommand{\mattwo}[4]{\left[\begin{array}{rr}#1 \amp #2 \\ #3 \amp #4 \\ \end{array}\right]}\) \(\newcommand{\laspan}[1]{\text{Span}\{#1\}}\) \(\newcommand{\bcal}{\cal B}\) \(\newcommand{\ccal}{\cal C}\) \(\newcommand{\scal}{\cal S}\) \(\newcommand{\wcal}{\cal W}\) \(\newcommand{\ecal}{\cal E}\) \(\newcommand{\coords}[2]{\left\{#1\right\}_{#2}}\) \(\newcommand{\gray}[1]{\color{gray}{#1}}\) \(\newcommand{\lgray}[1]{\color{lightgray}{#1}}\) \(\newcommand{\rank}{\operatorname{rank}}\) \(\newcommand{\row}{\text{Row}}\) \(\newcommand{\col}{\text{Col}}\) \(\renewcommand{\row}{\text{Row}}\) \(\newcommand{\nul}{\text{Nul}}\) \(\newcommand{\var}{\text{Var}}\) \(\newcommand{\corr}{\text{corr}}\) \(\newcommand{\len}[1]{\left|#1\right|}\) \(\newcommand{\bbar}{\overline{\bvec}}\) \(\newcommand{\bhat}{\widehat{\bvec}}\) \(\newcommand{\bperp}{\bvec^\perp}\) \(\newcommand{\xhat}{\widehat{\xvec}}\) \(\newcommand{\vhat}{\widehat{\vvec}}\) \(\newcommand{\uhat}{\widehat{\uvec}}\) \(\newcommand{\what}{\widehat{\wvec}}\) \(\newcommand{\Sighat}{\widehat{\Sigma}}\) \(\newcommand{\lt}{<}\) \(\newcommand{\gt}{>}\) \(\newcommand{\amp}{&}\) \(\definecolor{fillinmathshade}{gray}{0.9}\)In this section, we will study one of the most fundamental mathematical objects — the function. Later in the book, we will use particular types of functions to describe real-world relationships and make predictions using data. However, we need to start with some general knowledge and concepts involving the notion of a function.
- Recognize examples and non-examples of functions represented in various forms
- Read and compute with functions represented in various forms
- Use function notation to describe the inputs and outputs of various functions in context
Introduction to Functions
A function is a relationship between a set of inputs and a set of outputs such that each input has exactly one output.
Of course, there are many other non-mathematical meanings of the word function. For example, function often means the same thing as purpose or capacity, but that's not quite what the word means mathematically. A more similar meaning is found in the sentence, "a child's height is a function of their age." What this sentence means is that "a child's height tends to depend upon their age." This is similar to our meaning of the word function, but it's still not quite the same. The mathematical word function indicates a dependence — the outputs will usually be dependent upon the inputs — but we also require that each input correspond with exactly one output.
Functions are useful in a number of real-world contexts. Scientific trials are often designed to detect the effect of an input variable on an output variable. As an example, consider a clinical trial of a pharmaceutical drug. A doctor might want to measure the percent of the drug remaining in a person's body at various times after the person has ingested the drug. That relationship is functional in the sense that, at each particular amount of time following the ingestion, there is a particular amount of the drug left. A doctor could look at the data of the times and percents, begin to see a pattern, and make predictions based on those observations. The fact that each time value is related to a single percent value means this relationship is a function.
We will explore several examples and non-examples of functions so you can see what sorts of relationships qualify as functions. We will also learn several different ways to express functions, each of which will be useful in different contexts.
We start with functions described in words. We use an example involving Social Security numbers. We acknowledge that not every person reading this book will have a Social Security number; however, it is a useful example to explain this concept. The background information that you need is: every citizen of the United States is assigned a 9-digit number, called their Social Security number, that is unique to them during their lifetime (meaning they are the only living person who is associated to that number). It is used as an identifying number when filing government documents. For the purposes of this example, we will ignore the possibility of identity theft.
- Consider the relationship whose input is a person's Social Security number and whose output is their name. Is this relationship a function? Why or why not?
- Consider the relationship whose input is a person's name and whose output is their Social Security number. Is this relationship a function? Why or why not?
Solution
- This relationship is a function. The inputs are Social Security numbers and the outputs are names. For each input, which is a Social Security number, there is exactly one name associated to that number. Said another way, a single number cannot be associated to two separate names. Therefore, each input has exactly one output, and so this relationship is a function.
- This relationship is not a function. It is certainly the case that some names are associated with multiple Social Security numbers. For example, the name Leanne Merrill has at least three Social Security numbers associated to it. Therefore, the input "Leanne Merrill" has at least three different outputs. Therefore, this relationship is not a function, because there is more than one output associated to one of its inputs.
This example shows that a relationship can be a function "in one direction" and not in the other. That is, when we took the Social Security numbers as inputs and names as outputs, we had a function. But when we went the other way, from names to Social Security numbers, it was no longer a functional relationship. This is important to keep in mind!
Function Representations
Now that we've defined the notion of a function, we will talk about different ways to represent functions. These representations will help us understand why functions are useful in different contexts.
We will look at four different ways to represent functions:
- Using words
- Using a table
- Using a formula
- Using a graph
We have already seen how to express functions in words. The Social Security example from the previous section shows how a function might be expressed in words.
Next, we'll look at functions expressed via tables, often called a table of values. When reading a function as a table, read across: the output associated with a given input is in the same row.
Do the following tables represent functions? Why or why not?
-
Input Output 0 1 1 2 2 3 3 1 -
Input Output 1 3 2 5 4 9 2 1
Solution
In this example, Table 1 is a function and Table 2 is not.
In Table 1, each input is associated to a single output. There is no input that has multiple outputs. Therefore, Table 1 represents a function.
In Table 2, the input \(2\) has two different outputs, namely \(5\) and \(1\). Therefore, Table 2 does not represent a function, since there is an input that has more than one output.
A common issue that occurs when learning about functions is to confuse the notions of function and pattern. Looking at Table 1 from the previous example: we said that Table 1 represents a function. But you may have noticed that the outputs do not appear to follow a predictable pattern. If there were a pattern, we might expect that the output of \(3\) is \(4\). But it's not — it's \(1\). Additionally, it may seem like a problem that the output of \(1\) is repeated. That's also allowed in a function! The thing to avoid is repeated inputs.
Of course, many functions do follow patterns, and some functions have unique outputs as well. But those are not strictly necessary for the definition of function.
Next, we'll look at functions expressed using formulas and graphs. We'll see that tables play an important role.
Consider the function \(y = -3x + 10\), where \(x\) is the input and \(y\) is the output. Make a partial table of values for \(y\) using the values \(x = 0, 1, 2, 3\). Then sketch a graph of the function \(y = -3x + 10\).
Solution
In this example, we will use the given formula to find a table of values for this function. We will take the values of \(x\) that are given an substitute them, or "plug them in," to the formula for the function. When \(x = 0\), we have \[y = -3(0) + 10 = 10\]
Therefore, if the input of this function is 0, the output is 10.
Likewise, if \(x = 1\), we have \[y = -3(1) + 10 = 7\]
Therefore, if the input of this function is \(1\), the output is \(7\).
We continue in this way. We see that the input \(2\) has output \(4\), and the input \(3\) has output \(1\).
We will summarize this information using a table of values for the function:
| Input | Output |
| 0 | 10 |
| 1 | 7 |
| 2 | 4 |
| 3 | 1 |
Now, we will draw the graph for this function. In order to do that, we will view the rows of the table as ordered pairs \((x,y)\). We will show these ordered pairs on a graph.
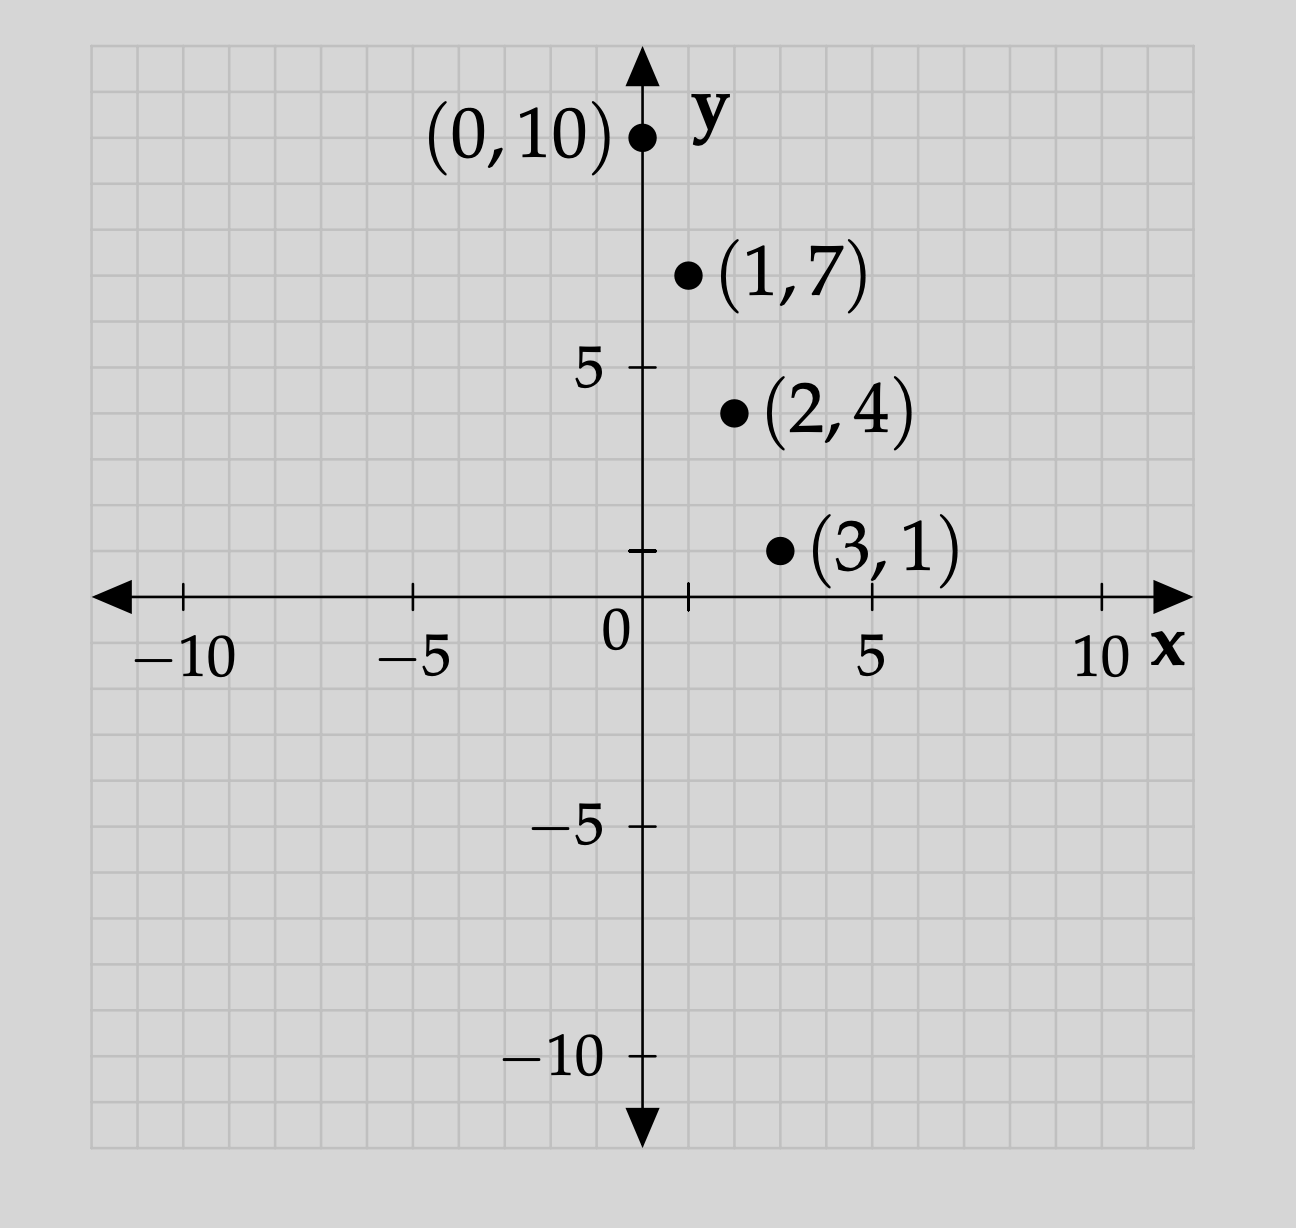
As a quick review of graphing: the first number \(x\) in the ordered pair \((x,y)\) denotes the location of the point relative to the horizontal axis (which is often labeled the \(x\)-axis, as it is here). The second number \(y\) in the ordered pair \((x,y)\) denotes the location of the point relative to the vertical axis (which is often labeled the \(y\)-axis, as it is here). So, for example, the point \((3,1)\) lies at a value of \(3\) on the horizontal access and a value of \(1\) on the vertical axis. This point is uniquely described by this ordered pair.
Now that we have the points from the table, we will sketch the smoothest curve that we can between these points. In this case, the "curve" is a straight line. Therefore, the graph of this function will look like the thick line in the picture below:
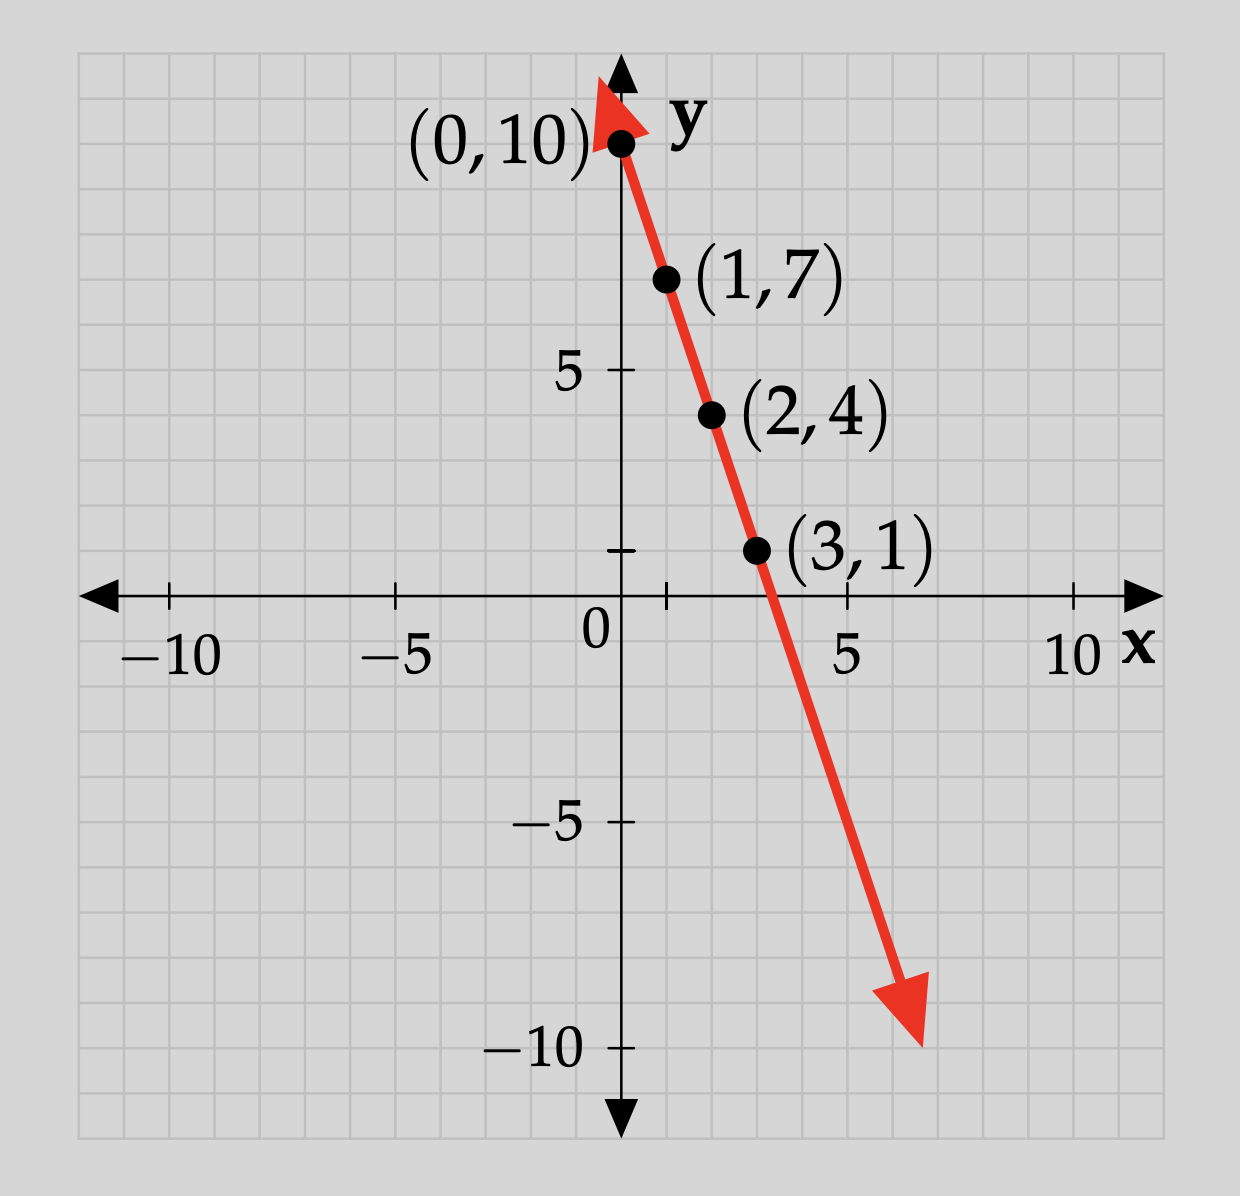
The technique outlined in the previous example is very useful. If we are given a function as a formula, we can create a table of values for that function, and then use that table of values to graph the function. This technique ties together the formula, table, and graph representations of a function.
Function Notation
When we work with functions, it is helpful to have the following notational convention.
We will often give a function a single letter name, such as \(f\). We write \(f(x)\) to mean "the output of \(f\) associated to \(x\)." This symbol \(f(x)\) is said verbally as "\(f\) of \(x\)."
The parentheses denote the place where the input is "plugged in" to the function \(f\). If we choose a value to substitute for \(x\), we say that we are evaluating \(f\) at that value of \(x\
We highlight a common confusion about this notation below.
The notation above, \(f(x)\), does NOT indicate that \(f\) is being multiplied by \(x\). It symbolizes \(f\) as a function with an input of \(x\).
Let's see an example to understand this notation.
Define a function \(f\) by \(f(x) = 2x^2 + 1\). Find the following values:
- \(f(0)\)
- \(f(3)\)
- \(f(-1)\)
Solution
We will find these values using the definition of function notation. For \(f(0)\), we will express \[f(0) = 2(0)^2 + 1 = 2 \times 0 + 1 = 0 +1 = 1\]
That is, we are "plugging in," or substituting, the number \(0\) where \(x\) is. Then we simplify to get a numerical answer. This is the general way that function evaluation works.
For \(f(3)\), we will use a similar technique. We will substitute \(x = 3\) into \(f(x)\): \[f(x) = 2(3)^2 + 1 = 2 \times 9 + 1 = 19\]
So that means \(f(3) = 19\).
For \(f(-1)\), we need to be careful with order of operations, remembering that exponents happen before multiplication. We have: \[f(-1) = 2(-1)^2 + 1 = 2 \times 1 + 1 = 3\]
as a negative multiplied by a negative becomes positive. Therefore, \(f(-1) = 3\).
We will end with an example of function notation in context. Note that will use different letters for the function and its input here. We often do this if the context calls for it.
Let \(C(g) = 10g + 60\) be the function that gives the cost of a monthly cell phone plan, in dollars, based on the number \(g\) of gigabytes of data used by the cell phone. Find the amount that the plan will cost if \(4\) gigabytes of data are used.
Solution
We have that \(C(g)\) is the cost associated to \(g\) gigabytes of data used. That is, the input is the number of gigabytes of data used, and the output is the cost of the cell phone plan in dollars. If you use \(4\) gigabytes of data, that means that \(g = 4\). That means the cost of the cell phone plan will be \(C(4)\), which we can calculate as \[ C(4) = 10(4) + 60 = 10 \times 4 + 60 = 40 + 60 = 100\]
Therefore, if \(4\) gigabytes of data are used, it will cost \(\$100\).
We will see soon how useful functions can be in making predictions and summarizing data.
Exercises
Throughout this homework, if you need to make a graph you can either hand-write or use an online graphing program (such as Desmos.com) to create a graph.
- Give an example of a function described in words that is different from those given in the text. (Something similar to the Social Security example, but a different context). You should write 2-3 sentences to explain your example.
- Consider the following tables. Which ones represent functions, and which ones do not? Explain your reasoning for each table in a sentence or two.
-
Input Output 3 0 -5 -1 0 8 3 1 -
Input Output 1 42 2 42 3 42 4 42
-
- Find the following quantities. Please round decimal answers to three places.
- Let \(f(x) = 5x-4\). Find \(f(1)\).
- Let \(g(x) = 3x^2 + 9\). Find \(g(0)\).
- Let \(h(x) = \frac{5x-1}{7x + 2}\). Find \(h(2)\).
- Let \(l(x) = .01(2^x)\). Find \(l(6)\).
- Suppose that the price \(P\) of a gallon of gas, in dollars, is a function of the demand \(d\) of gas, in billions of gallons used in a given day. The function is given by \(P(d) = 1.34d\).
- Evaluate \(P(2)\) and interpret your answer. That is, say what your numerical answer means in the context of the problem.
- Make a table of values for \(P(d)\), using the values \(d = 0, 1, 2, 3\).
- Graph the function \(P(d)\) based on the table of values from the previous part. You can do this by hand or use a graphing program such as Desmos.
- Respond to the following prompts in 2-4 sentences: Does this seem like an accurate model of the price of gas? Why or why not? What additional restrictions or caveats might you suggest to make this model more accurate?