
3.E: Derivatives (ALL Chapter 3 Exercises)


- Last updated
- Jun 6, 2019
- Save as PDF
( \newcommand{\kernel}{\mathrm{null}\,}\)
3.1: Defining the Derivative
For the following exercises, use Equation to find the slope of the secant line between the values
1)
Solution:
2)
3)
Solution:
4)
5)
Solution:
6)
7)
Solution:
8)
9)
Solution: 0.25
10)
For the following functions,
a. use Equation to find the slope of the tangent line
b. find the equation of the tangent line to
11)
Solution:
12)
13)
Solution:
14)
15)
Solution:
16)
17)
Solution:
18)
19)
Solution:
20)
For the following functions
21)
Solution:
22)
23)
Solution:
24)
25)
Solution:
26)
27)
Solution:
28)
29)
Solution:
30)
For the following exercises, given the function
a. find the slope of the secant line
b. Use the answers from a. to estimate the value of the slope of the tangent line at
c. Use the answer from b. to find the equation of the tangent line to
31) [T]
| 1.1 | (i) | 0.9 | (vii) |
| 1.01 | (ii) | 0.99 | (viii) |
| 1.001 | (iii) | 0.999 | (ix) |
| 1.0001 | (iv) | 0.9999 | (x) |
| 1.00001 | (v) | 0.99999 | (xi) |
| 1.000001 | (vi) | 0.999999 | (xii) |
Solution:
b.
c.
32) [T]
| 0.1 | (i) | −0.1 | (vii) |
| 0.01 | (ii) | −0.01 | (viii) |
| 0.001 | (iii) | −0.001 | (ix) |
| 0.0001 | (iv) | −0.0001 | (x) |
| 0.00001 | (v) | −0.00001 | (xi) |
| 0.000001 | (vi) | −0.000001 | (xii) |
33) [T]
| −0.1 | (i) |
| −0.01 | (ii) |
| −0.001 | (iii) |
| −0.0001 | (iv) |
| −0.00001 | (v) |
| −0.000001 | (vi) |
Solution:
b.
c.
34) [T]
| 3.1 | (i) |
| 3.14 | (ii) |
| 3.141 | (iii) |
| 3.1415 | (iv) |
| 3.14159 | (v) |
| 3.141592 | (vi) |
[T] For the following position functions
a. the simplified expression for the average velocity from
b. the average velocity between
c. use the answer from a. to estimate the instantaneous velocity at
35)
Solution:
36)
37)
Solution: a.
b.
38)
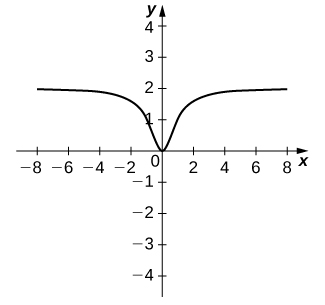
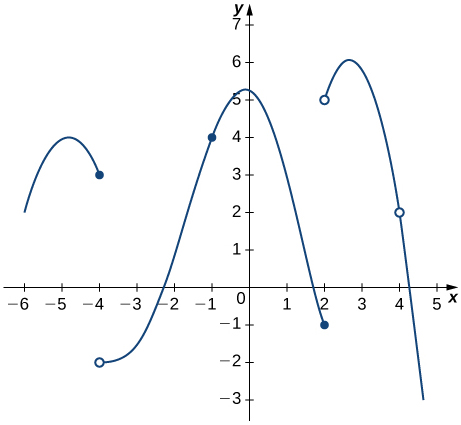
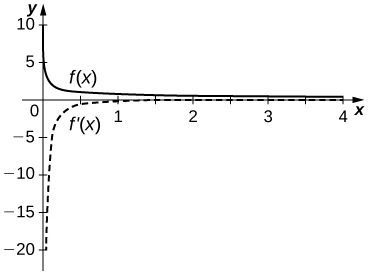
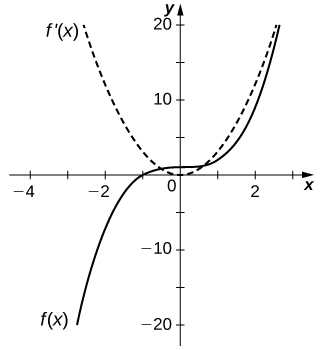
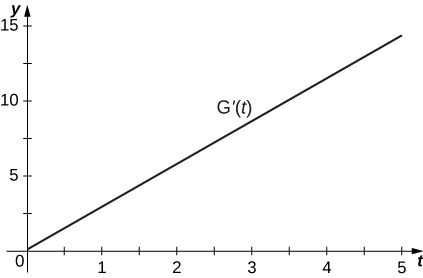
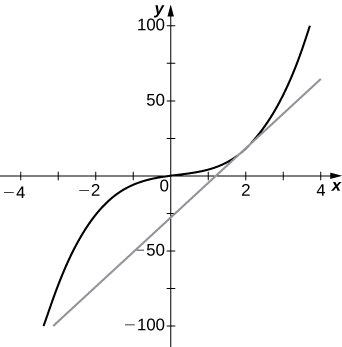
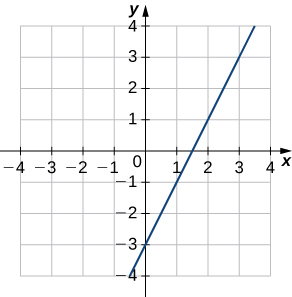
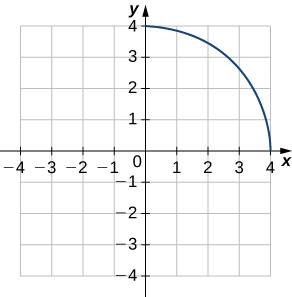
39) Use the following graph to evaluate a.
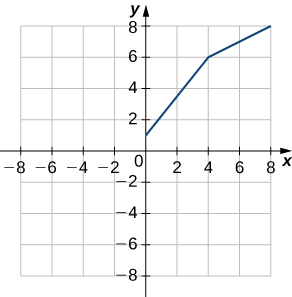
Solution:
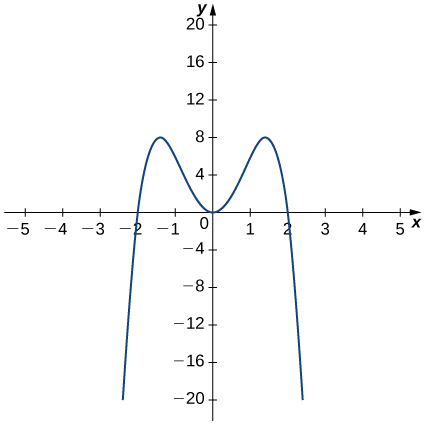
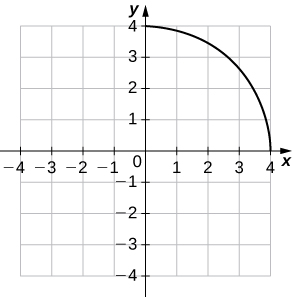
40) Use the following graph to evaluate a.
For the following exercises, use the limit definition of derivative to show that the derivative does not exist at x=a for each of the given functions.
41)
Solution:
42)
43)
Solution:
44)
45) [T] The position in feet of a race car along a straight track after
a. Find the average velocity of the vehicle over the following time intervals to four decimal places:
i. [
ii. [
iii. [
iv. [
b. Use a. to draw a conclusion about the instantaneous velocity of the vehicle at
Solution:
b. At
46) [T] The distance in feet that a ball rolls down an incline is modeled by the function
where t is seconds after the ball begins rolling.
a. Find the average velocity of the ball over the following time intervals:
i. [5, 5.1]
ii. [5, 5.01]
iii. [5, 5.001]
iv. [5, 5.0001]
b. Use the answers from a. to draw a conclusion about the instantaneous velocity of the ball at
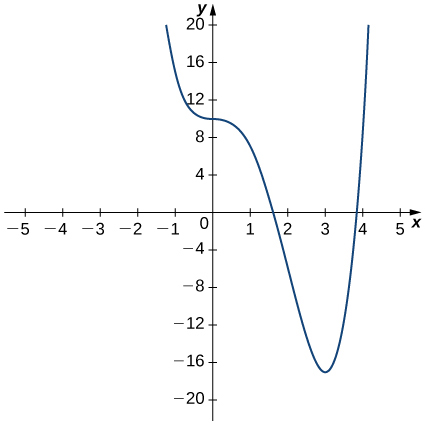
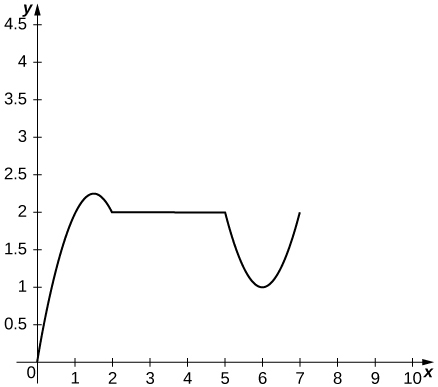
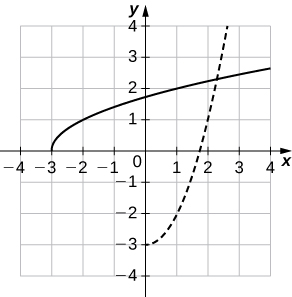
47) Two vehicles start out traveling side by side along a straight road. Their position functions, shown in the following graph, are given by
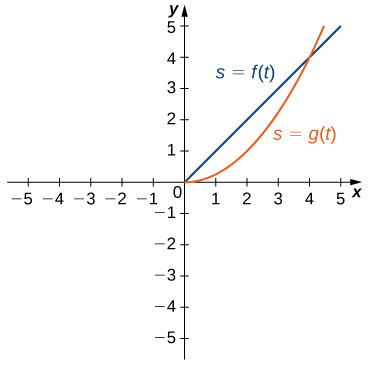
a. Which vehicle has traveled farther at
b. What is the approximate velocity of each vehicle at
c. Which vehicle is traveling faster at
d. What is true about the positions of the vehicles at
Solution: a. The vehicle represented by
b. The velocity of
c. The vehicle represented by
48) [T] The total cost
a. Calculate the average cost per jar over the following intervals:
i. [100, 100.1]
ii. [100, 100.01]
iii. [100, 100.001]
iv. [100, 100.0001]
b. Use the answers from a. to estimate the average cost to produce
49) [T] For the function
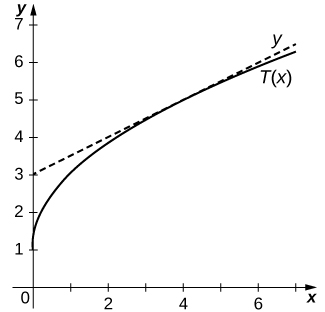
a. Use a graphing calculator to graph f in an appropriate viewing window.
b. Use the ZOOM feature on the calculator to approximate the two values of
Solution: a.
b.
50) [T] For the function
a. Use a graphing calculator to graph f in an appropriate viewing window.
b. Use the ZOOM feature on the calculator to approximate the values of
51) Suppose that
a. Find a mathematical expression for
b. What is
c. What is
Solution: a.
b. ∼
c.
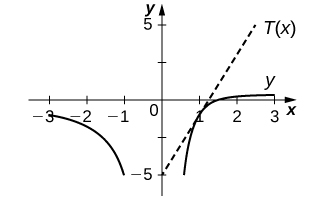
52) [T] For the function
a. Use a graphing calculator to graph
b. Use the
53) [T] For the function
a. Use a graphing calculator to graph
b. Use the
Solution: a.
b.
3.2: The Derivative as a Function
Exercise:
For the following exercises, use the definition of a derivative to find
1)
2)
Solution:
3)
4)
Solution:
5)
6)
Solution:
7)
8)
Solution:
9)
10)
Solution:
For the following exercises, use the graph of
11)
12)
Solution:
13)
14)
Solution:
For the following exercises, the given limit represents the derivative of a function
15)
16) \(lim_{h→0}\frac{[3(2+h)^2+2]−14}{h}
Solution:
17)
18)
Solution:
19)
20)
Solution:
For the following functions,
a. sketch the graph and
b. use the definition of a derivative to show that the function is not differentiable at
21)
22)
Solution:
a.
b.
23)
24)
a.

b.
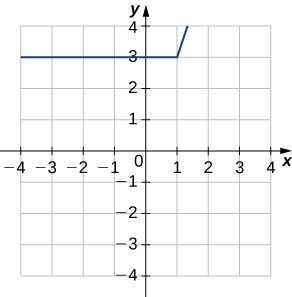
For the following graphs,
a. determine for which values of
b. determine for which values of
25)
26)
Solution:
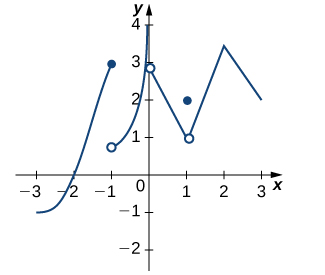
27) Use the graph to evaluate
For the following functions, use
28)
Solution:
29)
30)
Solution:
For the following exercises, use a calculator to graph
31)
32)
Solution:
33)
34)
Solution:
35)
36)
Solution:
For the following exercises, describe what the two expressions represent in terms of each of the given situations. Be sure to include units.
a.
b.
37)
38)
Solution:
a. Average rate at which customers spent on concessions in thousands per customer.
b. Rate (in thousands per customer) at which
39)
40)
a. Average grade received on the test with an average study time between two values.
b. Rate (in percentage points per hour) at which the grade on the test increased or decreased for a given average study time of
41)
42)
Solution:
a. Average change of atmospheric pressure between two different altitudes.
b. Rate (torr per foot) at which atmospheric pressure is increasing or decreasing at
43) Sketch the graph of a function
a.
b.
c.
d.
e.
f.
44) Suppose temperature T in degrees Fahrenheit at a height
a. Give a physical interpretation, with units, of
b. If we know that
Solution:
a. The rate (in degrees per foot) at which temperature is increasing or decreasing for a given height
b. The rate of change of temperature as altitude changes at
45) Suppose the total profit of a company is
a. What does
b. What does
c. Suppose that
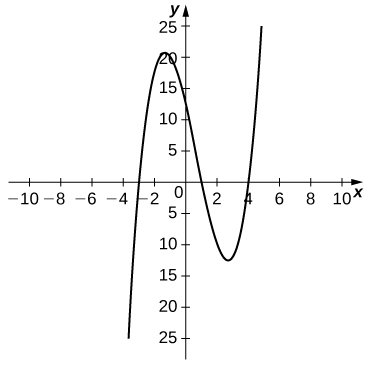
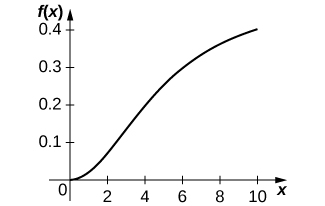
46) The graph in the following figure models the number of people
a. Describe what
b. What does the derivative tell us about how this town is affected by the flu outbreak?
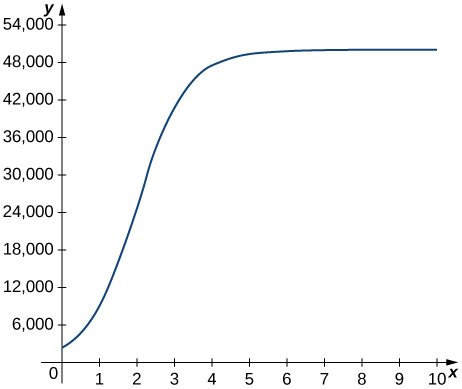
Solution: a. The rate at which the number of people who have come down with the flu is changing t weeks after the initial outbreak. b. The rate is increasing sharply up to the third week, at which point it slows down and then becomes constant.
For the following exercises, use the following table, which shows the height
| 0 | 0 |
| 1 | 2 |
| 2 | 4 |
| 3 | 13 |
| 4 | 25 |
| 5 | 32 |
47) What is the physical meaning of
48) [T] Construct a table of values for
Solution:
| 0 | 2 |
| 1 | 2 |
| 2 | 5.5 |
| 3 | 10.5 |
| 4 | 9.5 |
| 5 | 7 |
49) [T] The best linear fit to the data is given by
50) [T] The best quadratic fit to the data is given by
Solution:
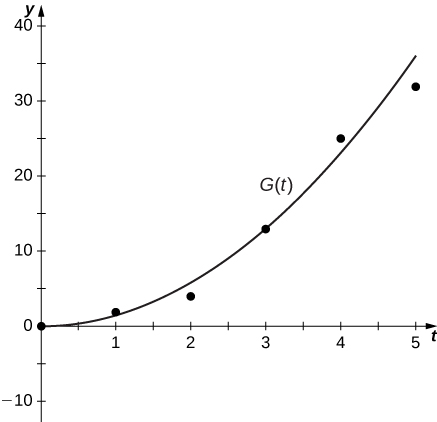
51) [T] The best cubic fit to the data is given by
52) Using the best linear, quadratic, and cubic fits to the data, determine what
Solution:
3.3: Differentiation Rules
Exercise:
For the following exercises, find
1)
2)
Solution:
3)
4)
Solution:
5)
6)
Solution:
7)
8)
Solution:
9)
10) \(f(x)=\frac{4x^3−2x+1}{x^2}
Solution:
11)
12)
Solution:
For the following exercises, find the equation of the tangent line
13) [T]
14) [T]
Solution:
15) [T]
16) [T]
Solution:
For the following exercises, assume that
17)
18)
Solution:
19)
20)
Solution:
For the following exercises, assume that f(x) and g(x) are both differentiable functions with values as given in the following table. Use the following table to calculate the following derivatives.
| 1 | 2 | 3 | 4 | |
| 3 | 5 | −2 | 0 | |
| 2 | 3 | −4 | 6 | |
| −1 | 7 | 8 | −3 | |
| 4 | 1 | 2 | 9 |
21) Find
22) Find
Solution:
23) Find
24) Find
Solution: Undefined
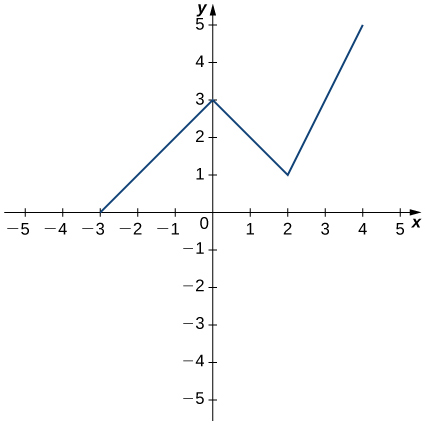
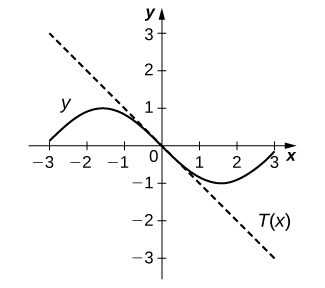
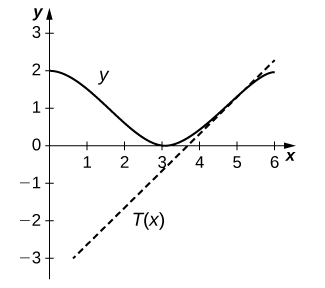
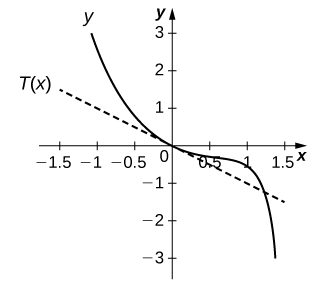
For the following exercises, use the following figure to find the indicated derivatives, if they exist.For the following exercises, use the following figure to find the indicated derivatives, if they exist.
25) Let
a)
b)
c)
26) Let
a)
b)
c)
Solution: a.
27) Let
a)
b)
c)
For the following exercises,
a) evaluate
b) graph the function
28) [T]
Solution: a. 23, b.
29) [T]
30) [T]
Solution: a. 3, b.

31) [T]
32) Find the equation of the tangent line to the graph of
Solution:
33) Find the equation of the tangent line to the graph of
34) Find the equation of the tangent line to the graph of
Solution:
35) Find the point on the graph of
intercept of 6.
36) Find the equation of the line passing through the point
Solution:
37) Determine all points on the graph of
a. horizontal
b. −1.
38) Find a quadratic polynomial such that
Solution: ](y=−3x^2+9x−1\)
39) A car driving along a freeway with traffic has traveled
a. Determine the time in seconds when the velocity of the car is 0.
b. Determine the acceleration of the car when the velocity is 0.
[T] A herring swimming along a straight line has traveled
seconds.
40) Determine the velocity of the herring when it has traveled 3 seconds.
Solution:
41) The population in millions of arctic flounder in the Atlantic Ocean is modeled by the function
a. Determine the initial flounder population.
b. Determine
42) [T] The concentration of antibiotic in the bloodstream
a. Find the rate of change of
b. Determine the rate of change for
c. Briefly describe what seems to be occurring as the number of hours increases.
Solution:
43) A book publisher has a cost function given by
44) [T] According to Newton’s law of universal gravitation, the force
a. Suppose that
b. Find the rate of change of force
Solution:
3.4: Derivatives as Rates of Change
Exercise:
For the following exercises, the given functions represent the position of a particle traveling along a horizontal line.
a. Find the velocity and acceleration functions.
b. Determine the time intervals when the object is slowing down or speeding up.
1)
2)
Solution: a.
3)
4) A rocket is fired vertically upward from the ground. The distance s in feet that the rocket travels from the ground after t seconds is given by
a. Find the velocity of the rocket 3 seconds after being fired.
b. Find the acceleration of the rocket 3 seconds after being fired.
Solution:
5) A ball is thrown downward with a speed of 8 ft/s from the top of a 64-foot-tall building. After t seconds, its height above the ground is given by
a. Determine how long it takes for the ball to hit the ground.
b. Determine the velocity of the ball when it hits the ground.
6) The position function
a. Determine the velocity of the car when
b. Determine the velocity of the car when
Solution:
7) The position of a hummingbird flying along a straight line in t seconds is given by
a. Determine the velocity of the bird at
b. Determine the acceleration of the bird at
c. Determine the acceleration of the bird when the velocity equals 0.
8) A potato is launched vertically upward with an initial velocity of 100 ft/s from a potato gun at the top of an 85-foot-tall building. The distance in feet that the potato travels from the ground after
a. Find the velocity of the potato after
b. Find the speed of the potato at 0.5 s and 5.75 s.
c. Determine when the potato reaches its maximum height.
d. Find the acceleration of the potato at 0.5 s and 1.5 s.
e. Determine how long the potato is in the air.
f. Determine the velocity of the potato upon hitting the ground.
Solution: a. 84 ft/s, −84 ft/s b. 84 ft/s c.
9) The position function
a. Determine the direction the train is traveling when
b. Determine the direction the train is traveling when
c. Determine the time intervals when the train is slowing down or speeding up.
10) The following graph shows the position
a. Use the graph of the position function to determine the time intervals when the velocity is positive, negative, or zero.
b. Sketch the graph of the velocity function.
c. Use the graph of the velocity function to determine the time intervals when the acceleration is positive, negative, or zero.
d. Determine the time intervals when the object is speeding up or slowing down.
Solution: a. Velocity is positive on
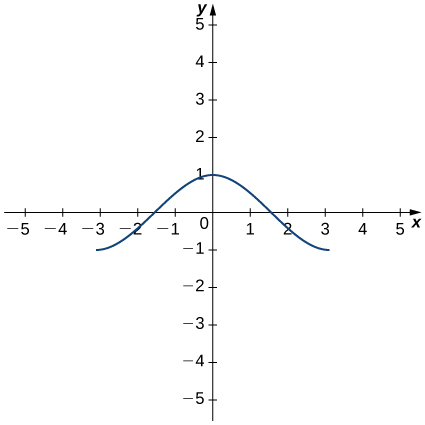
b.
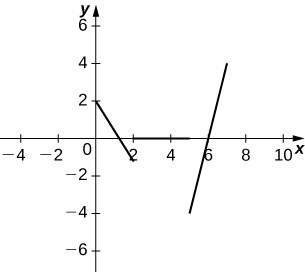
c. Acceleration is positive on
11) The cost function, in dollars, of a company that manufactures food processors is given by
a. Find the marginal cost function.
b. Find the marginal cost of manufacturing 12 food processors.
c. Find the actual cost of manufacturing the thirteenth food processor.
12) The price p (in dollars) and the demand x for a certain digital clock radio is given by the price–demand function
a. Find the revenue function
b. Find the marginal revenue function.
c. Find the marginal revenue at
Solution: a.
13) [T] A profit is earned when revenue exceeds cost. Suppose the profit function for a skateboard manufacturer is given by
a. Find the exact profit from the sale of the thirtieth skateboard.
b. Find the marginal profit function and use it to estimate the profit from the sale of the thirtieth skateboard.
14) [T] In general, the profit function is the difference between the revenue and cost functions:
Suppose the price-demand and cost functions for the production of cordless drills is given respectively by
a. Find the marginal cost function.
b. Find the revenue and marginal revenue functions.
c. Find
d. Find the profit and marginal profit functions.
e. Find
Solution: a.
15) A small town in Ohio commissioned an actuarial firm to conduct a study that modeled the rate of change of the town’s population. The study found that the town’s population (measured in thousands of people) can be modeled by the function
a. Find the rate of change function
b. Find
c. Find
16) [T] A culture of bacteria grows in number according to the function
a. Find the rate of change of the number of bacteria.
b. Find
c. Interpret the results in (b).
d. Find
Solution: a.
17) The centripetal force of an object of mass m is given by
a. Find the rate of change of centripetal force with respect to the distance from the center of rotation.
b. Find the rate of change of centripetal force of an object with mass 1000 kilograms, velocity of 13.89 m/s, and a distance from the center of rotation of 200 meters.
The following questions concern the population (in millions) of London by decade in the 19th century, which is listed in the following table.
| Year Since 1800 | Population (millions) |
| 1 | 0.8975 |
| 11 | 1.040 |
| 21 | 1.264 |
| 31 | 1.516 |
| 41 | 1.661 |
| 51 | 2.000 |
| 61 | 2.634 |
| 71 | 3.272 |
| 81 | 3.911 |
| 91 | 4.422 |
Population of LondonSource: http://en.wikipedia.org/wiki/Demographics_of_London
18) [T]
a. Using a calculator or a computer program, find the best-fit linear function to measure the population.
b. Find the derivative of the equation in a. and explain its physical meaning.
c. Find the second derivative of the equation and explain its physical meaning.
Solution: a.
19) [T]
a. Using a calculator or a computer program, find the best-fit quadratic curve through the data.
b. Find the derivative of the equation and explain its physical meaning.
c. Find the second derivative of the equation and explain its physical meaning.
For the following exercises, consider an astronaut on a large planet in another galaxy. To learn more about the composition of this planet, the astronaut drops an electronic sensor into a deep trench. The sensor transmits its vertical position every second in relation to the astronaut’s position. The summary of the falling sensor data is displayed in the following table.
| Time after dropping (s) | Position (m) |
| 0 | 0 |
| 1 | −1 |
| 2 | −2 |
| 3 | −5 |
| 4 | −7 |
| 5 | −14 |
20) [T]
a. Using a calculator or computer program, find the best-fit quadratic curve to the data.
b. Find the derivative of the position function and explain its physical meaning.
c. Find the second derivative of the position function and explain its physical meaning.
Solution: a.
21) [T]
a. Using a calculator or computer program, find the best-fit cubic curve to the data.
b. Find the derivative of the position function and explain its physical meaning.
c. Find the second derivative of the position function and explain its physical meaning.
d. Using the result from c. explain why a cubic function is not a good choice for this problem.
The following problems deal with the Holling type I, II, and III equations. These equations describe the ecological event of growth of a predator population given the amount of prey available for consumption.
22) [T] The Holling type I equation is described by
a. Graph the Holling type I equation, given
b. Determine the first derivative of the Holling type I equation and explain physically what the derivative implies.
c. Determine the second derivative of the Holling type I equation and explain physically what the derivative implies.
d. Using the interpretations from b. and c. explain why the Holling type I equation may not be realistic.
Solution:
a.
b.
23) [T] The Holling type II equation is described by
a. Graph the Holling type II equation given
b. Take the first derivative of the Holling type II equation and interpret the physical meaning of the derivative.
c. Show that
d. Find and interpret the meaning of the second derivative. What makes the Holling type II function more realistic than the Holling type I function?
24) [T] The Holling type III equation is described by
a. Graph the Holling type III equation given
b. Take the first derivative of the Holling type III equation and interpret the physical meaning of the derivative.
c. Find and interpret the meaning of the second derivative (it may help to graph the second derivative).
d. What additional ecological phenomena does the Holling type III function describe compared with the Holling type II function?
Solution:
a.
b.
25) [T] The populations of the snowshoe hare (in thousands) and the lynx (in hundreds) collected over 7 years from 1937 to 1943 are shown in the following table. The snowshoe hare is the primary prey of the lynx.
| Population of snowshoe hare (thousands) | Population of lynx (hundreds) |
| 20 | 10 |
| 5 | 15 |
| 65 | 55 |
| 95 | 60 |
Snowshoe Hare and Lynx PopulationsSource: http://www.biotopics.co.uk/newgcse/predatorprey.html.
a. Graph the data points and determine which Holling-type function fits the data best.
b. Using the meanings of the parameters
c. Plot the resulting Holling-type I, II, and III functions on top of the data. Was the result from part a. correct?
3.5: Derivatives of Trigonometric Functions
Exercise:
For the following exercises, find
1)
Solution:
2)
3)
Solution:
4)
5)
Solution:
6)
7)
Solution:
8)
9)
Solution:
10)
For the following exercises, find the equation of the tangent line to each of the given functions at the indicated values of
11)
Solution:
12)
13)
Solution:
14)
15)
Solution:
16)
For the following exercises, find
17)
Solution:
18)
19)
Solution:
20)
21)
Solution:
22)
23) Find all
Solution:
24) Find all
25) Let
Solution:
26) [T] A mass on a spring bounces up and down in simple harmonic motion, modeled by the function
27) Let the position of a swinging pendulum in simple harmonic motion be given by
Solution:
28) After a diver jumps off a diving board, the edge of the board oscillates with position given by
a. Sketch one period of the position function for
b. Find the velocity function.
c. Sketch one period of the velocity function for
d. Determine the times when the velocity is 0 over one period.
e. Find the acceleration function.
f. Sketch one period of the acceleration function for
29) The number of hamburgers sold at a fast-food restaurant in Pasadena, California, is given by
Solution:
30) [T] The amount of rainfall per month in Phoenix, Arizona, can be approximated by
For the following exercises, use the quotient rule to derive the given equations.
31)
32)
33)
Use the definition of derivative and the identity
Solution:
For the following exercises, find the requested higher-order derivative for the given functions.
34)
Solution:
35)
36)
Solution:
37)
38)
Solution:
3.6: The Chain Rule
Exercise:
For the following exercises, given
1)
2)
Solution:
3)
4)
Solution:
5)
6)
Solution:
For each of the following exercises,
a. decompose each function in the form
b. find
7)
8)
Solution: a.
9)
10)
Solution:
11)
12)
Solution:
13)
14)
a.
For the following exercises, find
15)
16)
Solution:
17)
18)
Solution:
19)
20)
Soution:
21)
22)
Solution:
23)
24)
Solution:
25) Let
26) Let
Solution:
27) Let
28) [T] Find the equation of the tangent line to
Solution:
29) [T] Find the equation of the tangent line to
30) Find the
Solution:
31) [T] Find an equation of the line that is normal to
For the following exercises, use the information in the following table to find
| 0 | 2 | 5 | 0 | 2 |
| 1 | 1 | −2 | 3 | 0 |
| 2 | 4 | 4 | 1 | −1 |
| 3 | 3 | −3 | 2 | 3 |
32)
Solution:
33)
34)
Solution:
35)
36)
Solution:
37)
38)
Solution:
39) h(x)=f(g(sinx));a=0
40) [T] The position function of a freight train is given by
a. velocity and
b. acceleration.
c. Using a. and b. is the train speeding up or slowing down?
Solution:
41) [T] A mass hanging from a vertical spring is in simple harmonic motion as given by the following position function, where t is measured in seconds and
a. Determine the position of the spring at
b. Find the velocity of the spring at
42) [T] The total cost to produce
a. Find the marginal cost
b. Use Leibniz’s notation for the chain rule,
c. Use b. to determine how fast costs are increasing when
Solution:
43) [T] The formula for the area of a circle is
a. Suppose
b. Use a. to find the rate at which the area is expanding at
44) [T] The formula for the volume of a sphere is
a. Suppose
b. Use a. to find the rate at which the volume is changing at
Solution:
45) [T] The daily temperature in degrees Fahrenheit of Phoenix in the summer can be modeled by the function
46) [T] The depth (in feet) of water at a dock changes with the rise and fall of tides. The depth is modeled by the function
Solution:
3.7: Derivatives of Inverse Functions
Exercise:
For the following exercises, use the graph of
a. sketch the graph of
b. use part a. to estimate
1)
2)
Solution:
a.
b.
3)
4)
Solution:
a.
b.
For the following exercises, use the functions
a.
b. \(x=f^{−1}(y).
c. Then use part b. to find
5)
6)
Solution:
7)
8)
Solution:
For each of the following functions, find
9)
10
Solution:
11)
12)
Solution: \frac{1}{3}\)
13)
14)
Solution:
For each of the given functions
a. find the slope of the tangent line to its inverse function
b. find the equation of the tangent line to the graph of
15)
16)
Solution:
17)
18)
Solution:
19)
For the following exercises, find
20)
Solution:
21)
22)
Solution:
23)
24)
Solution:
25)
26)
Solution:
27)
28)
Solution:
29)
For the following exercises, use the given values to find
30)
Solution:
31)
32)
Solution:
33)
34)
Solution:
35)
36) [T] The position of a moving hockey puck after
a. Find the velocity of the hockey puck at any time
b. Find the acceleration of the puck at any time
c. Evaluate a. and b. for
d. What conclusion can be drawn from the results in c.?
Solution:
d. The hockey puck is decelerating/slowing down at 2, 4, and 6 seconds.
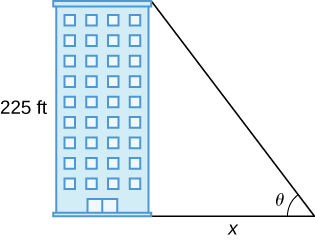
37) [T] A building that is 225 feet tall casts a shadow of various lengths
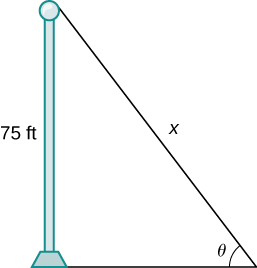
38) [T] A pole stands 75 feet tall. An angle
Solution:
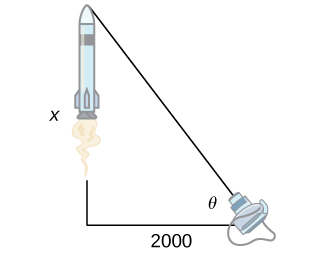
39) [T] A television camera at ground level is 2000 feet away from the launching pad of a space rocket that is set to take off vertically, as seen in the following figure. The angle of elevation of the camera can be found by
40) [T] A local movie theater with a 30-foot-high screen that is 10 feet above a person’s eye level when seated has a viewing angle
where
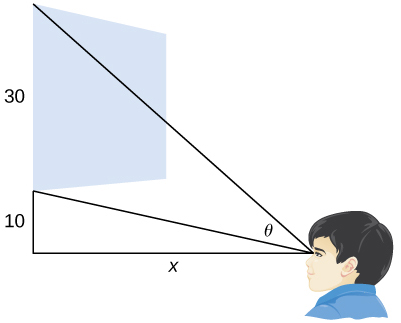
a. Find
b. Evaluate
c. Interpret the results in b..
d. Evaluate
e. Interpret the results in d. At what distance
Solution: a.
For the following exercises, use implicit differentiation to determine
J328)
J329)
- Answer:
J330)
3.8: Implicit Differentiation
For the following exercises, use implicit differentiation to find
1)
2)
Solution:
3)
4)
Solution:
5)
6)
7)
8)
Solution:
9)
10)
Solution:
For the following exercises, find the equation of the tangent line to the graph of the given equation at the indicated point. Use a calculator or computer software to graph the function and the tangent line.
11)
12)
Solution:
13)
14)
Solution:
15)
16)
Solution:
17) [T] The graph of a folium of Descartes with equation
a. Find the equation of the tangent line at the point
b. Find the equation of the normal line to the tangent line in a. at the point
18) For the equation
a. Find the equation of the normal to the tangent line at the point
b. At what other point does the normal line in a. intersect the graph of the equation?
Solution:
19) Find all points on the graph of
For the equation
a. Find the
b.Find the slope of the tangent line(s) at the x-intercept(s).
c. What does the value(s) in b. indicate about the tangent line(s)?
Solution:
19) Find the equation of the tangent line to the graph of the equation
20) Find the equation of the tangent line to the graph of the equation
Solution:
21) Find
22) [T] The number of cell phones produced when
a. Find
b. Interpret the result of a.
Solution:
23) [T] The number of cars produced when x dollars is spent on labor and y dollars is spent on capital invested by a manufacturer can be modeled by the equation
(Both
a. Find
b. Interpret the result of a.
24) The volume of a right circular cone of radius
Solution:
25) For the following exercises, consider a closed rectangular box with a square base with side
Find an equation for the surface area of the rectangular box,
26) If the surface area of the rectangular box is 78 square feet, find
Solution:
For the following exercises, use implicit differentiation to determine
27)
28)
Solution:
29)
3.9: Derivatives of Exponential and Logarithmic Functions
Exercise:
For the following exercises, find
1)
Solution:
2)
3)
Solution:
4)
5)
Solution:
6)
7)
Solution:
8)
9)
Solution:
10)
11)
Solution:
12)
13)
Solution:
14)
15)
Solution:
For the following exercises, use logarithmic differentiation to find
16)
17)
Solution:
18)
19)
Solution:
20)
21)
Solution:
22)
23)
Solution:
24) [T] Find an equation of the tangent line to the graph of
25) [T] Find the equation of the line that is normal to the graph of
Solution:
26) [T] Find the equation of the tangent line to the graph of
27) Consider the function
a. Determine the points on the graph where the tangent line is horizontal.
b. Determine the points on the graph where
Solution:
28) The formula
a. Complete the following table with the appropriate values.
| 0 | (i) |
| (ii) | |
| (iii) | |
| (vi) | |
| (v) | |
| (vi) | |
| (vii) | |
| (viii) | |
| (ix) |
b. Using only the values in the table, determine where the tangent line to the graph of (I(t)\) is horizontal.
29) [T] The population of Toledo, Ohio, in 2000 was approximately 500,000. Assume the population is increasing at a rate of 5% per year.
a. Write the exponential function that relates the total population as a function of
b. Use a. to determine the rate at which the population is increasing in
c. Use b. to determine the rate at which the population is increasing in 10 years
Solution:
30)[T] An isotope of the element erbium has a half-life of approximately 12 hours. Initially there are 9 grams of the isotope present.
a. Write the exponential function that relates the amount of substance remaining as a function of
b. Use a. to determine the rate at which the substance is decaying in
c. Use b. to determine the rate of decay at
31) [T] The number of cases of influenza in New York City from the beginning of 1960 to the beginning of 1961 is modeled by the function
where
a. Show work that evaluates
b. Show work that evaluates
a. At the beginning of 1960 there were 5.3 thousand cases of the disease in New York City. At the beginning of 1963 there were approximately 723 cases of the disease in the United States. b. At the beginning of 1960 the number of cases of the disease was decreasing at rate of
32) [T] The relative rate of change of a differentiable function
a. Find the relative rate of change formula for the generic Gompertz function.
b. Use a. to find the relative rate of change of a population in
c. Briefly interpret what the result of b. means.
33) For the following exercises, use the population of New York City from 1790 to 1860, given in the following table.
| Year since 1790 | Population |
| 0 | 33,131 |
| 10 | 60,515 |
| 20 | 96,373 |
| 30 | 123,706 |
| 40 | 202,300 |
| 50 | 312,710 |
| 60 | 515,547 |
| 70 | 813,669 |
New York City Population Over TimeSource: http://en.wikipedia.org/wiki/Largest..._United_States
_by_population_by_decade
34) [T] Using a computer program or a calculator, fit a growth curve to the data of the form
Solution:
35) [T] Using the exponential best fit for the data, write a table containing the derivatives evaluated at each year.
36) [T] Using the exponential best fit for the data, write a table containing the second derivatives evaluated at each year.
Solution:
| Year since 1790 | P" |
| 0 | 69.25 |
| 10 | 107.5 |
| 20 | 167.0 |
| 30 | 259.4 |
| 40 | 402.8 |
| 50 | 625.5 |
| 60 | 971.4 |
| 70 | 1508.5 |
37) [T] Using the tables of first and second derivatives and the best fit, answer the following questions:
a. Will the model be accurate in predicting the future population of New York City? Why or why not?
b. Estimate the population in 2010. Was the prediction correct from a.?