2.4.1: Rates of Change and Behavior of Graphs (Exercises)


- Last updated
- Nov 16, 2021
- Save as PDF

( \newcommand{\kernel}{\mathrm{null}\,}\)
For the following exercises, find the average rate of change of the functions from x=1 to x=2.
24. f(x)=4x−3
25. f(x)=10x2+x
26. f(x)=−2x2
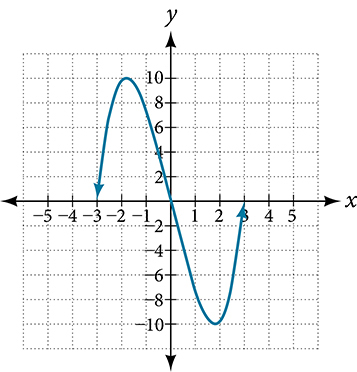
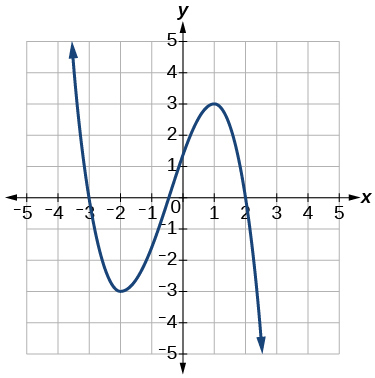
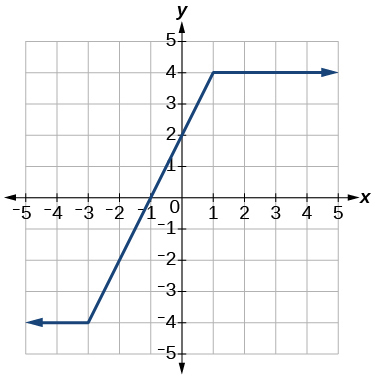
For the following exercises, use the graphs to determine the intervals on which the functions are increasing, decreasing, or constant.
27
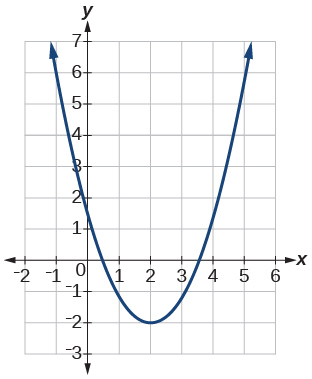
28.
29.
30. Find the local minimum of the function graphed in Exercise 3.27 .
31. Find the local extrema for the function graphed in Exercise 3.28 .
32. For the graph in Figure 2.4.1.3, the domain of the function is [-3,3] . The range is [-10,10] . Find the absolute minimum of the function on this interval.
33. Find the absolute maximum of the function graphed in Figure 2.4.1.3.