9.2: Graphing Trigonometric Functions


( \newcommand{\kernel}{\mathrm{null}\,}\)
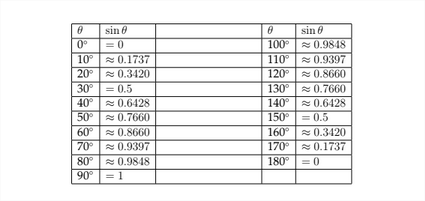
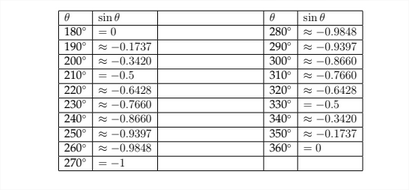
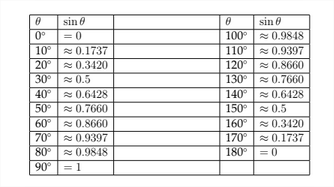
We have seen how to determine the values of trigonometric functions for angles terminating in Quadrants II, III, and IV. This allows us to make a graph of the values of the sine function for any angle. In the chart below, I have listed the values for the sine function for angles between 0∘ and 360∘.
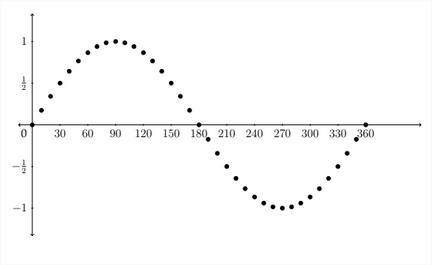
Below we see a graph of these points plotted on the coordinate axes.
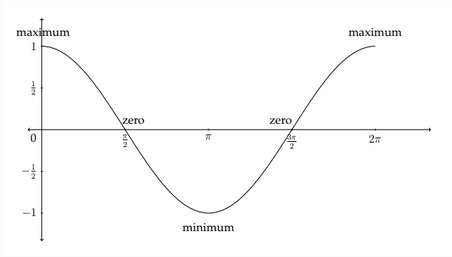
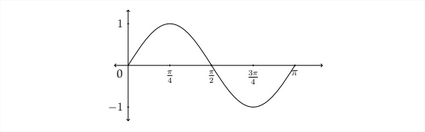
In graphing trigonometric functions, we typically use radian measure along the x -axis, so the graph would generally look like this:
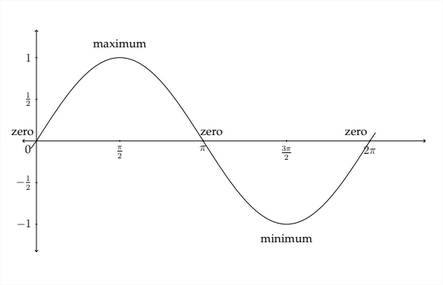
The graph of the standard sine function begins at the zero point, then rises to the maximum value of 1 between 0 and 73 radians. It then decreases back to 0 at
\pi radians before crossing over into the negative values and hitting its minimum value at 3π2 radians. It then goes back up to 0 at 2π radians before starting all over again.
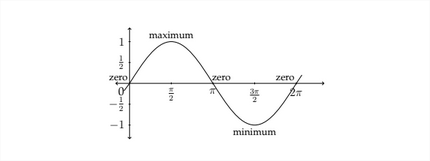
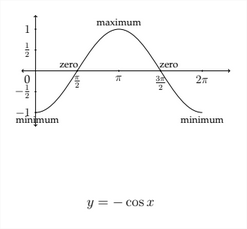
The standard cosine graph behaves in a similar but slightly different way. We saw earlier that cos0∘=1, so the cosine graph would start at the point (0,1), then gradually decrease to zero. A picture of the standard cosine graph would look like the figure below:
maximum
The sine and cosine graphs are sometimes referred to as a "sine wave" or "sinusoid" and can be very useful in modeling phenomena that occur in waves. Examples of this are the rise and fall of the tides; sound waves and music; electricity; and the length of day throughout the year. The standard sine and cosine graphs must be modified to fit a particular application so that they will effectively model the situation. The ideas that we examine next will explain how to modify the sine and cosine graphs to fit a variety of different situations.
There are four aspects to the sine and cosine functions to take into consideration when making a graph. These are:
1) The Amplitude of the graph
2) The Period of the graph
3) The Vertical Shift of the graph
4) The Phase Shift of the graph
Amplitude
The amplitude of a sine or cosine function refers to the maximum and minimum values of the function. In the standard sine and cosine graphs, the maximum value is 1 and the minimum value is −1. The amplitude is one-half the difference between the maximum and minimum values. In the standard graphs the difference between the maximum and minimum is 1−(−1)=2; one-half of this is 1 so the amplitude of the standard sine and cosine functions is 1.
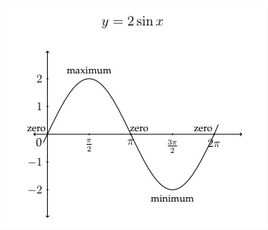
The value of the amplitude is also the absolute value of the coefficient of the sine or cosine expression. In the standard graph, y=sinx, the coefficient of the sine function is 1, so the amplitude is 1. In the function y=2sinx, all the y values will be multiplied by 2 and the amplitude of the function will be 2. The graph for y=2sinx is shown on the next page.
A negative value of the coefficient in front of a trigonometric function will not change the Amplitude of the function, but it will change the shape of the function. For example, the function:
has an amplitude of 1, but the graph will be different from the graph y=sinx All of the y -values of the function y=−sinx will have the opposite sign as the y -values of the function y=sinx. The graph for y=−sinx appears below:
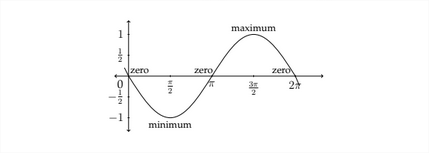
Notice that, because of the negation of the y -values, the graph begins at 0, as does the standard sine function, but the graph of y=−sinx first goes to a minimum value before crossing through 0 again up to the maximum value.
Likewise, the graph of y=−cosx begins at the minimum value before crossing through 0 and going to the maximum value, back through 0 and ending at the minimum value again.
Period
The period of the graph refers to how long it takes the graph to complete one full cycle of values. In the standard sine and cosine functions, the period is 2π radians. The function completes a single "wave" and returns to its starting place between 0 and 2π. A coefficient in front of the variable in a sine or cosine function will affect the period of the graph. In the general expression y=AsinBx, the value of A affects the amplitude of the function and the value of B affects the period of the function.
If we examine the table of values for the standard sine function, we can see how the coefficient of the x -variable will affect the period of the graph. Starting with the table from the standard sine function:
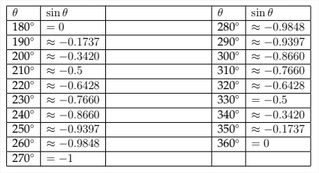
If we create a similar table for the function y=sin(2x), then we can see how this will affect the graph:
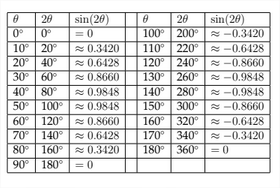
In the previous table we can see that the function y=sin(2x) completes one full cycle between 0 and π radians instead of the the standard 0 to 2π radians. The graph for these points is shown below. The coordinates for the x -values between
π and 2π radians are shown as well.
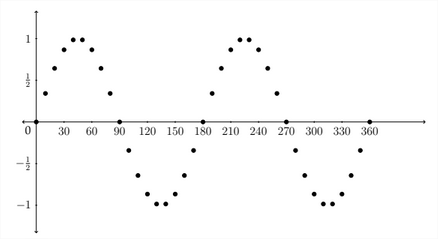
In this graph, you can see that there are two complete waves between 0 and 2π radians, or one complete wave between 0 and π radians. So, in a sine or cosine function of the form y=AsinBx, the amplitude will be |A| and the period will be 2πb. The standard graph for one complete cycle of the function y=sin(2x) is shown below:
Notice that, because the period has been cut in half, the x -coordinates that correspond to the maximum, minimum, and zero y -coondinates are cut in half as
Example 1
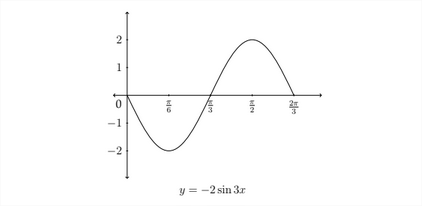
Graph one full period of the function y=−2sin3x
The amplitude in this case is 2, but since the coefficient is negative, this sine graph will begin by first going to the minimum value. The period of the graph will be 2πB, or in this case 2π3 instead of 2π. To determine the x -values for the maximum, minimum and zero y -values, we should examine how these are determined for the standard sine curve.
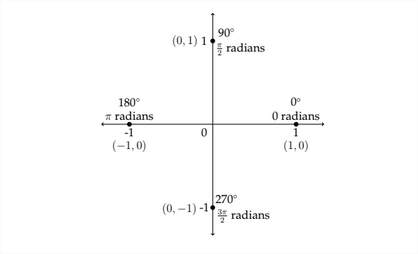
The maximum, minimum and zero y-values for a standard sine curve occur at the quadrantal angles, that is to say, the angles that separate the four quadrants from each other. The quadrantal angles are 0 ' or 0 radians, 90∘ or π2 radians, 180∘ or \pi radians, 270∘ or 3π2 radians and 360∘ or 2π radians. These x -values produce the "critical" y-values of the zero, maximum and minimum.
In the standard sine or cosine graph, the distance from each "critical value" of the
graph to the next is always a "jump" of π2 along the x -axis. This is one-fourth of the period: 2π1∗14=π2. So, to determine the labels for the critical values of the graph along the x -axis, we should take the new period and multiply by 14
The function we are working with is y=−2sin3x, so to find the new period we calculated 2πB, which was 2π3. Then, in order to label the x -axis properly we should next take 2π3 and multiply by 14
2π3∗14=2π12=π6
So, the critical values along the x -axis will be:
1π6,2π6,3π6, and 4π6
We want to express these in lowest terms, so we would label them as π6,π3,π2, and 2π3. The graph will start at zero, then (because the value of the coefficient A is negative) it will go down to a minimum value at π6, back to zero at π3, then up to the maximum at π2 and back down to zero at 2π3 to complete one full period of the graph. The graph for this function is pictured below. Notice that the minimum y-value is -2 and the maximum y -value is 2 because A=2
Let's look at an example using the cosine graph.
Example 2
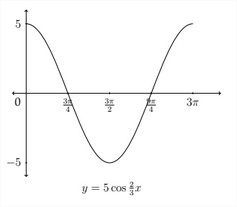
Graph one full period of the function y=5cos23x
The amplitude of the function is 5 because A=5, so the maximum y-value will be 5 and the minimum y -value will be −5. The period of the graph will be 2πB which in this case is 2π7=2π∗32=3π. So the period is 3 π. The critical values along the x -axis will start at 0 and be separated by "jumps" of 3π∗14=3π4. So the critical values along the x -axis will be:
0,3π4,6π4,9π4, and 12π4
We want to express these in lowest terms so we would label them as 3π4,3π2,9π4 and 3π. The graph will start at the maximum y -value of 5 at x=0, then it will go to zero at x=3π4, down to the minimum y -value of -5 at x=3π2, back through 0 at x=9π4, and then up to the maximum y -value of 5 at x=3π to complete one full period of the graph. The graph of y=5cos23x. is shown below.
Determining an equation from a graph
Sometimes, you will be given a graph and asked to determine an equation which satisfies the conditions visible in the graph. So far, we have only discussed two of the possible transformations of a trigonometric function - the amplitude and period. Remember that in an equation of the form y=AsinBx or y=AcosBx, the amplitude is |A| and the period is 2πB. So, to write an equation for a trigonometric function, we need to determine the values of A and B.
Example 3
Deterimine an equation that satisfies the given graph.
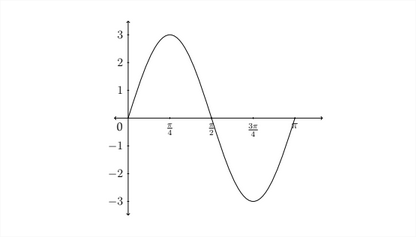
First note that the maximum y -value for the graph is 3 and the minimum is -3 This means that the amplitude is 3. Next we see that there is one complete period of the function between 0 and π, this means that the period is π. From this information, we know that A=3 and that the period for the graph is π. Since the period P=2πB, then we know that B=2πP. So, B=2ππ=2
Lastly, this graph starts with a y -value of 5, which is the maximum y -value. It then goes to 0 and down to the minimum, back through 0 and then back to the maximum to form one complete wave. since this is the signature of the cosine function, the answer to this problem would be:
y=5cos89x
Exercises 2.2
Determine the amplitude and the period for each problem and graph one period of the function. Identify important points on the x and y axes.
1. y=cos4x
2. y=−sin2x
3. y=3sin3x
4. y=−2cos5x
5. y=4cos12x
6. y=2sin13x
7. y=−12sin23x
8. y=−3cos15x
9. y=−4sin6x
10. y=3sin4x
11. y=2cos12x
12. y=3cos13x
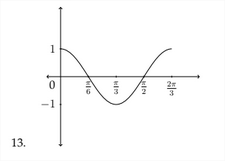
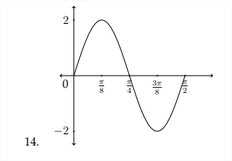
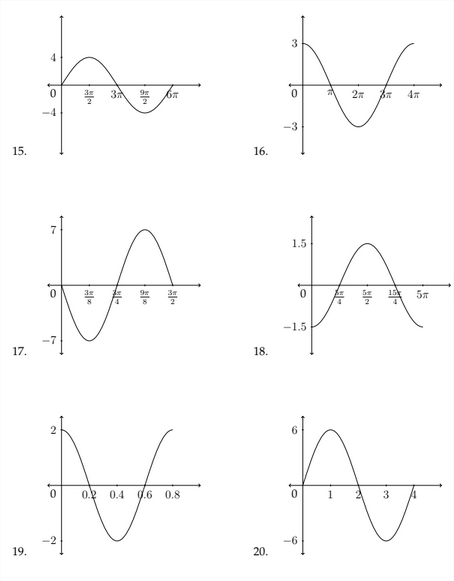
Determine an equation that satifies the given graph.