
2.4: Solution of Rational Inequalities by Graphing
- Page ID
- 40902

\( \newcommand{\vecs}[1]{\overset { \scriptstyle \rightharpoonup} {\mathbf{#1}} } \)
\( \newcommand{\vecd}[1]{\overset{-\!-\!\rightharpoonup}{\vphantom{a}\smash {#1}}} \)
\( \newcommand{\dsum}{\displaystyle\sum\limits} \)
\( \newcommand{\dint}{\displaystyle\int\limits} \)
\( \newcommand{\dlim}{\displaystyle\lim\limits} \)
\( \newcommand{\id}{\mathrm{id}}\) \( \newcommand{\Span}{\mathrm{span}}\)
( \newcommand{\kernel}{\mathrm{null}\,}\) \( \newcommand{\range}{\mathrm{range}\,}\)
\( \newcommand{\RealPart}{\mathrm{Re}}\) \( \newcommand{\ImaginaryPart}{\mathrm{Im}}\)
\( \newcommand{\Argument}{\mathrm{Arg}}\) \( \newcommand{\norm}[1]{\| #1 \|}\)
\( \newcommand{\inner}[2]{\langle #1, #2 \rangle}\)
\( \newcommand{\Span}{\mathrm{span}}\)
\( \newcommand{\id}{\mathrm{id}}\)
\( \newcommand{\Span}{\mathrm{span}}\)
\( \newcommand{\kernel}{\mathrm{null}\,}\)
\( \newcommand{\range}{\mathrm{range}\,}\)
\( \newcommand{\RealPart}{\mathrm{Re}}\)
\( \newcommand{\ImaginaryPart}{\mathrm{Im}}\)
\( \newcommand{\Argument}{\mathrm{Arg}}\)
\( \newcommand{\norm}[1]{\| #1 \|}\)
\( \newcommand{\inner}[2]{\langle #1, #2 \rangle}\)
\( \newcommand{\Span}{\mathrm{span}}\) \( \newcommand{\AA}{\unicode[.8,0]{x212B}}\)
\( \newcommand{\vectorA}[1]{\vec{#1}} % arrow\)
\( \newcommand{\vectorAt}[1]{\vec{\text{#1}}} % arrow\)
\( \newcommand{\vectorB}[1]{\overset { \scriptstyle \rightharpoonup} {\mathbf{#1}} } \)
\( \newcommand{\vectorC}[1]{\textbf{#1}} \)
\( \newcommand{\vectorD}[1]{\overrightarrow{#1}} \)
\( \newcommand{\vectorDt}[1]{\overrightarrow{\text{#1}}} \)
\( \newcommand{\vectE}[1]{\overset{-\!-\!\rightharpoonup}{\vphantom{a}\smash{\mathbf {#1}}}} \)
\( \newcommand{\vecs}[1]{\overset { \scriptstyle \rightharpoonup} {\mathbf{#1}} } \)
\(\newcommand{\longvect}{\overrightarrow}\)
\( \newcommand{\vecd}[1]{\overset{-\!-\!\rightharpoonup}{\vphantom{a}\smash {#1}}} \)
\(\newcommand{\avec}{\mathbf a}\) \(\newcommand{\bvec}{\mathbf b}\) \(\newcommand{\cvec}{\mathbf c}\) \(\newcommand{\dvec}{\mathbf d}\) \(\newcommand{\dtil}{\widetilde{\mathbf d}}\) \(\newcommand{\evec}{\mathbf e}\) \(\newcommand{\fvec}{\mathbf f}\) \(\newcommand{\nvec}{\mathbf n}\) \(\newcommand{\pvec}{\mathbf p}\) \(\newcommand{\qvec}{\mathbf q}\) \(\newcommand{\svec}{\mathbf s}\) \(\newcommand{\tvec}{\mathbf t}\) \(\newcommand{\uvec}{\mathbf u}\) \(\newcommand{\vvec}{\mathbf v}\) \(\newcommand{\wvec}{\mathbf w}\) \(\newcommand{\xvec}{\mathbf x}\) \(\newcommand{\yvec}{\mathbf y}\) \(\newcommand{\zvec}{\mathbf z}\) \(\newcommand{\rvec}{\mathbf r}\) \(\newcommand{\mvec}{\mathbf m}\) \(\newcommand{\zerovec}{\mathbf 0}\) \(\newcommand{\onevec}{\mathbf 1}\) \(\newcommand{\real}{\mathbb R}\) \(\newcommand{\twovec}[2]{\left[\begin{array}{r}#1 \\ #2 \end{array}\right]}\) \(\newcommand{\ctwovec}[2]{\left[\begin{array}{c}#1 \\ #2 \end{array}\right]}\) \(\newcommand{\threevec}[3]{\left[\begin{array}{r}#1 \\ #2 \\ #3 \end{array}\right]}\) \(\newcommand{\cthreevec}[3]{\left[\begin{array}{c}#1 \\ #2 \\ #3 \end{array}\right]}\) \(\newcommand{\fourvec}[4]{\left[\begin{array}{r}#1 \\ #2 \\ #3 \\ #4 \end{array}\right]}\) \(\newcommand{\cfourvec}[4]{\left[\begin{array}{c}#1 \\ #2 \\ #3 \\ #4 \end{array}\right]}\) \(\newcommand{\fivevec}[5]{\left[\begin{array}{r}#1 \\ #2 \\ #3 \\ #4 \\ #5 \\ \end{array}\right]}\) \(\newcommand{\cfivevec}[5]{\left[\begin{array}{c}#1 \\ #2 \\ #3 \\ #4 \\ #5 \\ \end{array}\right]}\) \(\newcommand{\mattwo}[4]{\left[\begin{array}{rr}#1 \amp #2 \\ #3 \amp #4 \\ \end{array}\right]}\) \(\newcommand{\laspan}[1]{\text{Span}\{#1\}}\) \(\newcommand{\bcal}{\cal B}\) \(\newcommand{\ccal}{\cal C}\) \(\newcommand{\scal}{\cal S}\) \(\newcommand{\wcal}{\cal W}\) \(\newcommand{\ecal}{\cal E}\) \(\newcommand{\coords}[2]{\left\{#1\right\}_{#2}}\) \(\newcommand{\gray}[1]{\color{gray}{#1}}\) \(\newcommand{\lgray}[1]{\color{lightgray}{#1}}\) \(\newcommand{\rank}{\operatorname{rank}}\) \(\newcommand{\row}{\text{Row}}\) \(\newcommand{\col}{\text{Col}}\) \(\renewcommand{\row}{\text{Row}}\) \(\newcommand{\nul}{\text{Nul}}\) \(\newcommand{\var}{\text{Var}}\) \(\newcommand{\corr}{\text{corr}}\) \(\newcommand{\len}[1]{\left|#1\right|}\) \(\newcommand{\bbar}{\overline{\bvec}}\) \(\newcommand{\bhat}{\widehat{\bvec}}\) \(\newcommand{\bperp}{\bvec^\perp}\) \(\newcommand{\xhat}{\widehat{\xvec}}\) \(\newcommand{\vhat}{\widehat{\vvec}}\) \(\newcommand{\uhat}{\widehat{\uvec}}\) \(\newcommand{\what}{\widehat{\wvec}}\) \(\newcommand{\Sighat}{\widehat{\Sigma}}\) \(\newcommand{\lt}{<}\) \(\newcommand{\gt}{>}\) \(\newcommand{\amp}{&}\) \(\definecolor{fillinmathshade}{gray}{0.9}\)In the previous section, we saw how to solve polynomial inequalities by graphing. In this section, we will use similar methods to solve rational inequalities. Rational inequalities involve ratios of polynomials or fractions. Because these types of problems involve fractions, the graphs of the functions that we work with will have what are known as asymptotes. This word comes from a Greek root having to do with two lines that come very close to each other but never meet.
The vertical asymptotes of a graph will appear at places where the original expression has a zero denominator. This means that the function is not defined at those \(x\) values and so, rather than having a \(y\) value at that point, the graph has an asymptote.
Example
Below is a graph of the function \(y=\frac{x+2}{x-1}\)
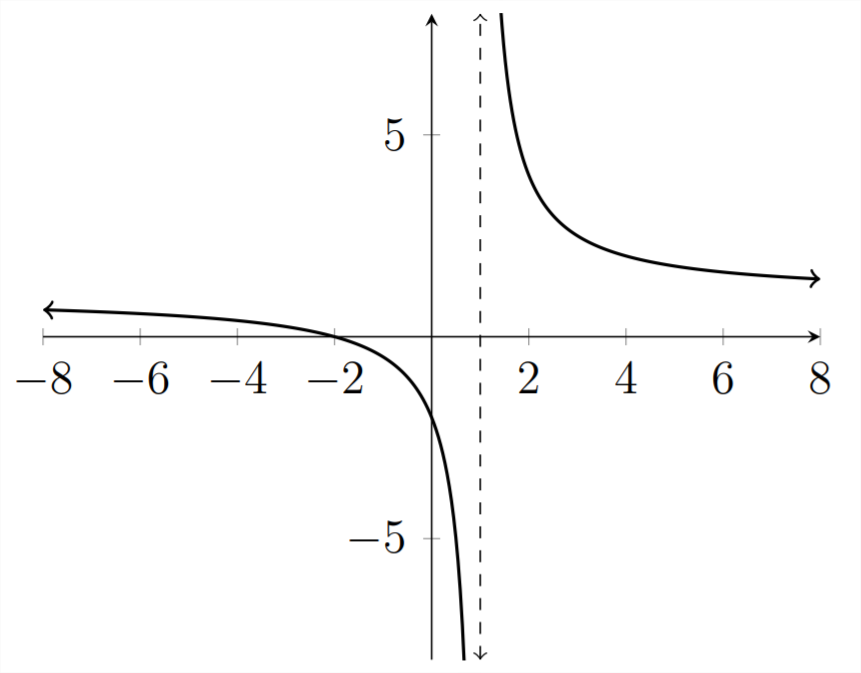
Rather than having a \(y\) value at the point where \(x=1\), the dotted line indicates the asymptote where the function is not defined. In the previous section, we were interested in finding the roots of the function because these are the places where \(y=0,\) and can be the dividing points between where the \(y\) values are greater than zero \((y>0)\) and the where the \(y\) values are less than zero \((y<0)\)
The importance of the asymptotes in analyzing rational functions is that, like the roots, these represent \(x\) values that can be the dividing points between where \(y>0\) and where \(y<0\)
Example
Solve the given inequality.
\(\frac{2}{x-3}>0\)
First we examine the graph:
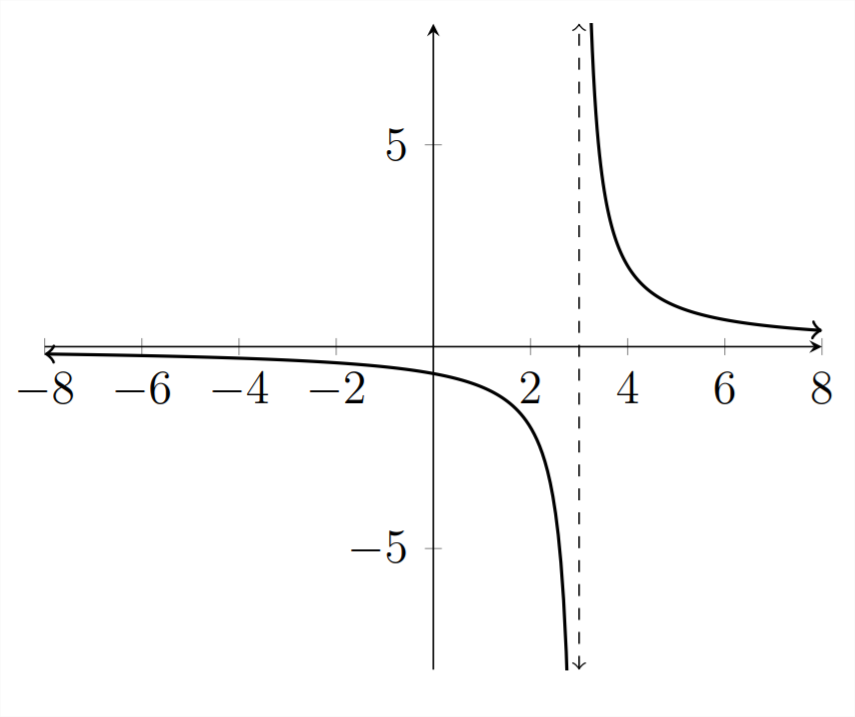
Notice that the asymptote for this graph occurs at the value \(x=3,\) because this is the \(x\) value that creates a zero denominator. Also notice that the \(y\) values switch from being negative to being positive across the asymptote.
There are no roots for this function because there are no \(x\) values that make \(y=0\) For a fraction to be zero, the numerator must equal zero. In this example the numerator is 2 and no value of \(x\) will make it equal zero. Therefore the only possible dividing point on the graph is \(x=3,\) and the solution to the inequality is \(x>3\)
Example
Solve the given inequality.
\(\frac{x-2}{x-3}>0\)
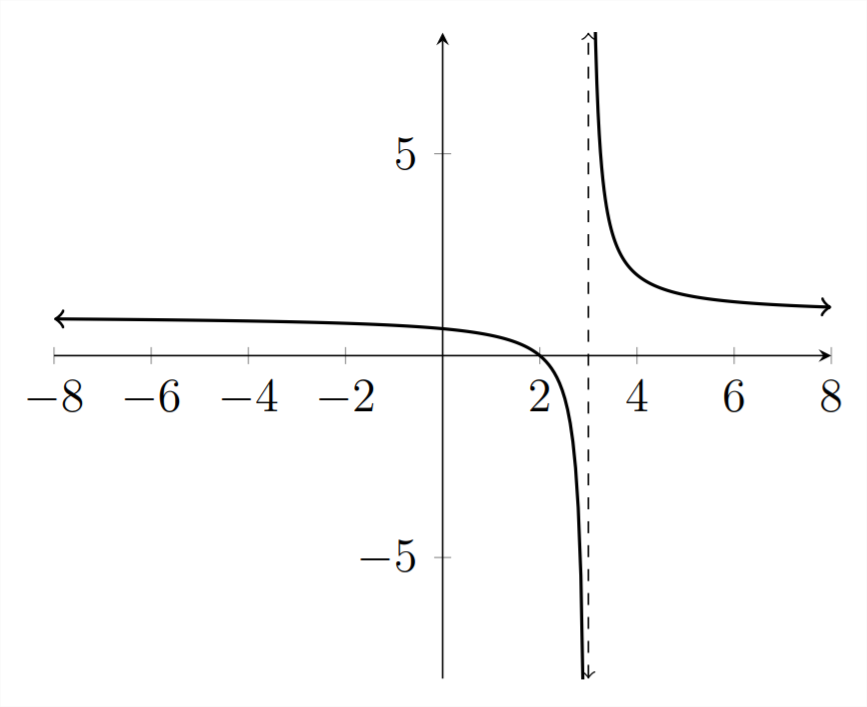
In this inequality, there is again an asymptote at \(x=3,\) but there is also a root at the value \(x=2,\) because when \(x=2 . y=\frac{2-2}{2-3}=\frac{0}{-1}=0 .\) So we have two dividing points to consider, \(x=2\) and \(x=3 .\) We can see from the graph that \(y>0\) for \(x<2\) or \(x>3,\) so that is the solution to the given inequality.
Example
Solve the given inequality.
\(\frac{x^{2}-2}{x-3}>0\)
In this problem, we have the same asymptote as the previous two problems: \(x=\)
3. However, in this inequality, there are two roots, because there are two \(x\) values that make the numerator equal zero.
\(x^{2}-2=0\) means that \(x^{2}=2\) and \(x=\pm \sqrt{2} \approx \pm 1.414\)
We can see these roots on the graph.
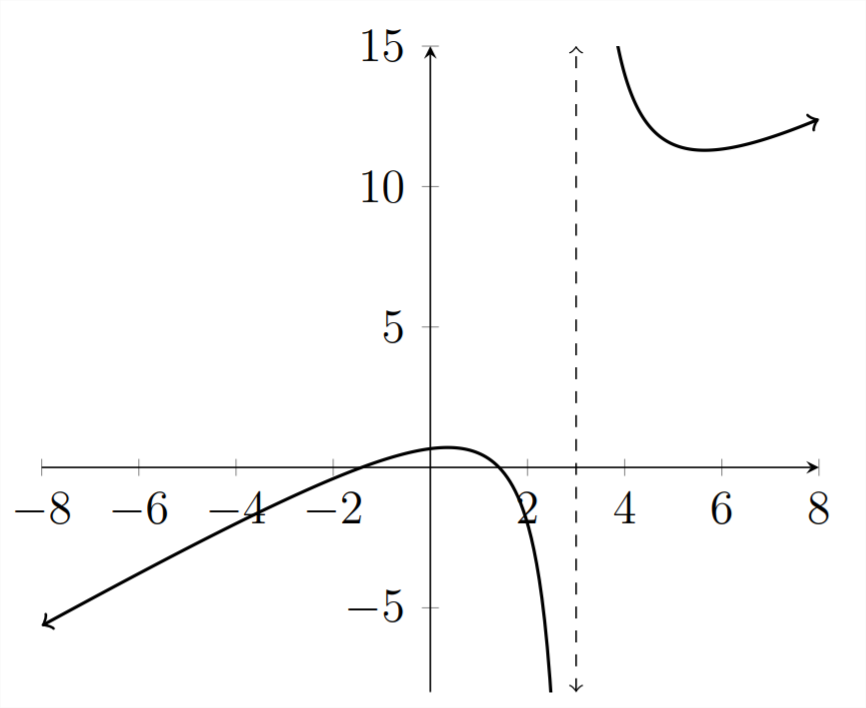
In the graph above, we can see the asymptote at \(x=3\) and the two roots at \(x \approx 1.414,-1.414\)
The \(x\) values that make \(y>0\) are \(-1.414<x<1.414\) OR \(x>3\)
Example
Solve the given inequality.
\(\frac{x-2}{x^{2}-3}>0\)
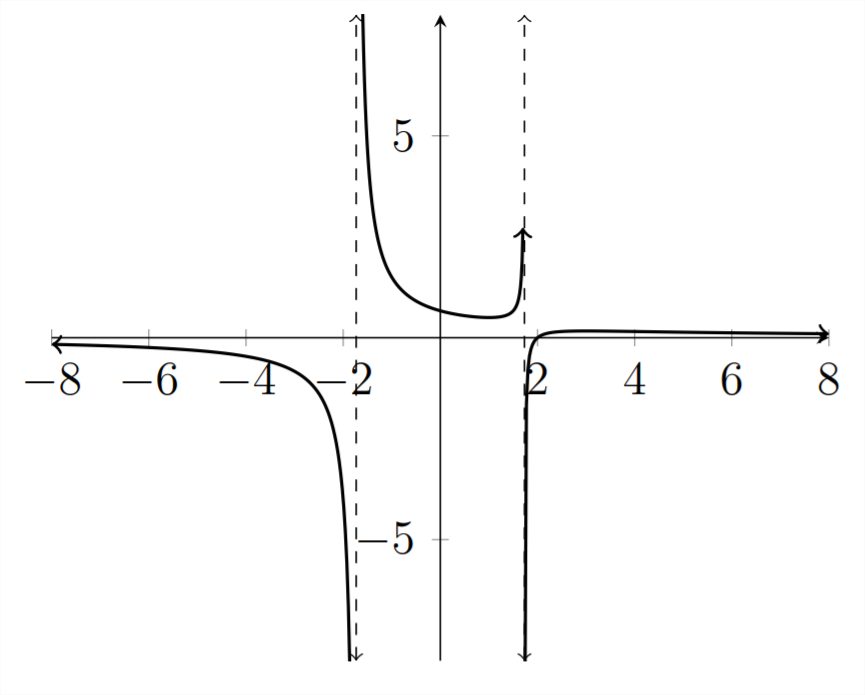
The roots for this function are the \(x\) values that make the numerator equal zero:
\(x-2=0,\) therefore \(x=2,\) and we can see this root on the graph.
The asymptotes for the function are the \(x\) values that make the denominator equal
zero:
\(x^{2}-3=0\) means that \(x^{2}=3\) and \(x=\pm \sqrt{3} \approx \pm 1.732\)
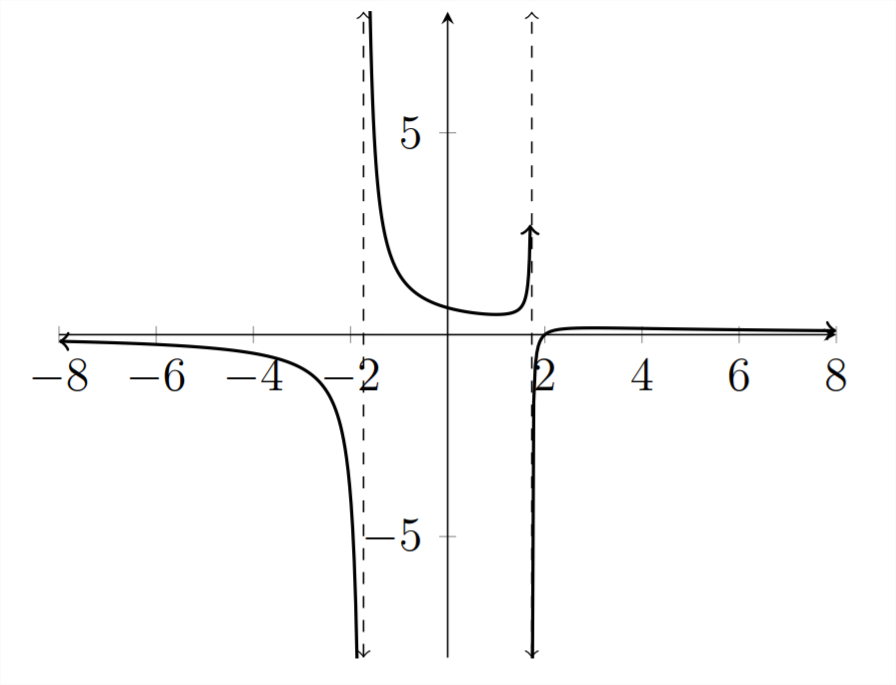
Therefore the solution for the given inequality is:
\(-1.732<x<1.732\) OR \(x>2\)
Example
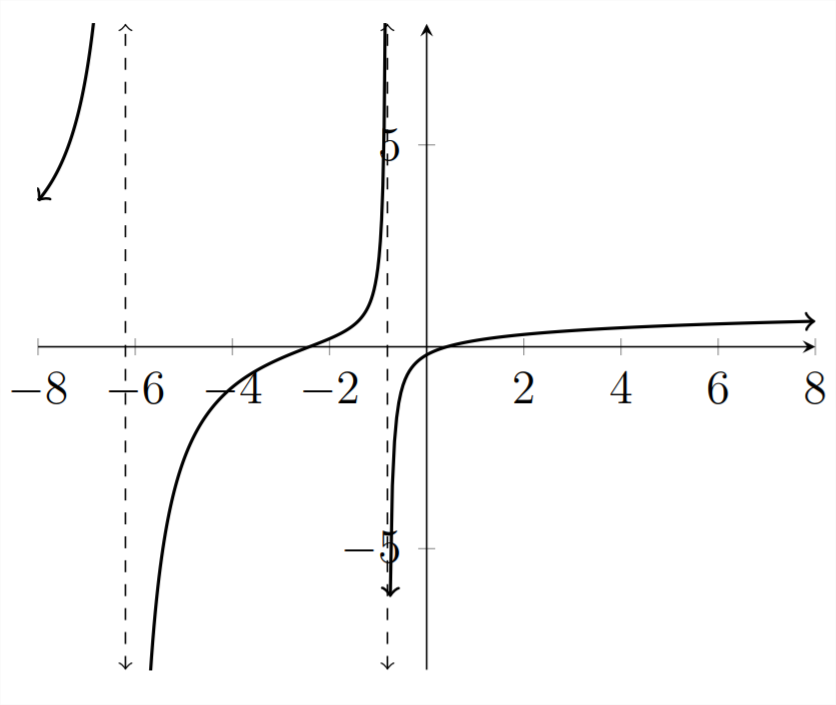
Solve the given inequality
\(\frac{5 x+1}{x^{2}+3 x-4}<0\)
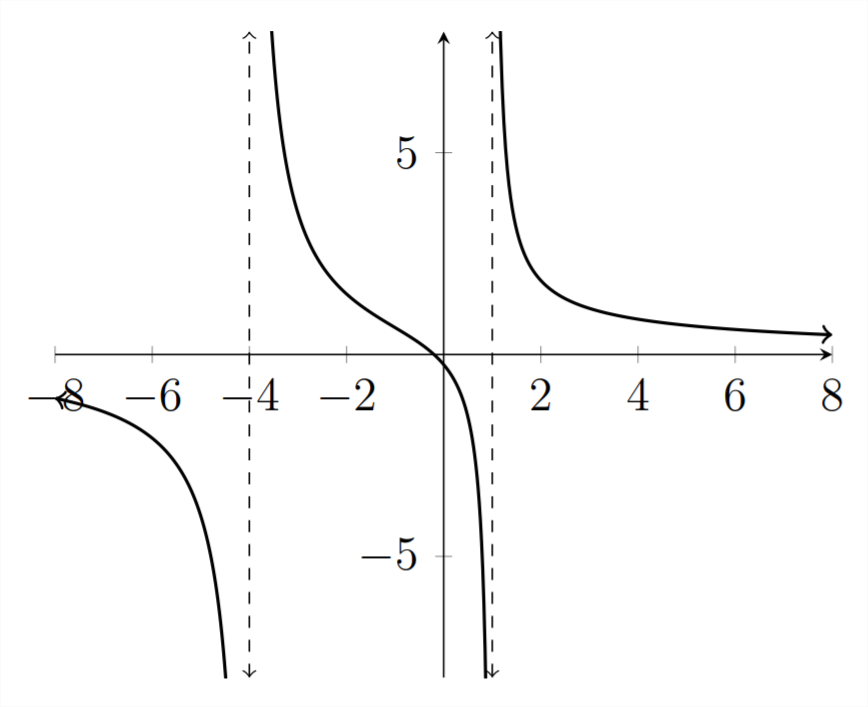
Roots
\(5 x+1=0\)
\(5 x=-1\)
\(x=-0.2=-\frac{1}{5}\)
Asymptotes
\(x^{2}+3 x-4=0\)
\((x+4)(x-1)=0\)
\(x=-4,1\)
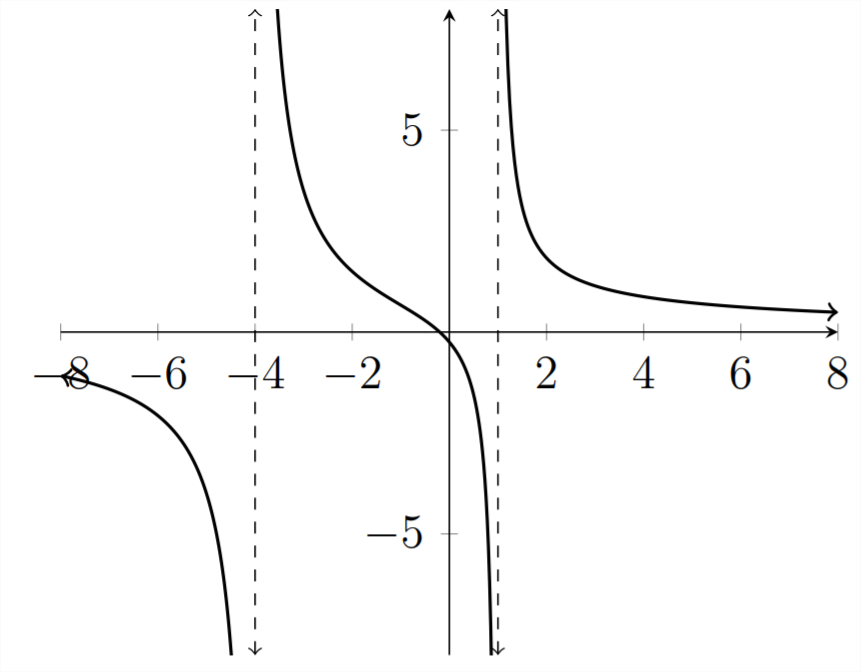
If we combine the algebraic analysis above with what we see in the graph, then we know that the dividing points important to the solution of this inequality are at \(x=-4,-0.2,1 .\) The intervals where the \(y\) values are less than zero are \(x<-4\) \(\mathrm{OR}-0.2<x<1\)
Example
\(\frac{x^{2}+2 x-1}{x^{2}+7 x+5} \leq 0\)
Roots
\[
\begin{array}{l}
x^{2}+2 x-1=0 \\
x \approx-2.414,0.414
\end{array}
\]
Asymptotes
\(x^{2}+7 x+5=0\)
\[
x \approx-6.193,-0.807
\]
We can see that the dividing points important to the solution of the inequality are \(x \approx-6.193,-2.414,-0.807,0.414 .\) The intervals where the \(y\) values are less than or equal to zero are \(-6.193 \leq x \leq-2.414\) OR \(-0.807 \leq x \leq 0.414\)
Exercises 2.4
Solve each inequality.
1) \(\quad \frac{x+4}{x^{2}-8 x+12}>0\)
2) \(\quad \frac{2 x+3}{x^{2}-2 x-35}<0\)
3) \(\quad \frac{x^{2}-5 x-14}{x^{2}+3 x-10}<0\)
4) \(\quad \frac{2 x^{2}-x-3}{x^{2}+10 x+16}>0\)
5) \(\quad \frac{3 x+2}{x^{2}+x-5}<0\)
6) \(\quad \frac{x^{2}+2 x+5}{x^{2}-3 x-7}>0\)
7) \(\quad \frac{x^{3}+9}{x^{2}+x-1}>0\)
8) \(\quad \frac{x^{3}+9}{x^{2}+x+1}>0\)
Solve each inequality.
9) \(\quad \frac{x^{2}-2 x-9}{3 x+11}>0\)
10) \(\quad \frac{x^{2}+4 x+3}{2 x+1}<0\)
11) \(\quad \frac{x^{2}+x-5}{x^{2}-x-6}>0\)
12) \(\quad \frac{x^{3}+2}{x^{2}-2}>0\)
13) \(\quad \frac{x^{2}+2 x-7}{x^{2}+3 x-6}<0\)
14) \(\quad \frac{2 x-x^{2}}{x^{2}-4 x+6}<0\)
15) \(\quad \frac{x^{2}-7}{x^{2}+5 x-1}<0\)
16) \(\quad \frac{x-5}{3 x^{2}-2 x-3}>0\)