
3.E: Introduction to Graphing (Exercises)
- Page ID
- 20023

\( \newcommand{\vecs}[1]{\overset { \scriptstyle \rightharpoonup} {\mathbf{#1}} } \)
\( \newcommand{\vecd}[1]{\overset{-\!-\!\rightharpoonup}{\vphantom{a}\smash {#1}}} \)
\( \newcommand{\dsum}{\displaystyle\sum\limits} \)
\( \newcommand{\dint}{\displaystyle\int\limits} \)
\( \newcommand{\dlim}{\displaystyle\lim\limits} \)
\( \newcommand{\id}{\mathrm{id}}\) \( \newcommand{\Span}{\mathrm{span}}\)
( \newcommand{\kernel}{\mathrm{null}\,}\) \( \newcommand{\range}{\mathrm{range}\,}\)
\( \newcommand{\RealPart}{\mathrm{Re}}\) \( \newcommand{\ImaginaryPart}{\mathrm{Im}}\)
\( \newcommand{\Argument}{\mathrm{Arg}}\) \( \newcommand{\norm}[1]{\| #1 \|}\)
\( \newcommand{\inner}[2]{\langle #1, #2 \rangle}\)
\( \newcommand{\Span}{\mathrm{span}}\)
\( \newcommand{\id}{\mathrm{id}}\)
\( \newcommand{\Span}{\mathrm{span}}\)
\( \newcommand{\kernel}{\mathrm{null}\,}\)
\( \newcommand{\range}{\mathrm{range}\,}\)
\( \newcommand{\RealPart}{\mathrm{Re}}\)
\( \newcommand{\ImaginaryPart}{\mathrm{Im}}\)
\( \newcommand{\Argument}{\mathrm{Arg}}\)
\( \newcommand{\norm}[1]{\| #1 \|}\)
\( \newcommand{\inner}[2]{\langle #1, #2 \rangle}\)
\( \newcommand{\Span}{\mathrm{span}}\) \( \newcommand{\AA}{\unicode[.8,0]{x212B}}\)
\( \newcommand{\vectorA}[1]{\vec{#1}} % arrow\)
\( \newcommand{\vectorAt}[1]{\vec{\text{#1}}} % arrow\)
\( \newcommand{\vectorB}[1]{\overset { \scriptstyle \rightharpoonup} {\mathbf{#1}} } \)
\( \newcommand{\vectorC}[1]{\textbf{#1}} \)
\( \newcommand{\vectorD}[1]{\overrightarrow{#1}} \)
\( \newcommand{\vectorDt}[1]{\overrightarrow{\text{#1}}} \)
\( \newcommand{\vectE}[1]{\overset{-\!-\!\rightharpoonup}{\vphantom{a}\smash{\mathbf {#1}}}} \)
\( \newcommand{\vecs}[1]{\overset { \scriptstyle \rightharpoonup} {\mathbf{#1}} } \)
\(\newcommand{\longvect}{\overrightarrow}\)
\( \newcommand{\vecd}[1]{\overset{-\!-\!\rightharpoonup}{\vphantom{a}\smash {#1}}} \)
\(\newcommand{\avec}{\mathbf a}\) \(\newcommand{\bvec}{\mathbf b}\) \(\newcommand{\cvec}{\mathbf c}\) \(\newcommand{\dvec}{\mathbf d}\) \(\newcommand{\dtil}{\widetilde{\mathbf d}}\) \(\newcommand{\evec}{\mathbf e}\) \(\newcommand{\fvec}{\mathbf f}\) \(\newcommand{\nvec}{\mathbf n}\) \(\newcommand{\pvec}{\mathbf p}\) \(\newcommand{\qvec}{\mathbf q}\) \(\newcommand{\svec}{\mathbf s}\) \(\newcommand{\tvec}{\mathbf t}\) \(\newcommand{\uvec}{\mathbf u}\) \(\newcommand{\vvec}{\mathbf v}\) \(\newcommand{\wvec}{\mathbf w}\) \(\newcommand{\xvec}{\mathbf x}\) \(\newcommand{\yvec}{\mathbf y}\) \(\newcommand{\zvec}{\mathbf z}\) \(\newcommand{\rvec}{\mathbf r}\) \(\newcommand{\mvec}{\mathbf m}\) \(\newcommand{\zerovec}{\mathbf 0}\) \(\newcommand{\onevec}{\mathbf 1}\) \(\newcommand{\real}{\mathbb R}\) \(\newcommand{\twovec}[2]{\left[\begin{array}{r}#1 \\ #2 \end{array}\right]}\) \(\newcommand{\ctwovec}[2]{\left[\begin{array}{c}#1 \\ #2 \end{array}\right]}\) \(\newcommand{\threevec}[3]{\left[\begin{array}{r}#1 \\ #2 \\ #3 \end{array}\right]}\) \(\newcommand{\cthreevec}[3]{\left[\begin{array}{c}#1 \\ #2 \\ #3 \end{array}\right]}\) \(\newcommand{\fourvec}[4]{\left[\begin{array}{r}#1 \\ #2 \\ #3 \\ #4 \end{array}\right]}\) \(\newcommand{\cfourvec}[4]{\left[\begin{array}{c}#1 \\ #2 \\ #3 \\ #4 \end{array}\right]}\) \(\newcommand{\fivevec}[5]{\left[\begin{array}{r}#1 \\ #2 \\ #3 \\ #4 \\ #5 \\ \end{array}\right]}\) \(\newcommand{\cfivevec}[5]{\left[\begin{array}{c}#1 \\ #2 \\ #3 \\ #4 \\ #5 \\ \end{array}\right]}\) \(\newcommand{\mattwo}[4]{\left[\begin{array}{rr}#1 \amp #2 \\ #3 \amp #4 \\ \end{array}\right]}\) \(\newcommand{\laspan}[1]{\text{Span}\{#1\}}\) \(\newcommand{\bcal}{\cal B}\) \(\newcommand{\ccal}{\cal C}\) \(\newcommand{\scal}{\cal S}\) \(\newcommand{\wcal}{\cal W}\) \(\newcommand{\ecal}{\cal E}\) \(\newcommand{\coords}[2]{\left\{#1\right\}_{#2}}\) \(\newcommand{\gray}[1]{\color{gray}{#1}}\) \(\newcommand{\lgray}[1]{\color{lightgray}{#1}}\) \(\newcommand{\rank}{\operatorname{rank}}\) \(\newcommand{\row}{\text{Row}}\) \(\newcommand{\col}{\text{Col}}\) \(\renewcommand{\row}{\text{Row}}\) \(\newcommand{\nul}{\text{Nul}}\) \(\newcommand{\var}{\text{Var}}\) \(\newcommand{\corr}{\text{corr}}\) \(\newcommand{\len}[1]{\left|#1\right|}\) \(\newcommand{\bbar}{\overline{\bvec}}\) \(\newcommand{\bhat}{\widehat{\bvec}}\) \(\newcommand{\bperp}{\bvec^\perp}\) \(\newcommand{\xhat}{\widehat{\xvec}}\) \(\newcommand{\vhat}{\widehat{\vvec}}\) \(\newcommand{\uhat}{\widehat{\uvec}}\) \(\newcommand{\what}{\widehat{\wvec}}\) \(\newcommand{\Sighat}{\widehat{\Sigma}}\) \(\newcommand{\lt}{<}\) \(\newcommand{\gt}{>}\) \(\newcommand{\amp}{&}\) \(\definecolor{fillinmathshade}{gray}{0.9}\)3.1: Graphing Equations by Hand
In Exercises 1-6, set up a Cartesian Coordinate system on a sheet of graph paper, then plot the given points.
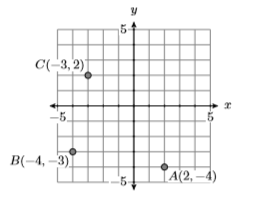
1) \(A(2,-4), B(-4,-3),\) and \(C(-3,2)\)
- Answer
-
2) \(A(3,-4), B(-3,-2),\) and \(C(-4,4)\)
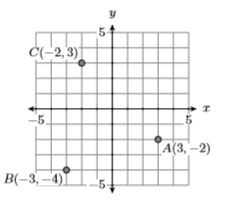
3) \(A(3,-2), B(-3,-4),\) and \(C(-2,3)\)
- Answer
-
4) \(A(3,-4), B(-3,-4),\) and \(C(-4,2)\)
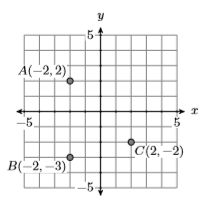
5) \(A(-2,2), B(-2,-3),\) and \(C(2,-2)\)
- Answer
-
6) \(A(-3,2), B(2,-4),\) and \(C(-3,-4)\)
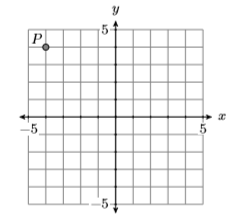
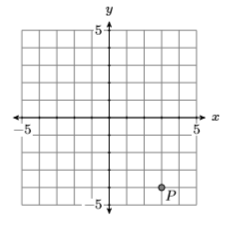
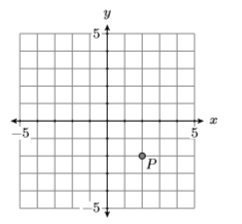
In Exercises 7-10, identify the coordinates of point \(P\) in each of the given coordinate systems.
7)
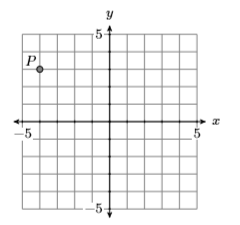
- Answer
-
\((-4,3)\)
8)
9)
- Answer
-
\((3,-4)\)
10)
11) Which of the points \((8,36)\), \((5,20)\), \((4,13)\), and \((−2,−12)\) is a solution of the equation \(y =5x−5\)?
- Answer
-
\((5,20)\)
12) Which of the points \((0,−9)\), \((6,−46)\), \((1,−14)\), and \((−6,36)\) is a solution of the equation \(y =−7x−7\)?
13) Which of the points \((−9,49)\), \((1,1)\), \((−6,39)\), and \((2,−3)\) is a solution of the equation \(y =−5x + 6\)?
- Answer
-
\((1,1)\)
14) Which of the points \((7,−15)\), \((−9,30)\), \((−6,19)\), and \((5,−11)\) is a solution of the equation \(y =−3x + 3\)?
15) Which of the points \((1,12)\), \((7,395)\), \((−7,398)\), and \((0,1)\) is a solution of the equation \(y =8x^2 + 3\)?
- Answer
-
\((7,395)\)
16) Which of the points \((−7,154)\), \((7,153)\), \((−2,21)\), and \((2,16)\) is a solution of the equation \(y =3x^2 + 6\)?
17) Which of the points \((8,400)\), \((5,158)\), \((0,3)\), and \((2,29)\) is a solution of the equation \(y =6x^2 +2x\)?
- Answer
-
\((8,400)\)
18) Which of the points \((−6,−114)\), \((6,−29)\), \((−7,−149)\), and \((4,−1)\) is a solution of the equation \(y = −2x^2 +7x\)?
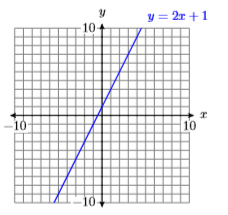
In Exercises 19-26, complete the table of points that satisfy the given equation. Set up a coordinate system on a sheet of graph paper, plot the points from the completed table, then draw the graph of the given equation.
19)
| \(x\) | \(y=2x+1\) | \((x,y)\) |
|---|---|---|
| -3 | ||
| -2 | ||
| -1 | ||
| 0 | ||
| 1 | ||
| 2 | ||
| 3 |
- Answer
-
20)
| \(x\) | \(y=x-4\) | \((x,y)\) |
|---|---|---|
| -3 | ||
| -2 | ||
| -1 | ||
| 0 | ||
| 1 | ||
| 2 | ||
| 3 |
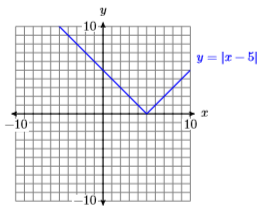
21)
| \(x\) | \(y=|x-5|\) | \((x,y)\) |
|---|---|---|
| 2 | ||
| 3 | ||
| 4 | ||
| 5 | ||
| 6 | ||
| 7 | ||
| 8 |
- Answer
-
22)
| \(x\) | \(y=|x+2|\) | \((x,y)\) |
|---|---|---|
| -5 | ||
| -4 | ||
| -3 | ||
| -2 | ||
| -1 | ||
| 0 | ||
| 1 |
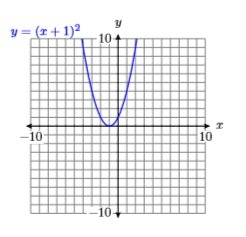
23)
| \(x\) | \(y=(x+1)^2\) | \((x,y)\) |
|---|---|---|
| -4 | ||
| -3 | ||
| -2 | ||
| -1 | ||
| 0 | ||
| 1 | ||
| 2 |
- Answer
-
24)
| \(x\) | \(y=(x+5)^2\) | \((x,y)\) |
|---|---|---|
| -8 | ||
| -7 | ||
| -6 | ||
| -5 | ||
| -4 | ||
| -3 | ||
| -2 |
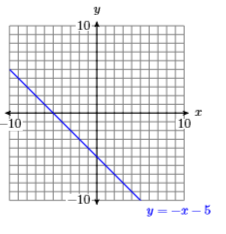
25)
| \(x\) | \(y=-x-5\) | \((x,y)\) |
|---|---|---|
| -3 | ||
| -2 | ||
| -1 | ||
| 0 | ||
| 1 | ||
| 2 | ||
| 3 |
- Answer
-
26)
| \(x\) | \(y=-2x+3\) | \((x,y)\) |
|---|---|---|
| -3 | ||
| -2 | ||
| -1 | ||
| 0 | ||
| 1 | ||
| 2 | ||
| 3 |
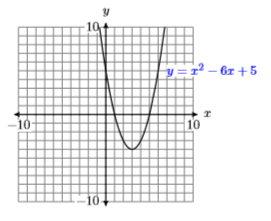
27) Use a graphing calculator to complete a table of points satisfying the equation \(y = x^2 − 6x + 5\). Use integer values of \(x\), starting at \(0\) and ending at \(6\). After completing the table, set up a coordinate system on a sheet of graph paper. Label and scale each axis, then plot the points in your table. Finally, use the plotted points as evidence to draw the graph of \(y = x^2 −6x + 5\).
- Answer
-
28) Use a graphing calculator to complete a table of points satisfying the equation \(y = x^2 − 2x − 3\). Use integer values of \(x\), starting at \(−2 \)and ending at \(4\). After completing the table, set up a coordinate system on a sheet of graph paper. Label and scale each axis, then plot the points in your table. Finally, use the plotted points as evidence to draw the graph of \(y = x^2 −2x−3\).
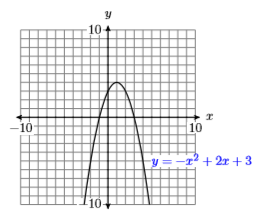
29) Use a graphing calculator to complete a table of points satisfying the equation \(y = −x^2 +2x + 3\). Use integer values of \(x\), starting at \(−2\) and ending at \(4\). After completing the table, set up a coordinate system on a sheet of graph paper. Label and scale each axis, then plot the points in your table. Finally, use the plotted points as evidence to draw the graph of \(y = −x^2 +2x + 3\).
- Answer
-
30) Use a graphing calculator to complete a table of points satisfying the equation \(y = −x^2 −2x + 8\). Use integer values of \(x\), starting at \(−5\) and ending at \(3\). After completing the table, set up a coordinate system on a sheet of graph paper. Label and scale each axis, then plot the points in your table. Finally, use the plotted points as evidence to draw the graph of \(y = −x^2 −2x + 8\).
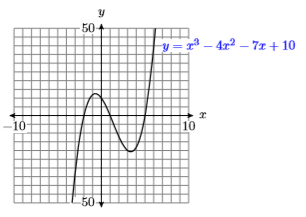
31) Use a graphing calculator to complete a table of points satisfying the equation \(y = x^3 −4x^2 −7x + 10\). Use integer values of \(x\), starting at \(−3\) and ending at \(6\). After completing the table, set up a coordinate system on a sheet of graph paper. Label and scale each axis, then plot the points in your table. Finally, use the plotted points as evidence to draw the graph of \(y = x^3 −4x^2 −7x + 10\).
- Answer
-
32) Use a graphing calculator to complete a table of points satisfying the equation \(y = x^3 +3x^2 −13x−15\). Use integer values of \(x\), starting at \(−6\) and ending at \(4\). After completing the table, set up a coordinate system on a sheet of graph paper. Label and scale each axis, then plot the points in your table. Finally, use the plotted points as evidence to draw the graph of \(y = x^3 +3x^2 −13x−15\).
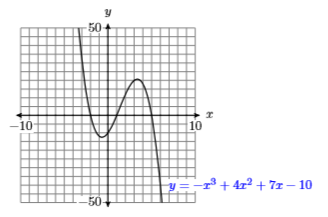
33) Use a graphing calculator to complete a table of points satisfying the equation \(y = −x^3 +4x^2 +7x−10\). Use integer values of \(x\), starting at \(−3\) and ending at \(6\). After completing the table, set up a coordinate system on a sheet of graph paper. Label and scale each axis, then plot the points in your table. Finally, use the plotted points as evidence to draw the graph of \(y = −x^3 +4x^2 +7x−10\).
- Answer
-
34) Use a graphing calculator to complete a table of points satisfying the equation \(y = −x^3 + x^2 + 12x\). Use integer values of \(x\), starting at \(−4\) and ending at \(5\). After completing the table, set up a coordinate system on a sheet of graph paper. Label and scale each axis, then plot the points in your table. Finally, use the plotted points as evidence to draw the graph of \(y =−x^3 + x^2 + 12x\).
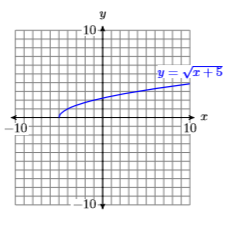
35) Use a graphing calculator to complete a table of points satisfying the equation \(y=\sqrt{x+5}\). Use integer values of \(x\), starting at \(−5\) and ending at \(10\). Round your \(y\)-values to the nearest tenth. After completing the table, set up a coordinate system on a sheet of graph paper. Label and scale each axis, then plot the points in your table. Finally, use the plotted points as evidence to draw the graph of \(y=\sqrt{x+5}\).
- Answer
-
36) Use a graphing calculator to complete a table of points satisfying the equation \(y=\sqrt{4-x}\). Use integer values of \(x\), starting at \(−10\) and ending at \(4\). Round your \(y\)-values to the nearest tenth. After completing the table, set up a coordinate system on a sheet of graph paper. Label and scale each axis, then plot the points in your table. Finally, use the plotted points as evidence to draw the graph of \(y=\sqrt{4-x}\).
3.2: The Graphing Calculator
In Exercises 1-16, enter the given equation in the Y= menu of your calculator, then select 6:ZStandard from the ZOOM menu to produce its graph. Follow the Calculator Submission Guidelines outlined in the subsection Reproducing Calculator Results on Homework Paper when submitting your result on your homework paper.
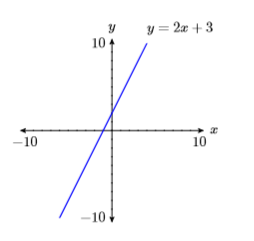
1) \(y=2 x+3\)
- Answer
-
2) \(y=3-2 x\)
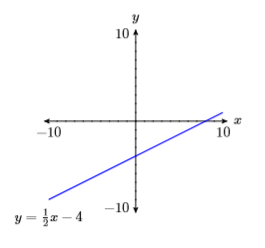
3) \(y=\dfrac{1}{2} x-4\)
- Answer
-
4) \(y=-\dfrac{2}{3} x+2\)
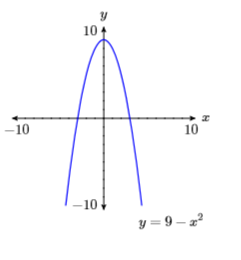
5) \(y=9-x^{2}\)
- Answer
-
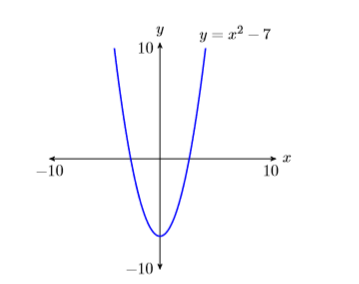
6) \(y=x^{2}-4\)
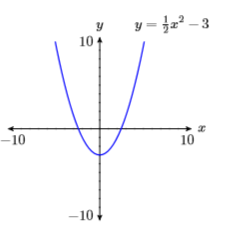
7) \(y=\dfrac{1}{2} x^{2}-3\)
- Answer
-
8) \(y=4-\dfrac{1}{3} x^{2}\)
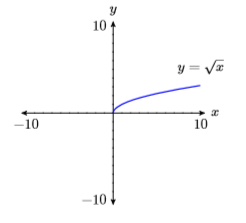
9) \(y=\sqrt{x}\)
- Answer
-
10) \(y=\sqrt{-x}\)
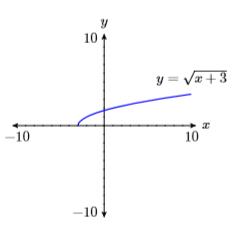
11) \(y=\sqrt{x+3}\)
- Answer
-
12) \(y=\sqrt{5-x}\)
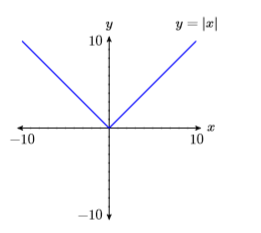
13) \(y=|x|\)
- Answer
-
14) \(y=-|x|\)
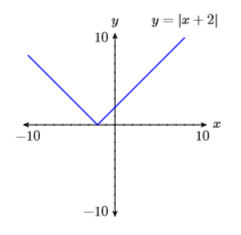
15) \(y=|x+2|\)
- Answer
-
16) \(y=-|x-3|\)
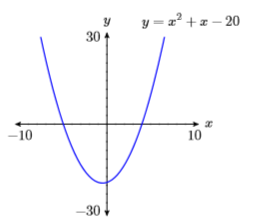
In Exercises 17-22, the graph of each given equation is a parabola, having a “u-shape” similar to the graph in Figure 3.2.13 Some of the parabolas “open up” and some “open down.” Adjust Ymin and/or Ymax in the WINDOW menu so that the “turning point” of the parabola, called its vertex, is visible in the viewing screen of your graphing calculator. Follow the Calculator Submission Guidelines outlined in the subsection Reproducing Calculator Results on Homework Paper when submitting your result on your homework paper.
17) \(y=x^{2}+x-20\)
- Answer
-
18) \(y=-x^{2}-2 x+24\)
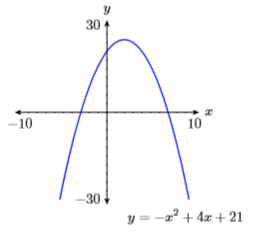
19) \(y=-x^{2}+4 x+21\)
- Answer
-
20) \(y=x^{2}+6 x-16\)
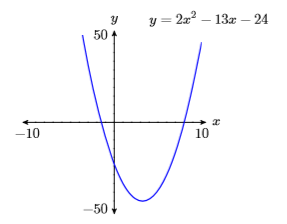
21) \(y=2 x^{2}-13 x-24\)
- Answer
-
22) \(y=-3 x^{2}-19 x+14\)
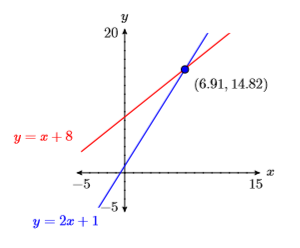
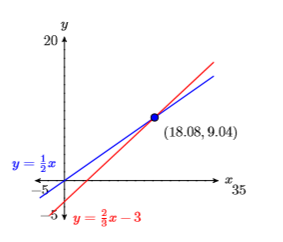
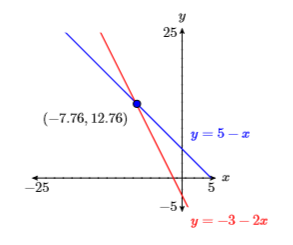
In Exercises 23-28, sketch the given lines, then adjust the WINDOW parameters so that the point of intersection of the two lines is visible in the viewing window. Use the TRACE key to estimate the point of intersection. Follow the Calculator Submission Guidelines outlined in the subsection Reproducing Calculator Results on Homework Paper when submitting your result on your homework paper. Be sure to also include your estimate of the point of intersection in your sketch.
23) \(y=2 x+1\) and \(y=x+8\)
- Answer
-
24) \(y=4-2 x\) and \(y=-6-x\)
25) \(y=\dfrac{1}{2} x\) and \(y=\dfrac{2}{3} x-3\)
- Answer
-
26) \(y=2 x+5\) and \(y=x-6\)
27) \(y=5-x\) and \(y=-3-2 x\)
- Answer
-
28) \(y=1-\dfrac{1}{2} x\) and \(y=-4-\dfrac{4}{5} x\)
3.3: Rates and Slope
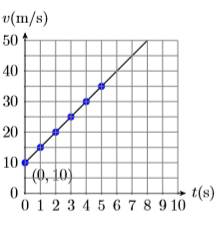
1) An object’s initial velocity at time \(t = 0\) seconds is \(v = 10\) meters per second. It then begins to pick up speed (accelerate) at a rate of \(5\) meters per second per second (\(5 \mathrm{m / s / s}\) or \(5\mathrm{m/{s}^{2}}\)).
- Set up a Cartesian Coordinate System on a sheet of graph paper. Label and scale each axis. Include units with your labels.
- Plot the point representing the initial velocity at time \(t = 0\) seconds. Then plot a minimum of \(5\) additional points using the fact that the object is accelerating at a rate of \(5\) meters per second per second.
- Sketch the line representing the object’s velocity versus time.
- Calculate the slope of the line.
- Answer
-
2) An object’s initial velocity at time \(t = 0\) seconds is \(v = 40\) meters per second. It then begins to lose speed at a rate of \(5\) meters per second per second (\(5 \mathrm{m / s / s}\) or \(5\mathrm{m/{s}^{2}}\)).
- Set up a Cartesian Coordinate System on a sheet of graph paper. Label and scale each axis. Include units with your labels.
- Plot the point representing the initial velocity at time \(t = 0\) seconds. Then plot a minimum of \(5\) additional points using the fact that the object is losing speed at a rate of 5 meters per second per second.
- Sketch the line representing the object’s velocity versus time.
- Calculate the slope of the line.
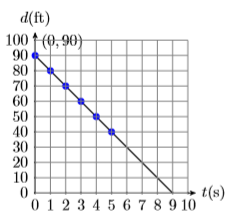
3) David first sees his brother when the distance separating them is \(90\) feet. He begins to run toward his brother, decreasing the distance d between him and his brother at a constant rate of \(10\) feet per second (10 ft/s).
- Set up a Cartesian Coordinate System on a sheet of graph paper. Label and scale each axis. Include units with your labels.
- Plot the point representing David’s initial distance from his brother at time t = 0 seconds. Then plot a minimum of 5 additional points using the fact that David’s distance from his brother is decreasing at a constant rate of 10 feet per second (\(10\mathrm{ft / s}\)).
- Sketch the line representing David’s distance from his brother versus time.
- Find the slope of the line.
- Answer:
-
4) David initially stands \(20\) feet from his brother when he sees his girl friend Mary in the distance. He begins to run away from his brother and towards Mary, increasing the distance d between him and his brother at a constant rate of \(10\) feet per second (\(10 \mathrm{ft / s}\)).
- Set up a Cartesian Coordinate System on a sheet of graph paper. Label and scale each axis. Include units with your labels.
- Plot the point representing David’s initial distance from his brother at time \(t = 0\) seconds. Then plot a minimum of \(5\) additional points using the fact that David’s distance from his brother is increasing at a constant rate of \(10\) feet per second (\(10 \mathrm{ft / s}\)).
- Sketch the line representing David’s distance from his brother versus time.
- Find the slope of the line.
In Exercises 5-14, calculate the slope of the line passing through the points \(P\) and \(Q\). Be sure to reduce your answer to lowest terms.
5) \(P(9,0), Q(-9,15)\)
- Answer
-
\(-\dfrac{5}{6}\)
6) \(P(19,-17), Q(-13,19)\)
7) \(P(0,11), Q(16,-11)\)
- Answer
-
\(-\dfrac{11}{8}\)
8) \(P(-10,-8), Q(11,19)\)
9) \(P(11,1), Q(-1,-1)\)
- Answer
-
\(\dfrac{1}{6}\)
10) \(P(16,-15), Q(-11,12)\)
11) \(P(-18,8), Q(3,-10)\)
- Answer
-
\(-\dfrac{6}{7}\)
12) \(P(9,9), Q(-6,3)\)
13) \(P(-18,10), Q(-9,7)\)
- Answer
-
\(-\dfrac{1}{3}\)
14) \(P(-7,20), Q(7,8)\)
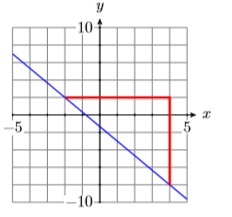
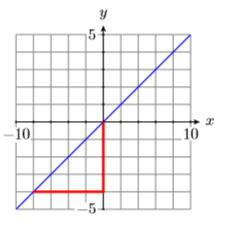
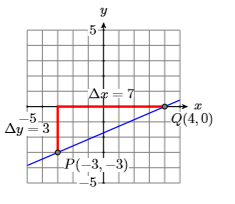
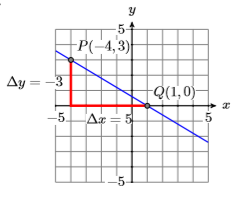
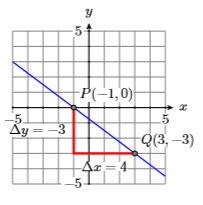
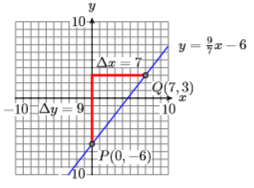
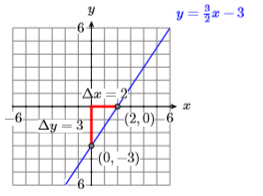
In Exercises 15-18, use the right triangle provided to help determine the slope of the line. Be sure to pay good attention to the scale provided on each axis when counting boxes to determine the change in \(y\) and the change in \(x\).
15)
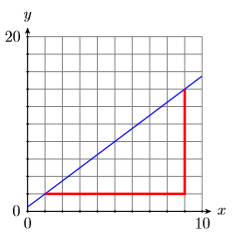
- Answer
-
\(\dfrac{3}{2}\)
16)
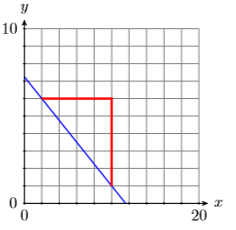
17)
- Answer
-
\(-\dfrac{5}{3}\)
18)
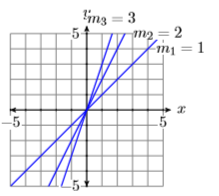
19) On one coordinate system, sketch each of the lines that pass through the following pairs of points. Label each line with its slope, then explain the relationship between the slope found and the steepness of the line drawn.
- \((0,0)\) and \((1,1)\)
- \((0,0)\) and \((1,2)\)
- \((0,0)\) and \((1,3)\)
- Answer
-
20) On one coordinate system, sketch each of the lines that pass through the following pairs of points. Label each line with its slope, then explain the relationship between the slope found and the steepness of the line drawn.
- \((0,0)\) and \((1,−1)\)
- \((0,0)\) and \((1,−2)\)
- \((0,0)\) and \((1,−3)\)
In Exercises 21-30, setup a coordinate system on graph paper, then sketch the line passing through the point \(P\) with the slope \(m\).
21) \(P(-4,0), m=-3 / 7\)
- Answer
-
22) \(P(-3,0), m=-3 / 7\)
23) \(P(-3,0), m=3 / 7\)
- Answer
-
24) \(P(-3,0), m=3 / 4\)
25) \(P(-3,-3), m=3 / 7\)
- Answer
-
26) \(P(-2,3), m=-3 / 5\)
27) \(P(-4,3), m=-3 / 5\)
- Answer
-
28) \(P(-1,-3), m=3 / 4\)
29) \(P(-1,0), m=-3 / 4\)
- Answer
-
30) \(P(-3,3), m=-3 / 4\)
3.4: Slope-Intercept Form of a Line
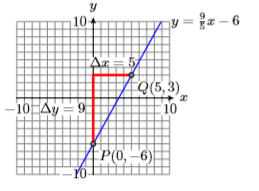
In Exercises 1-6, setup a coordinate system on graph paper, then sketch the line having the given equation. Label the line with its equation.
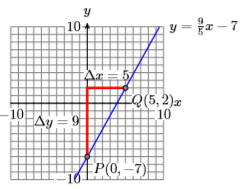
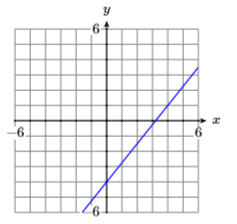
1) \(y=\dfrac{9}{5} x-6\)
- Answer
-
2) \(y=\dfrac{8}{7} x-1\)
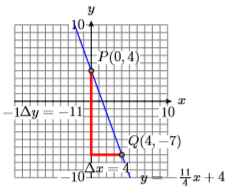
3) \(y=-\dfrac{11}{4} x+4\)
- Answer
-
4) \(y=\dfrac{5}{4} x\)
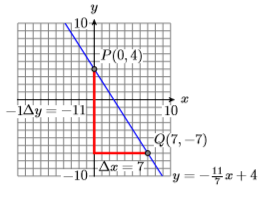
5) \(y=-\dfrac{11}{7} x+4\)
- Answer
-
6) \(y=-\dfrac{7}{5} x+7\)
In Exercises 7-12, sketch the line with given \(y\)-intercept slope. Label the line with the slope-intercept form of its equation.
7) \((0,-7), 9 / 5\)
- Answer
-
8) \((0,7),-4 / 5\)
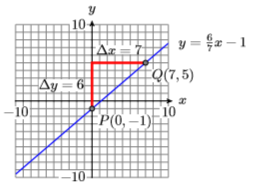
9) \((0,-1), 6 / 7\)
- Answer
-
10) \((0,1),-7 / 5\)
11) \((0,-6), 9 / 7\)
- Answer
-
12) \((0,-5), 7 / 5\)
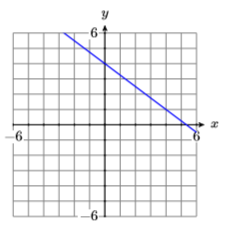
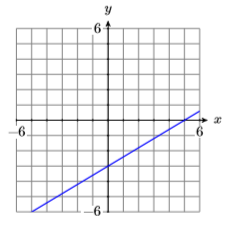
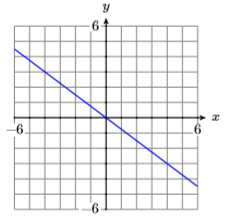
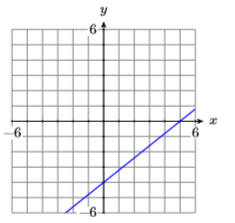
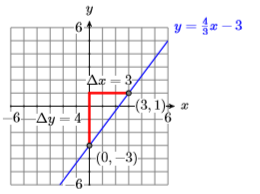
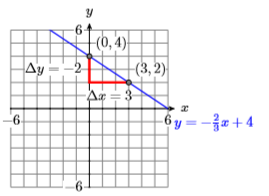
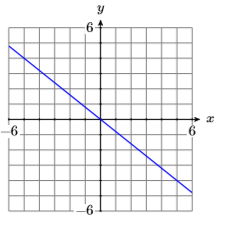
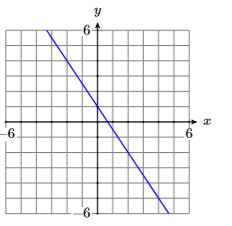
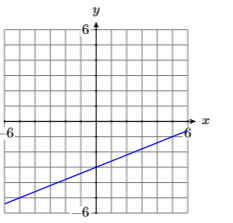
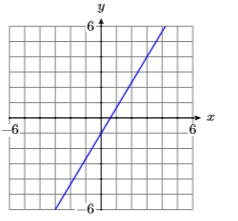
In Exercises 13-20, determine the equation of the given line in slope-intercept form.
13)
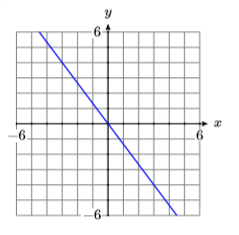
- Answer
-
\(y=-\dfrac{4}{3} x\)
14)
15)
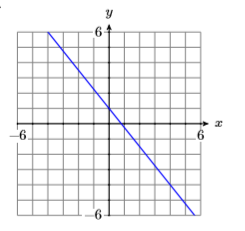
- Answer
-
\(y=-\dfrac{5}{4} x+1\)
16)
17)
- Answer
-
\(y=-\dfrac{3}{4} x\)
18)
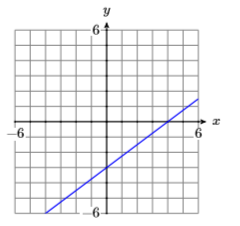
19)
- Answer
-
\(y=\dfrac{4}{5} x-4\)
20)
21) Assume that the relationship between an object’s velocity and its time is linear. At \(t = 0\) seconds, the object’s initial velocity is \(20 \mathrm{m / s}\). It then begins to speed up at a constant rate of \(5\) meters per second per second.
- Set up a coordinate system, placing the time \(t\) on the horizontal axis and the velocity \(v\) on the vertical axis. Label and scale each axis. Include units in your labels.
- Use the initial velocity and the rate at which the object’s velocity is increasing to draw the line representing the object’s velocity at time \(t\). Use the slope-intercept form to determine the equation of the line.
- Replace \(x\) and \(y\) in the equation found in part (b) with \(t\) and \(v\), respectively. Use the result to determine the velocity of the object after \(14\) seconds.
- Answer
-
c) \(90 \mathrm{m / s}\)
22) Assume that the relationship between an object’s velocity and its time is linear. At \(t = 0\) seconds, the object’s initial velocity is \(80 \mathrm{m / s}\). It then begins to lose speed at a constant rate of \(4\) meters per second per second.
- Set up a coordinate system, placing the time \(t\) on the horizontal axis and the velocity \(v\) on the vertical axis. Label and scale each axis. Include units in your labels.
- Use the initial velocity and the rate at which the object’s velocity is increasing to draw the line representing the object’s velocity at time \(t\). Use the slope-intercept form to determine the equation of the line.
- Replace \(x\) and \(y\) in the equation found in part (b) with \(t\) and \(v\), respectively. Use the result to determine the velocity of the object after \(13\) seconds.
23) A water tank initially (at time \(t = 0\) min) contains \(100\) gallons of water. A pipe is opened and water pours into the tank at a constant rate of \(25\) gallons per minute. Assume that the relation between the volume \(V\) of water in the tank and time \(t\) is linear.
- Set up a coordinate system, placing the time \(t\) on the horizontal axis and the volume of water \(V\) on the vertical axis. Label and scale each axis. Include units in your labels.
- Use the initial volume of water in the tank and the rate at which the volume of water is increasing to draw the line representing the volume \(V\) of water in the tank at time \(t\). Use the slope-intercept form to determine the equation of the line.
- Replace \(x\) and \(y\) in the equation found in part (b) with \(t\) and \(V\), respectively. Use the result to predict how much time must pass until the volume of water in the tank reaches \(400\) gallons.
- Answer
-
c) \(12\) min
24) A water tank initially (at time \(t = 0\) min) contains \(800\) gallons of water. A spigot is opened at the bottom of the tank and water pours out at a constant rate of \(40\) gallons per minute. Assume that the relation between the volume \(V\) of water in the tank and time \(t\) is linear.
- Set up a coordinate system, placing the time \(t\) on the horizontal axis and the volume of water \(V\) on the vertical axis. Label and scale each axis. Include units in your labels.
- Use the initial volume of water in the tank and the rate at which the volume of water is decreasing to draw the line representing the volume \(V\) of water in the tank at time \(t\). Use the slope-intercept form to determine the equation of the line.
- Replace \(x\) and \(y\) in the equation found in part (b) with \(t\) and \(V\), respectively. Use the result to predict how much time must pass until the water tank is empty.
3.5: Point-Slope Form of a Line
In Exercises 1-6, set up a coordinate system on a sheet of graph paper, then sketch the line through the given point with the given slope. Label the line with its equation in point-slope form.
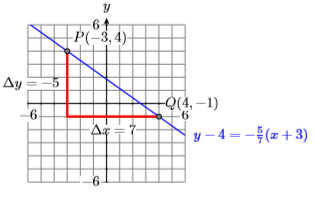
1) \(m=-5 / 7, P(-3,4)\)
- Answer
-
2) \(m=3 / 4, P(-2,-4)\)
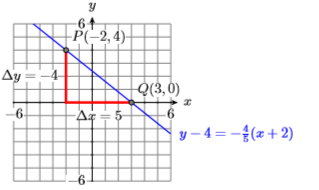
3) \(m=-4 / 5, P(-2,4)\)
- Answer
-
4) \(m=5 / 6, P(-3,-1)\)
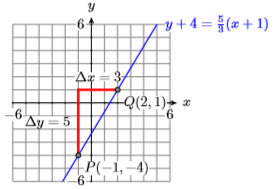
5) \(m=5 / 3, P(-1,-4)\)
- Answer
-
6) \(m=-3 / 8, P(-4,0)\)
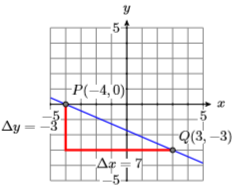
In Exercises 7-12, set up a coordinate system on a sheet of graph paper, then sketch the line through the given points. Label the line with the point-slope form of its equation.
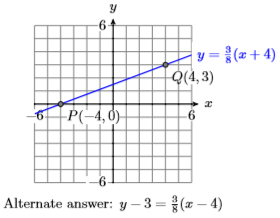
7) \(P(-4,0)\) and \(Q(4,3)\)
- Answer
-
8) \(P(-2,4)\) and \(Q(2,-1)\)
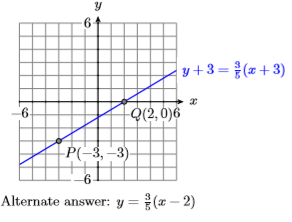
9) \(P(-3,-3)\) and \(Q(2,0)\)
- Answer
-
10) \(P(-3,4)\) and \(Q(2,0)\)
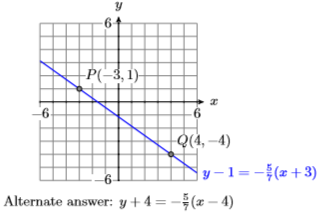
11) \(P(-3,1)\) and \(Q(4,-4)\)
- Answer
-
12) \(P(-1,0)\) and \(Q(4,3)\)
In Exercises 13-18, on a sheet of graph paper, sketch the given line. Plot the point \(P\) and draw a line through P that is parallel to the first line. Label this second line with its equation in point-slope form.
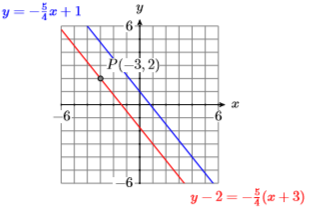
13) \(y=-\dfrac{5}{4} x+1, P(-3,2)\)
- Answer
-
14) \(y=-\dfrac{3}{5} x, P(-4,0)\)
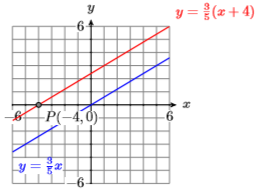
15) \(y=\dfrac{3}{5} x, P(-4,0)\)
- Answer
-
16) \(y=\dfrac{5}{3} x-1, P(-2,-2)\)
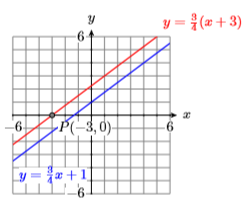
17) \(y=\dfrac{3}{4} x+1, P(-3,0)\)
- Answer
-
18) \(y=\dfrac{5}{4} x-4, P(-2,-2)\)
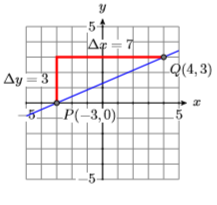
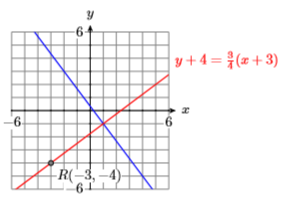
In Exercises 19-24, on a sheet of graph paper, sketch the line passing through the points \(P\) and \(Q\). Plot the point \(R\) and draw a line through \(R\) that is perpendicular to the line passing through the points \(P\) and \(Q\). Label this second line with its equation in point-slope form.
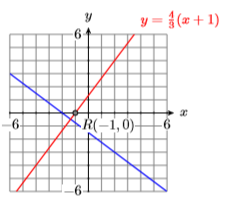
19) \(P(-2,0), Q(2,-3),\) and \(R(-1,0)\)
- Answer
-
20) \(P(-1,3), Q(2,-2),\) and \(R(-1,0)\)
21) \(P(-2,-4), Q(1,4),\) and \(R(-4,-1)\)
- Answer
-
22) \(P(-4,-4), Q(-1,3),\) and \(R(-4,2)\)
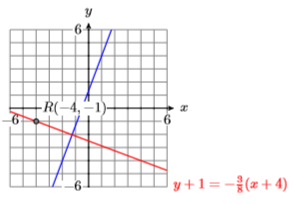
23) \(P(-2,3), Q(1,-1),\) and \(R(-3,-4)\)
- Answer
-
24) \(P(-4,4), Q(1,-4),\) and \(R(-4,-3)\)
25) Assume that the relationship between an object’s velocity and its time is linear. At \(3\) seconds, the object’s velocity is \(50 \mathrm{ft / s}\). At \(14\) seconds, the object’s velocity is \(30 \mathrm{ft / s}\).
- Set up a coordinate system, placing the time \(t\) on the horizontal axis and the velocity \(v\) on the vertical axis. Label and scale each axis. Include units in your labels.
- Plot the points determined by the given data and draw a line through them. Use the point-slope form of the line to determine the equation of the line.
- Replace \(x\) and \(y\) in the equation found in part (b) with \(t\) and \(v\), respectively, then solve the resulting equation for \(v\).
- Use the result of part (c) to determine the velocity of the object after \(6\) seconds.
- Answer
-
\(44.5 \mathrm{ft / s}\)
26) Water freezes at approximately \(32^{\circ} \mathrm{F}\) and \(273^{\circ} \mathrm{K}\), where \(\mathrm{F}\) represents the temperature measured on the Fahrenheit scale and \(\mathrm{K}\) represents the temperature measured on the Kelvin scale. Water boils at approximately \(212^{\circ} \mathrm{F}\) and \(373^{\circ} \mathrm{K}\). Assume that the relation between the Fahrenheit and Kelvin temperatures is linear.
- Set up a coordinate system, placing the Kelvin temperature \(\mathrm{K}\) on the horizontal axis and the Fahrenheit temperature \(\mathrm{F}\) on the vertical axis. Label and scale each axis. Include units in your labels.
- Plot the points determined by the given data and draw a line through them. Use the point-slope form of the line to determine the equation of the line.
- Replace \(x\) and \(y\) in the equation found in part (b) with \(\mathrm{K}\) and \(\mathrm{F}\), respectively, then solve the resulting equation for \(\mathrm{F}\).
- Use the result of part (c) to determine the Fahrenheit temperature of the object if the Kelvin temperature is \(212^{\circ} \mathrm{K}\).
3.6: Standard Form of a Line
In Exercises 1-6, place the given standard form into slope-intercept form and sketch its graph. Label the graph with its slope-intercept form.
1) \(4 x-3 y=9\)
- Answer
-
2) \(2 x-3 y=3\)
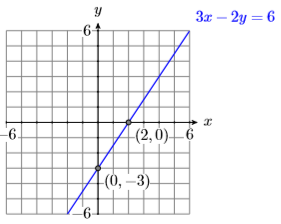
3) \(3 x-2 y=6\)
- Answer
-
4) \(5 x-3 y=3\)
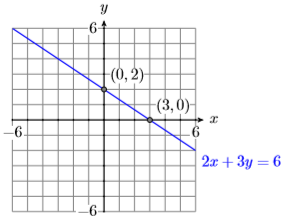
5) \(2 x+3 y=12\)
- Answer
-
6) \(3 x+4 y=8\)
In Exercises 7-10, determine an equation of the given line in standard form.
7)
- Answer
-
\(4 x+5 y=0\)
8)
9)
- Answer
-
\(2 x-5 y=15\)
10)
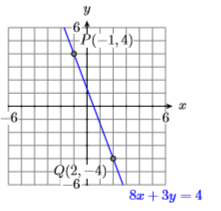
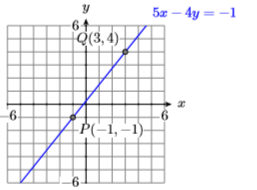
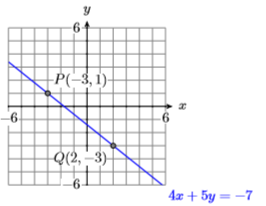
In Exercises 11-16, sketch the line passing through the points \(P\) and \(Q\). Label the line with its equation in standard form.
11) \(P(-1,4)\) and \(Q(2,-4)\)
- Answer
-
12) \(P(-1,4)\) and \(Q(3,1)\)
13) \(P(-1,-1)\) and \(Q(3,4)\)
- Answer
-
14) \(P(2,-1)\) and \(Q(4,4)\)
15) \(P(-3,1)\) and \(Q(2,-3)\)
- Answer
-
16) \(P(-4,3)\) and \(Q(0,0)\)
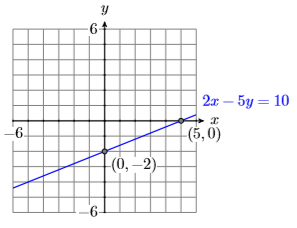
In Exercises 17-22, plot the \(x\)- and \(y\)-intercepts of the line having the given equation, then draw the line through the intercepts and label it with its equation.
17) \(2 x-5 y=10\)
- Answer
-
18) \(2 x+3 y=-6\)
19) \(3 x-2 y=6\)
- Answer
-
20) \(3 x-4 y=12\)
21) \(2 x+3 y=6\)
- Answer
-
22) \(2 x-3 y=-6\)
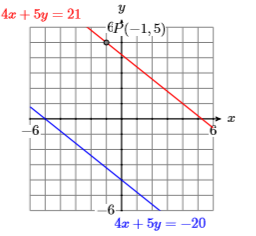
23) Find an equation of the line (in standard form) that passes through the point \(P(−1,5)\) that is parallel to the line \(4x + 5y =−20\).
- Answer
-
24) Find an equation of the line (in standard form) that passes through the point \(P(−3,2)\) that is parallel to the line \(3x + 5y =−15\).
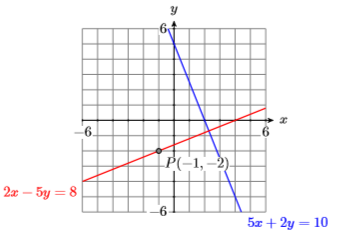
25) Find an equation of the line (in standard form) that passes through the point \(P(−1,−2)\) that is perpendicular to the line \(5x +2y = 10\).
- Answer
-
26) Find an equation of the line (in standard form) that passes through the point \(P(−1,−2)\) that is perpendicular to the line \(2x +5y = −10\).
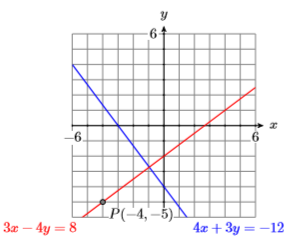
27) Find an equation of the line (in standard form) that passes through the point \(P(−4,−5)\) that is perpendicular to the line \(4x +3y = −12\).
- Answer
-
28) Find an equation of the line (in standard form) that passes through the point \(P(−2,−3)\) that is perpendicular to the line \(3x +2y = 6\).
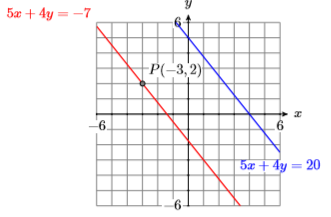
29) Find an equation of the line (in standard form) that passes through the point \(P(−3,2)\) that is parallel to the line \(5x + 4y = 20\).
- Answer
-
30) Find an equation of the line (in standard form) that passes through the point \(P(−1,3)\) that is parallel to the line \(3x + 5y = −15\).
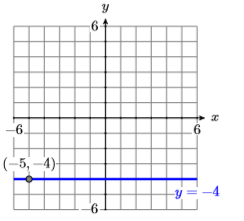
31) Sketch the equation of the horizontal line passing through the point \(P(−5,−4)\) and label it with its equation.
- Answer
-
32) Sketch the equation of the vertical line passing through the point \(P(−4,4)\) and label it with its equation.
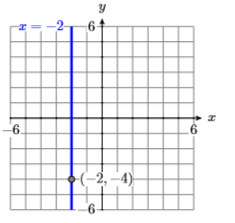
33) Sketch the equation of the vertical line passing through the point \(P(−2,−4)\) and label it with its equation.
- Answer
-
34) Sketch the equation of the vertical line passing through the point \(P(1,3)\) and label it with its equation.