
5.8.1: Exercises
- Page ID
- 169545
\( \newcommand{\vecs}[1]{\overset { \scriptstyle \rightharpoonup} {\mathbf{#1}} } \)
\( \newcommand{\vecd}[1]{\overset{-\!-\!\rightharpoonup}{\vphantom{a}\smash {#1}}} \)
\( \newcommand{\dsum}{\displaystyle\sum\limits} \)
\( \newcommand{\dint}{\displaystyle\int\limits} \)
\( \newcommand{\dlim}{\displaystyle\lim\limits} \)
\( \newcommand{\id}{\mathrm{id}}\) \( \newcommand{\Span}{\mathrm{span}}\)
( \newcommand{\kernel}{\mathrm{null}\,}\) \( \newcommand{\range}{\mathrm{range}\,}\)
\( \newcommand{\RealPart}{\mathrm{Re}}\) \( \newcommand{\ImaginaryPart}{\mathrm{Im}}\)
\( \newcommand{\Argument}{\mathrm{Arg}}\) \( \newcommand{\norm}[1]{\| #1 \|}\)
\( \newcommand{\inner}[2]{\langle #1, #2 \rangle}\)
\( \newcommand{\Span}{\mathrm{span}}\)
\( \newcommand{\id}{\mathrm{id}}\)
\( \newcommand{\Span}{\mathrm{span}}\)
\( \newcommand{\kernel}{\mathrm{null}\,}\)
\( \newcommand{\range}{\mathrm{range}\,}\)
\( \newcommand{\RealPart}{\mathrm{Re}}\)
\( \newcommand{\ImaginaryPart}{\mathrm{Im}}\)
\( \newcommand{\Argument}{\mathrm{Arg}}\)
\( \newcommand{\norm}[1]{\| #1 \|}\)
\( \newcommand{\inner}[2]{\langle #1, #2 \rangle}\)
\( \newcommand{\Span}{\mathrm{span}}\) \( \newcommand{\AA}{\unicode[.8,0]{x212B}}\)
\( \newcommand{\vectorA}[1]{\vec{#1}} % arrow\)
\( \newcommand{\vectorAt}[1]{\vec{\text{#1}}} % arrow\)
\( \newcommand{\vectorB}[1]{\overset { \scriptstyle \rightharpoonup} {\mathbf{#1}} } \)
\( \newcommand{\vectorC}[1]{\textbf{#1}} \)
\( \newcommand{\vectorD}[1]{\overrightarrow{#1}} \)
\( \newcommand{\vectorDt}[1]{\overrightarrow{\text{#1}}} \)
\( \newcommand{\vectE}[1]{\overset{-\!-\!\rightharpoonup}{\vphantom{a}\smash{\mathbf {#1}}}} \)
\( \newcommand{\vecs}[1]{\overset { \scriptstyle \rightharpoonup} {\mathbf{#1}} } \)
\(\newcommand{\longvect}{\overrightarrow}\)
\( \newcommand{\vecd}[1]{\overset{-\!-\!\rightharpoonup}{\vphantom{a}\smash {#1}}} \)
\(\newcommand{\avec}{\mathbf a}\) \(\newcommand{\bvec}{\mathbf b}\) \(\newcommand{\cvec}{\mathbf c}\) \(\newcommand{\dvec}{\mathbf d}\) \(\newcommand{\dtil}{\widetilde{\mathbf d}}\) \(\newcommand{\evec}{\mathbf e}\) \(\newcommand{\fvec}{\mathbf f}\) \(\newcommand{\nvec}{\mathbf n}\) \(\newcommand{\pvec}{\mathbf p}\) \(\newcommand{\qvec}{\mathbf q}\) \(\newcommand{\svec}{\mathbf s}\) \(\newcommand{\tvec}{\mathbf t}\) \(\newcommand{\uvec}{\mathbf u}\) \(\newcommand{\vvec}{\mathbf v}\) \(\newcommand{\wvec}{\mathbf w}\) \(\newcommand{\xvec}{\mathbf x}\) \(\newcommand{\yvec}{\mathbf y}\) \(\newcommand{\zvec}{\mathbf z}\) \(\newcommand{\rvec}{\mathbf r}\) \(\newcommand{\mvec}{\mathbf m}\) \(\newcommand{\zerovec}{\mathbf 0}\) \(\newcommand{\onevec}{\mathbf 1}\) \(\newcommand{\real}{\mathbb R}\) \(\newcommand{\twovec}[2]{\left[\begin{array}{r}#1 \\ #2 \end{array}\right]}\) \(\newcommand{\ctwovec}[2]{\left[\begin{array}{c}#1 \\ #2 \end{array}\right]}\) \(\newcommand{\threevec}[3]{\left[\begin{array}{r}#1 \\ #2 \\ #3 \end{array}\right]}\) \(\newcommand{\cthreevec}[3]{\left[\begin{array}{c}#1 \\ #2 \\ #3 \end{array}\right]}\) \(\newcommand{\fourvec}[4]{\left[\begin{array}{r}#1 \\ #2 \\ #3 \\ #4 \end{array}\right]}\) \(\newcommand{\cfourvec}[4]{\left[\begin{array}{c}#1 \\ #2 \\ #3 \\ #4 \end{array}\right]}\) \(\newcommand{\fivevec}[5]{\left[\begin{array}{r}#1 \\ #2 \\ #3 \\ #4 \\ #5 \\ \end{array}\right]}\) \(\newcommand{\cfivevec}[5]{\left[\begin{array}{c}#1 \\ #2 \\ #3 \\ #4 \\ #5 \\ \end{array}\right]}\) \(\newcommand{\mattwo}[4]{\left[\begin{array}{rr}#1 \amp #2 \\ #3 \amp #4 \\ \end{array}\right]}\) \(\newcommand{\laspan}[1]{\text{Span}\{#1\}}\) \(\newcommand{\bcal}{\cal B}\) \(\newcommand{\ccal}{\cal C}\) \(\newcommand{\scal}{\cal S}\) \(\newcommand{\wcal}{\cal W}\) \(\newcommand{\ecal}{\cal E}\) \(\newcommand{\coords}[2]{\left\{#1\right\}_{#2}}\) \(\newcommand{\gray}[1]{\color{gray}{#1}}\) \(\newcommand{\lgray}[1]{\color{lightgray}{#1}}\) \(\newcommand{\rank}{\operatorname{rank}}\) \(\newcommand{\row}{\text{Row}}\) \(\newcommand{\col}{\text{Col}}\) \(\renewcommand{\row}{\text{Row}}\) \(\newcommand{\nul}{\text{Nul}}\) \(\newcommand{\var}{\text{Var}}\) \(\newcommand{\corr}{\text{corr}}\) \(\newcommand{\len}[1]{\left|#1\right|}\) \(\newcommand{\bbar}{\overline{\bvec}}\) \(\newcommand{\bhat}{\widehat{\bvec}}\) \(\newcommand{\bperp}{\bvec^\perp}\) \(\newcommand{\xhat}{\widehat{\xvec}}\) \(\newcommand{\vhat}{\widehat{\vvec}}\) \(\newcommand{\uhat}{\widehat{\uvec}}\) \(\newcommand{\what}{\widehat{\wvec}}\) \(\newcommand{\Sighat}{\widehat{\Sigma}}\) \(\newcommand{\lt}{<}\) \(\newcommand{\gt}{>}\) \(\newcommand{\amp}{&}\) \(\definecolor{fillinmathshade}{gray}{0.9}\)For the following exercises, find the \(x\)- and \(y\)-intercepts on the graph.


For the following exercises, graph using the intercepts.
\(- x + 4y = 8\)
\(x + y = - 3\)
\(4x + y = 4\)
\(3x - y = - 6\)
\(2x + 4y = 12\)
\(2x - 5y = - 20\)
\(y = - 2x\)
\(y = x\)
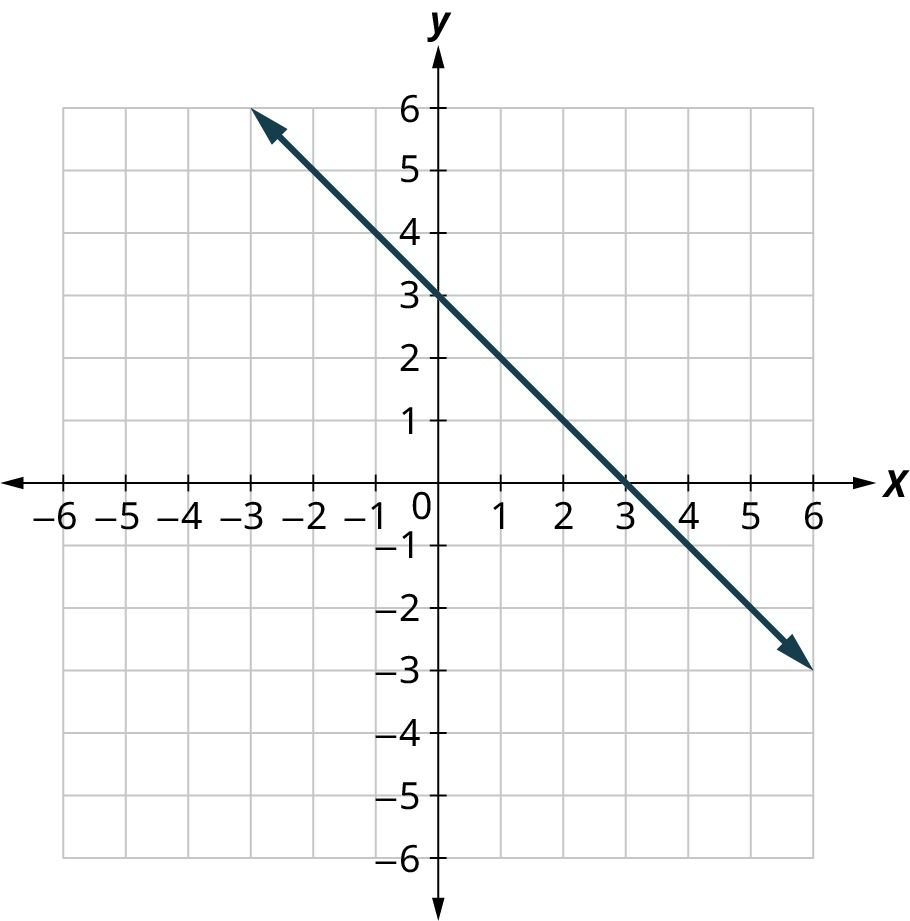
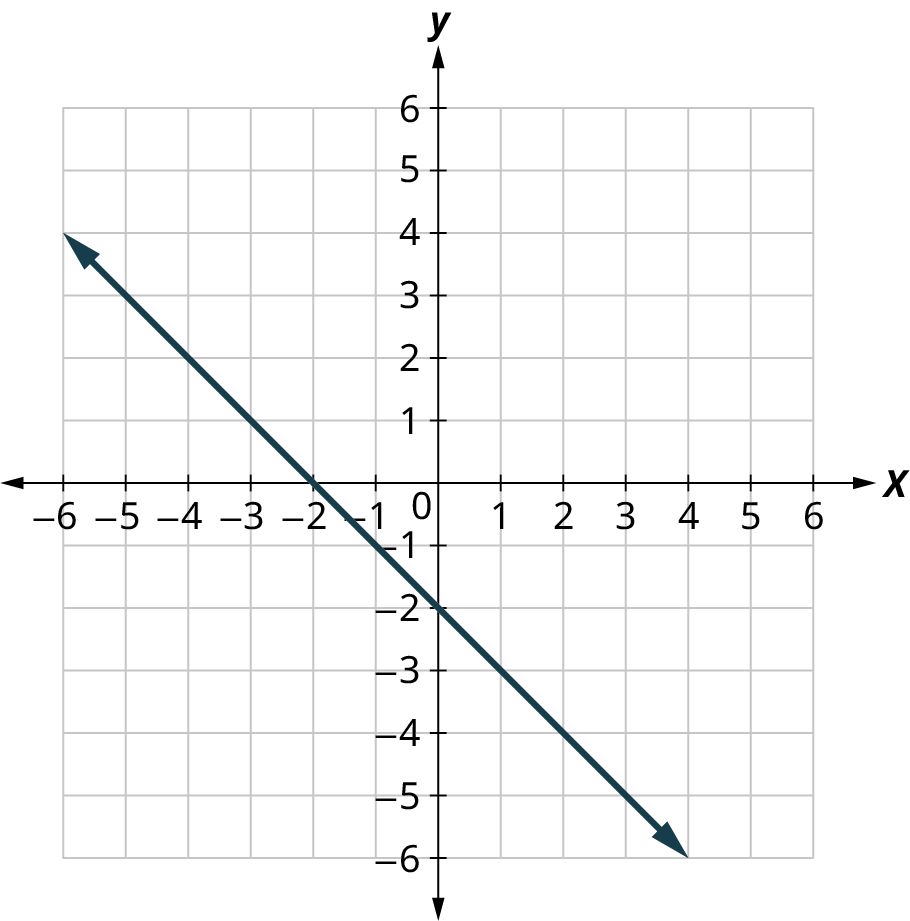
For the following exercises, find the slope of the line.


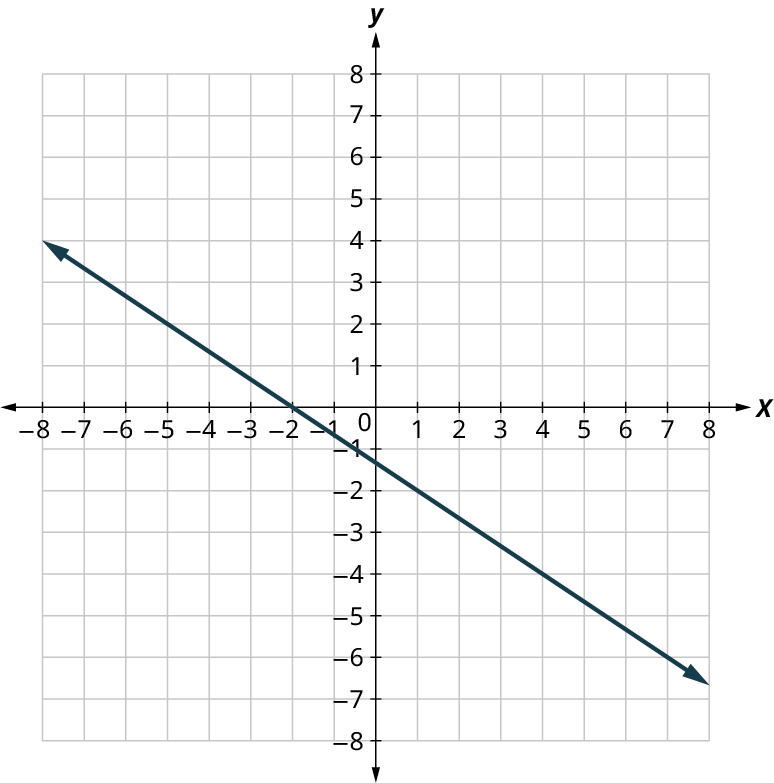


For the following exercises, use the slope formula to find the slope of the line between each pair of points.
(2, 5), (4, 0)
(−3, 3), (4, −5)
(−1, −2), (2, 5)
(4, −5), (1, −2)
For the following exercises, identify the slope and \(y\)-intercept of each line.
\(y = - 7x + 3\)
\(y = 4x - 10\)
\(3x + y = 5\)
\(4x + y = 8\)
\(6x + 4y = 12\)
\(8x + 3y = 12\)
\(5x - 2y = 6\)
\(7x - 3y = 9\)
For the following exercises, graph the line of each equation using its slope and \(y\)-intercept.
\(y = 3x - 1\)
\(y = 2x - 3\)
\(y = - x + 3\)
\(y = - x - 4\)
\(y = - 2x - 3\)
\(y = - 3x + 2\)
\(3x - 2y = 4\)
\(3x - 4y = 8\)
For the following exercises, find the slope of each line and graph.
\(y = 3\)
\(y = - 2\)
\(x = - 5\)
\(x = 4\)
For the following exercises, graph and interpret applications of slope-intercept.
The equation \(P = 31 + 1.75w\) models the relation between the amount of Tuyet’s monthly water bill payment, \(P\), in dollars, and the number of units of water, \(w\), used.
Find Tuyet’s payment for a month when 0 units of water are used.
Find Tuyet’s payment for a month when 12 units of water are used.
Interpret the slope and \(P\)-intercept of the equation.
Graph the equation.
For the following exercises, graph and interpret applications of slope-intercept.
Bruce drives his car for his job. The equation \(R = 0.575m + 42\) models the relation between the amount in dollars, \(R\), that he is reimbursed and the number of miles, \(m\), he drives in one day.
Find the amount Bruce is reimbursed on a day when he drives 0 miles.
Find the amount Bruce is reimbursed on a day when he drives 220 miles.
Interpret the slope and \(R\)-intercept of the equation.
Graph the equation.
For the following exercises, graph and interpret applications of slope-intercept.
Cherie works in retail and her weekly salary includes commission for the amount she sells. The equation \(S = 400 + 0.15c\) models the relation between her weekly salary, \(S\), in dollars and the amount of her sales, \(c\), in dollars.
Find Cherie’s salary for a week when her sales were $0.
Find Cherie’s salary for a week when her sales were $3,600.
Interpret the slope and \(S\)-intercept of the equation.
Graph the equation.
For the following exercises, graph and interpret applications of slope-intercept.
Costa is planning a lunch banquet. The equation \(C = 450 + 28g\) models the relation between the cost in dollars, \(C\), of the banquet and the number of guests, \(g\).
Find the cost if the number of guests is 40.
Find the cost if the number of guests is 80.
Interpret the slope and \(C\)-intercept of the equation.
Graph the equation.