
5.11: Systems of Linear Inequalities in Two Variables
- Page ID
- 129562

Learning Objectives
After completing this section, you should be able to:
- Demonstrate whether an ordered pair is a solution to a system of linear inequalities.
- Solve systems of linear inequalities using graphical methods.
- Graph systems of linear inequalities.
- Interpret and solve applications of linear inequalities.
In this section, we will learn how to solve systems of linear inequalities in two variables. In Systems of Linear Equations in Two Variables, we learned how to solve for systems of linear equations in two variables and found a solution that would work in both equations. We can solve systems of inequalities by graphing each inequality (as discussed in Graphing Linear Equations and Inequalities) and putting these on the same coordinate system. The double-shaded part will be our solution to the system. There are many real-life examples for solving systems of linear inequalities.
Consider Ming who has two jobs to help her pay for college. She works at a local coffee shop for $7.50 per hour and at a research lab on campus for $12 per hour. Due to her busy class schedule, she cannot work more than 15 hours per week. If she needs to make at least $150 per week, can she work seven hours at the coffee shop and eight hours in the lab?
Determining If an Ordered Pair Is a Solution of a System of Linear Inequalities
The definition of a system of linear inequalities is similar to the definition of a system of linear equations. A system of linear inequalities looks like a system of linear equations, but it has inequalities instead of equations. A system of two linear inequalities is shown here.
To solve a system of linear inequalities, we will find values of the variables that are solutions to both inequalities. We solve the system by using the graphs of each inequality and show the solution as a graph. We will find the region on the plane that contains all ordered pairs that make both inequalities true. The solution of a system of linear inequalities is shown as a shaded region in the -coordinate system that includes all the points whose ordered pairs make the inequalities true.
To determine if an ordered pair is a solution to a system of two inequalities, substitute the values of the variables into each inequality. If the ordered pair makes both inequalities true, it is a solution to the system.
Example 5.89
Determining Whether an Ordered Pair Is a Solution to a System
Determine whether the ordered pair is a solution to the system:
- Answer
- Is the ordered pair a solution?
We substitute and into both inequalities.
The ordered pair made both inequalities true. Therefore is a solution to this system.
- Is the ordered pair a solution?
We substitute and into both inequalities.
The ordered pair made one inequality true, but the other one false. Therefore is not a solution to this system.
- Is the ordered pair a solution?
Your Turn 5.89
10 \hfill \\ 2x + 3y > - 2 \hfill \\ \end{gathered} \right." class=" math-rendered">/**/\left\{ \begin{gathered} x - 5y > 10 \hfill \\ 2x + 3y > - 2 \hfill \\ \end{gathered} \right./**/
Solving Systems of Linear Inequalities Using Graphical Methods
The solution to a single linear inequality was the region on one side of the boundary line that contains all the points that make the inequality true. The solution to a system of two linear inequalities is a region that contains the solutions to both inequalities. We will review graphs of linear inequalities and solve the linear inequality from its graph.
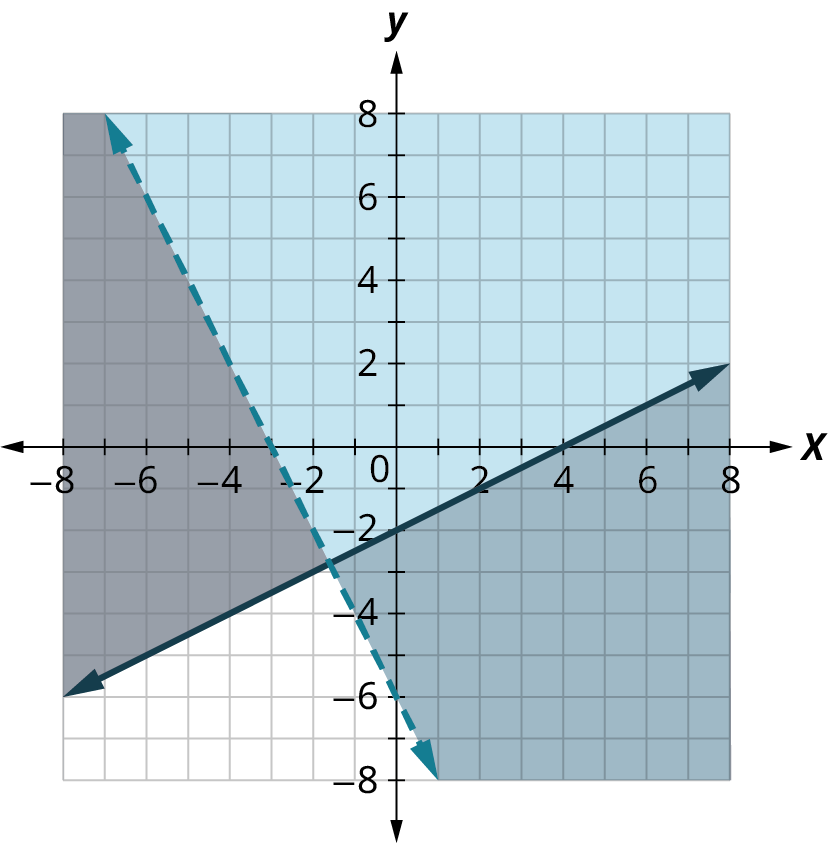
Example 5.90
Solving a System of Linear Inequalities by Graphing
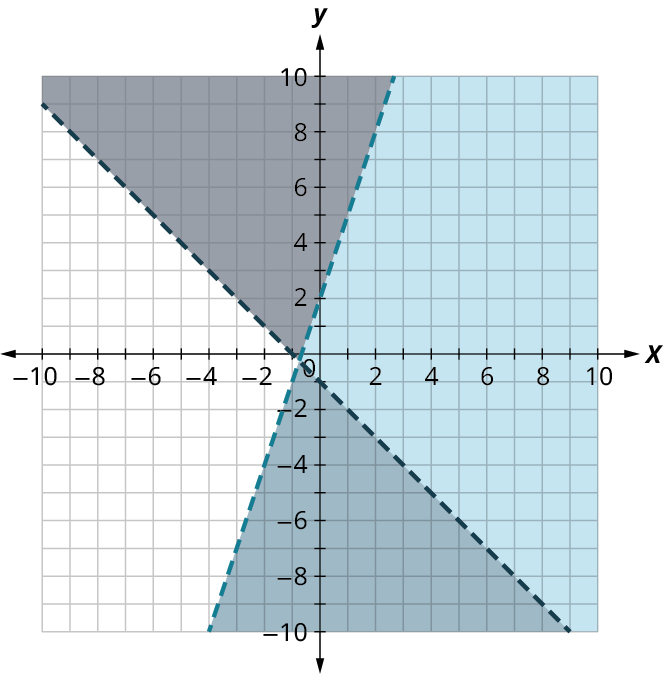
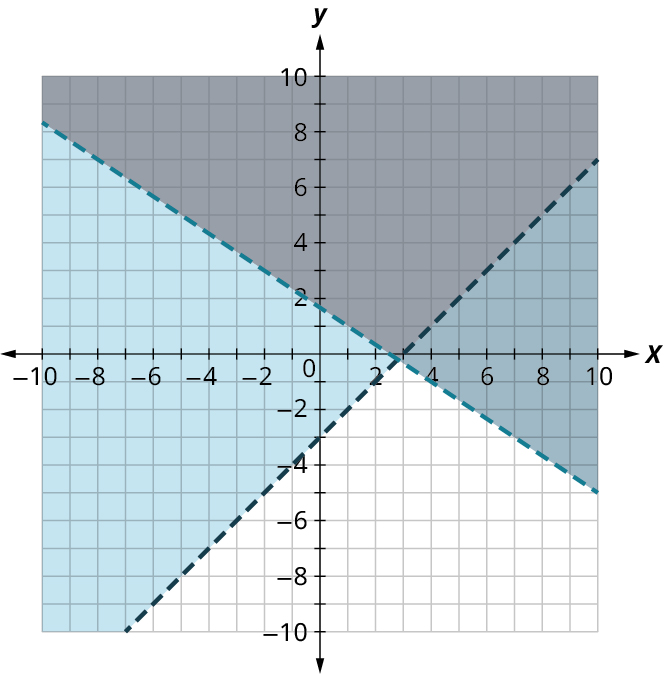
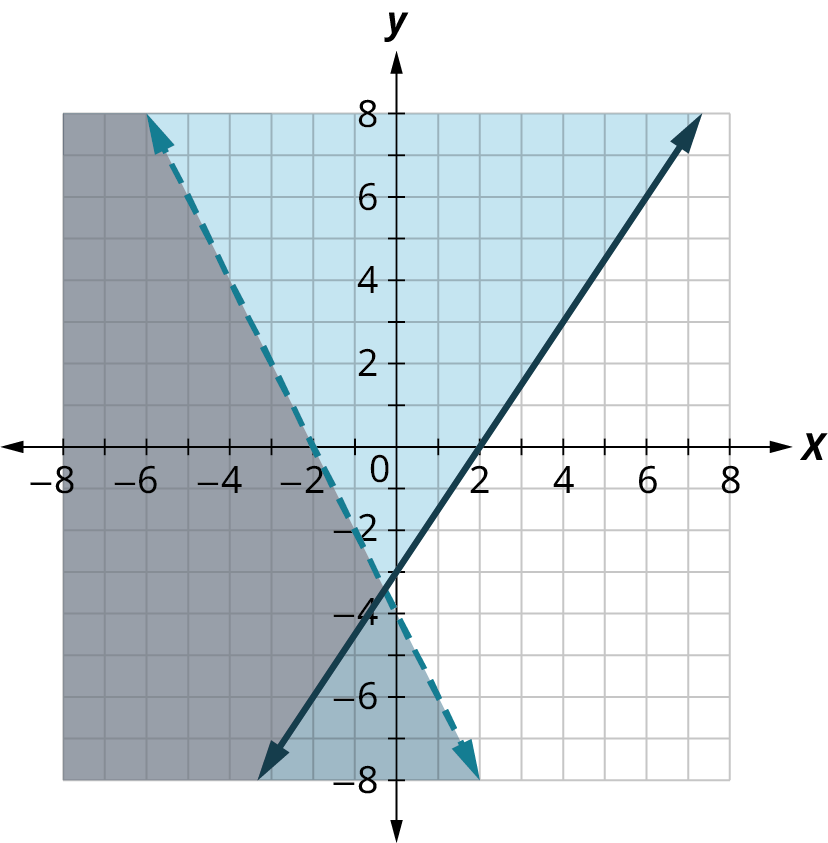
Use Figure 5.98 to solve the system of linear inequalities:
- Answer
To solve the system of linear inequalities we look at the graph and find the region that satisfies BOTH inequalities. To do this we pick a test point and check. Let's us pick .
Is a solution to
Is a solution to
The region containing is the solution to the system of linear inequalities. Notice that the solution is all the points in the area shaded twice, which appears as the darkest shaded region.
Your Turn 5.90
- x - 1 \\ \end{array}} \right." class=" math-rendered">/**/\left\{ {\begin{array}{*{20}{c}} y < 3x + 2 \\ y > - x - 1 \\ \end{array}} \right./**/
Graphing Systems of Linear Inequalities
We learned that the solution to a system of two linear inequalities is a region that contains the solutions to both inequalities. To find this region by graphing, we will graph each inequality separately and then locate the region where they are both true. The solution is always shown as a graph.
Step 1: Graph the first inequality.
Graph the boundary line.
Shade in the side of the boundary line where the inequality is true.
Step 2: On the same grid, graph the second inequality.
Graph the boundary line.
Shade in the side of that boundary line where the inequality is true.
Step 3: The solution is the region where the shading overlaps.
Step 4: Check by choosing a test point.
Example 5.91
Solving a System of Linear Inequalities by Graphing
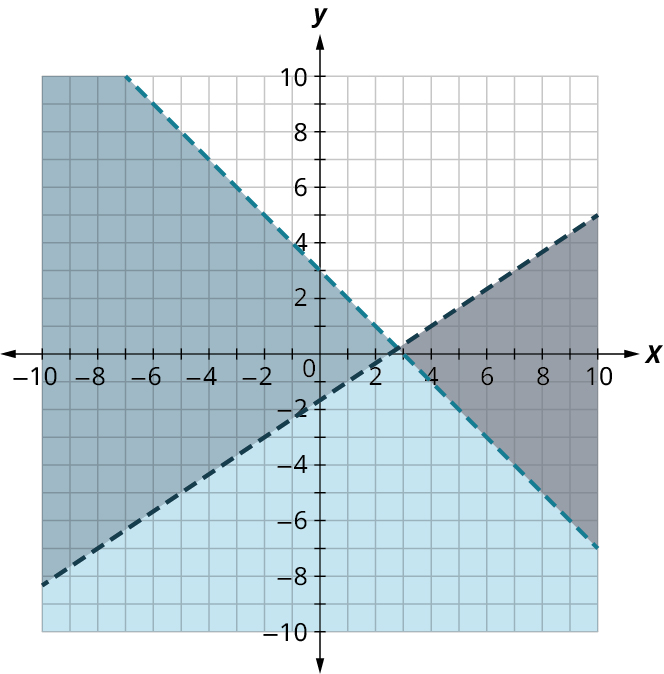
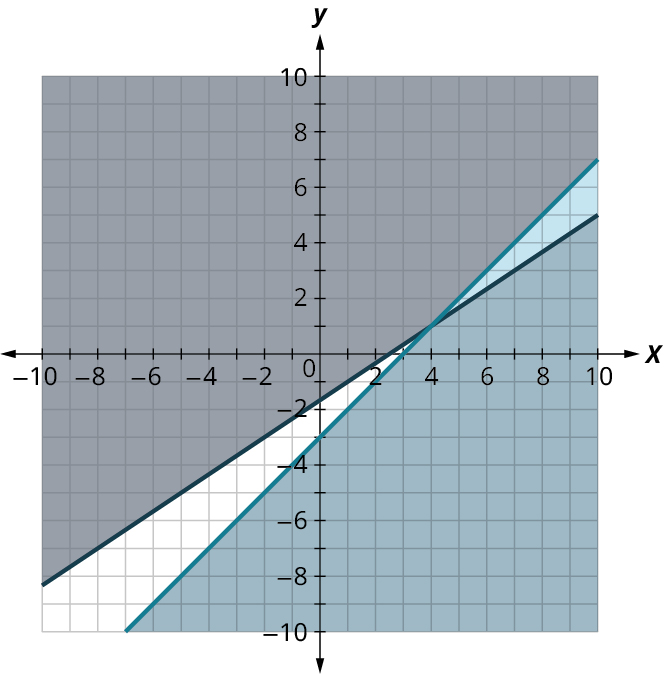
Solve the system by graphing:
- Answer
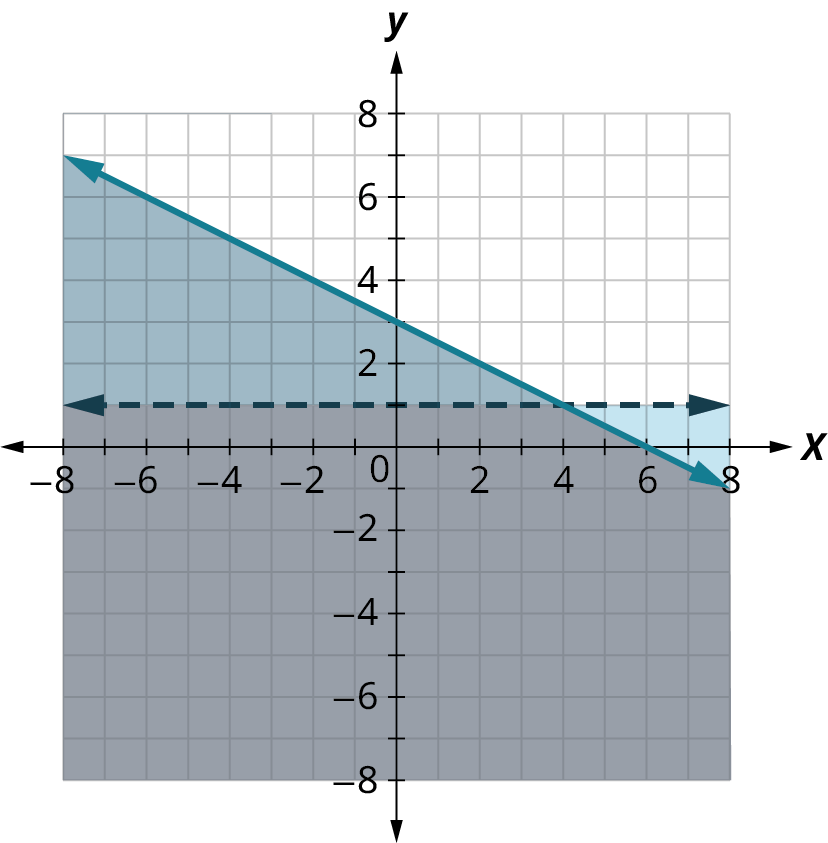
Graph
Figure 5.100Graph
Figure 5.101Choose a test point in the solution and verify that it is a solution to both inequalities. The point of intersection of the two lines is not included as both boundary lines were dashed. The solution is the area shaded twice—which appears as the darkest shaded region.
Your Turn 5.91
/**/\left\{ {\begin{array}{*{20}{c}} {x + y \leq 2} \\ {y \geq \frac{2}{3}x - 1} \end{array}} \right./**/
Example 5.92
Graphing a System of Linear Inequalities
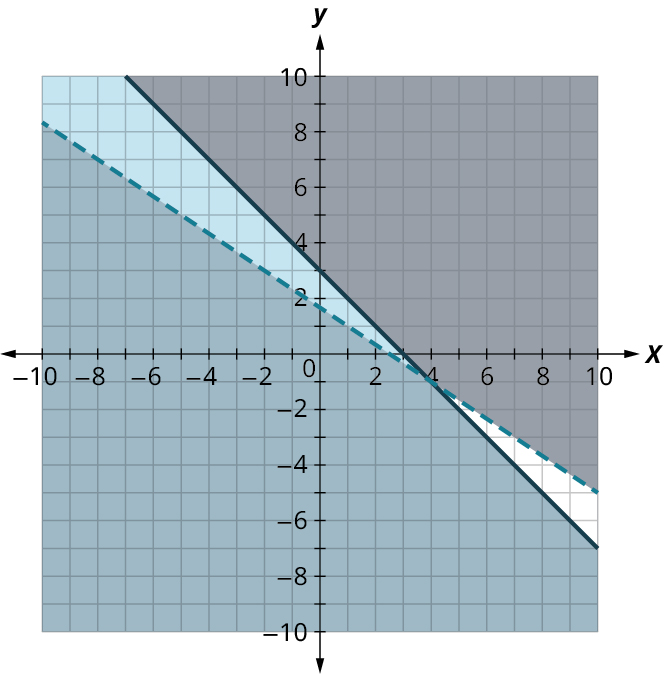
Solve the system by graphing:
- Answer
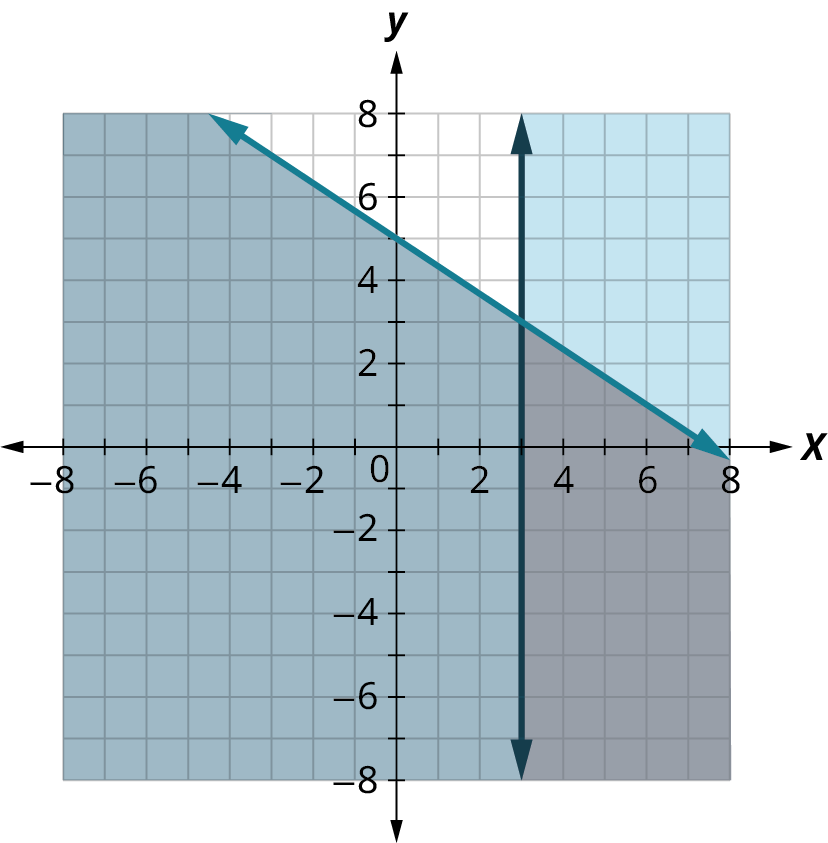
Graph
Figure 5.102Graph
Figure 5.103The point is in the solution, and we have already found it to be a solution of each inequality. The point of intersection of the two lines is not included as both boundary lines were dashed. The solution is the area shaded twice, which appears as the darkest shaded region.
Your Turn 5.92
/**/\left\{ {\begin{array}{*{20}{c}} y \geq 3x - 2 \hfill \\ y < - 1 \hfill \\ \end{array}} \right./**/
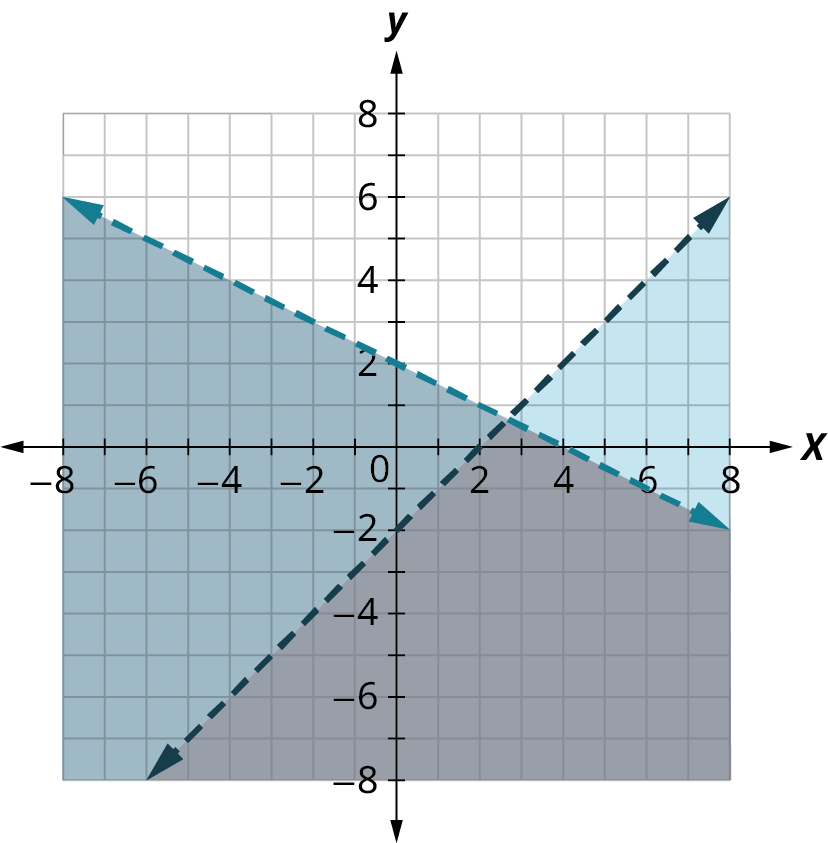
Systems of linear inequalities where the boundary lines are parallel might have no solution. We will see this in the next example.
Example 5.93
Graphing Parallel Boundary Lines with No Solution
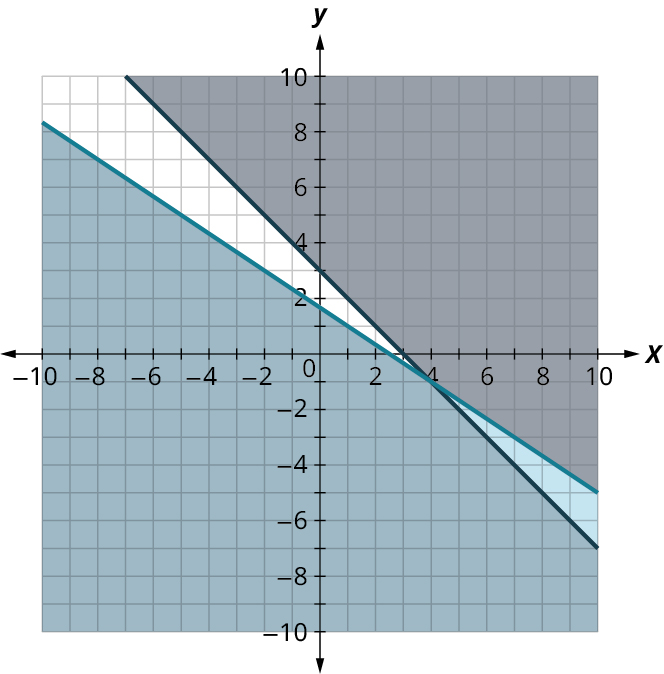
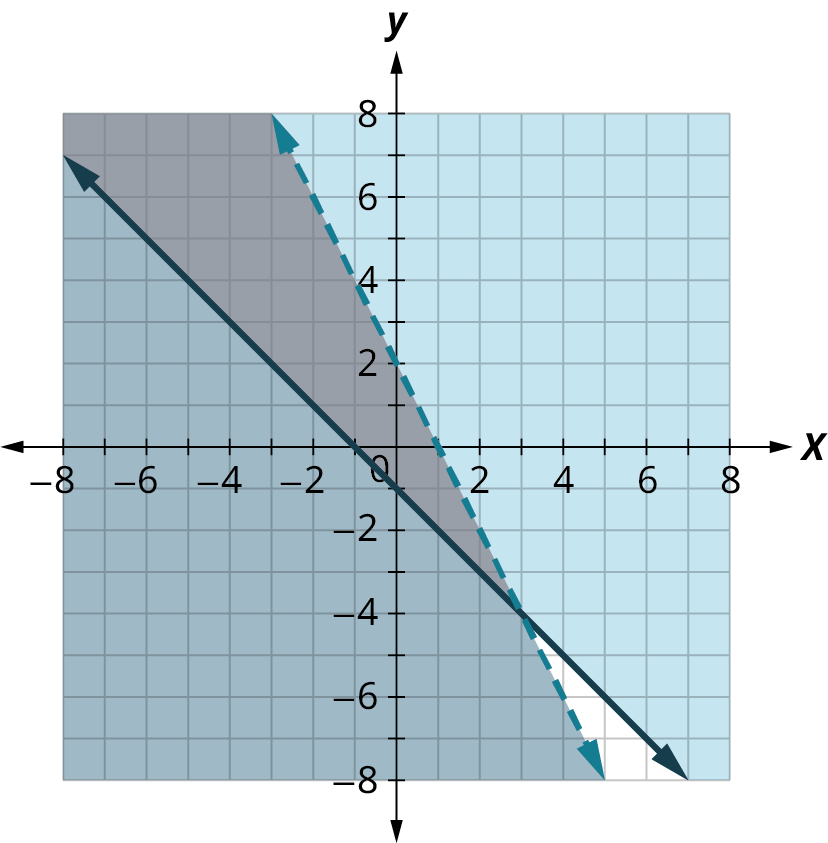
Solve the system by graphing:
- Answer
Graph
Figure 5.104Graph
Figure 5.105No shared point exists in both shaded regions, so the system has no solution.
Your Turn 5.93
/**/\left\{ {\begin{array}{*{20}{l}} {3x - 2y \geq 12} \\ {y \geq \frac{3}{2}x + 1} \end{array}} \right./**/
Some systems of linear inequalities where the boundary lines are parallel will have a solution. We will see this in the next example.
Example 5.94
Graphing Parallel Boundary Lines with a Solution
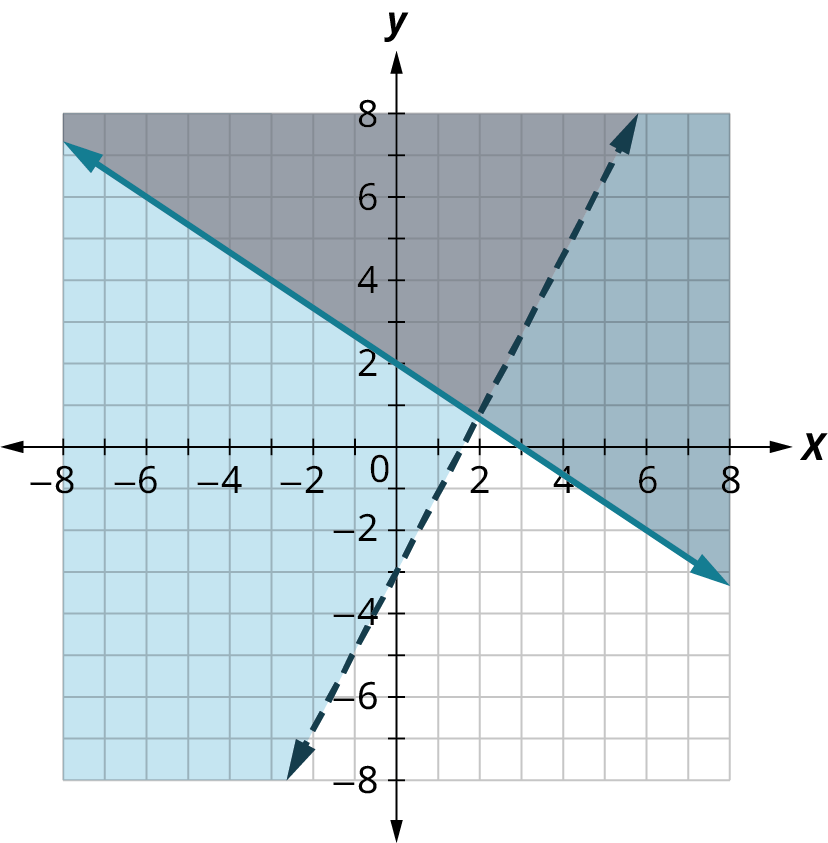
Solve the system by graphing:
- Answer
Graph
Figure 5.106Graph
Figure 5.107No point on the boundary lines is included in the solution as both lines are dashed. The solution is the region that is shaded twice which is also the solution to .
Your Turn 5.94
/**/\left\{ \begin{array}{l} y \geq 3x + 1 \hfill \\ - 3x + y \geq - 4 \hfill \\ \end{array} \right./**/
Interpreting and Solving Applications of Linear Inequalities
When solving applications of systems of inequalities, first translate each condition into an inequality. Then graph the system, as we did above, to see the region that contains the solutions. Many situations will be realistic only if both variables are positive, so add inequalities to the system as additional requirements.
Example 5.95
Applying Linear Inequalities to Calculating Photo Costs
A photographer sells their prints at a booth at a street fair. At the start of the day, they want to have at least 25 photos to display at their booth. Each small photo they display costs $4 and each large photo costs $10. They do not want to spend more than $200 on photos to display.
- Write a system of inequalities to model this situation.
- Graph the system.
- Could they display 10 small and 20 large photos?
- Could they display 20 large and 10 small photos?
- Answer
- Let the number of small photos and . To find the system of equations translate the information. They want to have at least 25 photos.
The number of small plus the number of large should be at least 25. $4 for each small and $10 for each large must be no more than $200 The number of small photos must be greater than or equal to 0. The number of large photos must be greater than or equal to 0. We have our system of equations.
- Let the number of small photos and . To find the system of equations translate the information. They want to have at least 25 photos.
To graph , graph as a solid line. Choose as a test point. Since it does make the inequality true, shade (bottom left) the side that include the point .
The solution of the system is the region of Figure 5.108 that is shaded the darkest. The boundary line sections that border the darkly shaded section are included in the solution as are the points on the -axis from to .
Your Turn 5.95
Video
Check Your Understanding


Section 5.10 Exercises
A: /**/(3, –3)/**/
B: /**/(7, 1)/**/
A: /**/(-4, -1)/**/
B: /**/(8, 3)/**/
A: /**/(5, –2)/**/
B: /**/(–1, 3)/**/
A: /**/(6, -4)/**/
B: /**/(3, 0)/**/
A: /**/(1, –3)/**/
B: /**/(-4, 4)/**/
A: /**/(2, 3)/**/
B: /**/(7, -1)/**/
A: /**/(0, 0)/**/
B: /**/(6, –8)/**/
A: /**/(0, 0)/**/
B: /**/(2, –4)/**/
A: /**/(0, 0)/**/
B: /**/(2, 2)/**/
A: /**/(0, 0)/**/
B: /**/(2, 3)/**/
A: /**/(0, 0)/**/
B: /**/(6, 0)/**/
A: /**/(0, 0)/**/
B: /**/(6, 2)/**/
A: /**/(0, 0)/**/
B: /**/(2, 2)/**/
A gardener does not want to spend more than $50 on bags of fertilizer and peat moss for their garden. Fertilizer costs $2 a bag and peat moss costs $5 a bag. The gardener’s van can hold at most 20 bags.
A student is studying for their final exams in chemistry and algebra. They only have 24 hours to study, and it will take them at least 3 times as long to study for algebra than chemistry.
Mara is attempting to build muscle mass. To do this, she needs to eat an additional 80 grams of protein or more in a day. A bottle of protein water costs $3.20 and a protein bar costs $1.75. The protein water supplies 27 grams of protein and the bar supplies 16 grams. Let /**/w/**/ be the number of water bottles Mara can buy, and let /**/b/**/ be the number of protein bars she can buy. If Mara has $10 dollars to spend:
Mark is increasing his exercise routine by running and walking at least 4 miles each day. His goal is to burn a minimum of 1,500 calories from this exercise. Walking burns 270 calories/mile and running burns 650 calories/mile.
Tension needs to eat at least an extra 1,000 calories a day to prepare for running a marathon. He has only $25 to spend on the extra food he needs and will spend it on $0.75 donuts, which have 360 calories each, and $2 energy drinks, which have 110 calories.