
19.2.3: Amplitude and Period


- Last updated
- May 4, 2022
- Save as PDF

( \newcommand{\kernel}{\mathrm{null}\,}\)
- Understand amplitude and period.
- Graph the sine function with changes in amplitude and period.
- Graph the cosine function with changes in amplitude and period.
- Match a sine or cosine function to its graph and vice versa.
Introduction
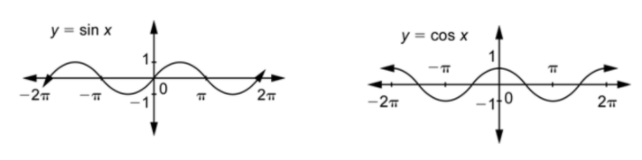
You know how to graph the functions
Periodic Functions
We used the variable
You know that the graphs of the sine and cosine functions have a pattern of hills and valleys that repeat. The length of this repeating pattern is
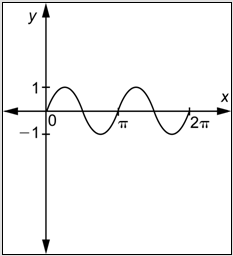
The graph below shows four repetitions of a pattern of length
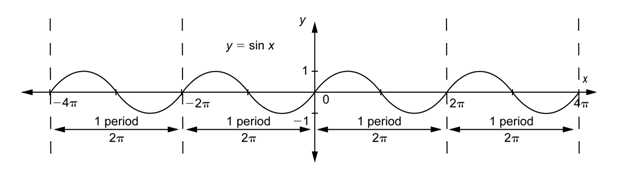
If a function has a repeating pattern like sine or cosine, it is called a periodic function. The period is the length of the smallest interval that contains exactly one copy of the repeating pattern. So the period of
You know from graphing quadratic functions of the form
for this function.
| 0 | 0 | 0 |
| 1 | ||
| 0 | ||
| -1 | ||
| 0 |
As the values of
Notice that
What is the smallest positive value for
- Answer
-
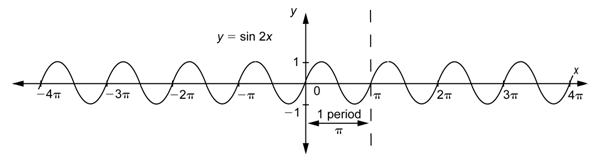
What is the period of the function
| 0 | 0 | 0 |
| 1 | ||
| 0 | ||
| -1 | ||
| 0 |
As the values of

Notice that
What is the period of the function
| 0 | 0 | 0 |
| 1 | ||
| 0 | ||
| -1 | ||
| 0 |
As the values of
We can see from the graph that
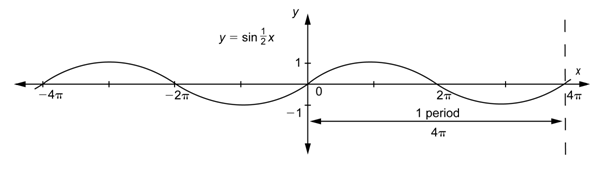
Notice that
Let’s put these results into a table. For the first three functions, we have rewritten their periods with the numerator
| Function | Period |
|---|---|
In each case, the period could be found by dividing
The period of
You can think of the different values of
There is another way to describe this effect. In the interval [0,
Problem: What are the periods of
Answer
For
For
The period of
Amplitude
As you have seen, the graphs of all of these sine and cosine functions alternate between hills and valleys. The height of one hill (which equals the depth of one valley) is called the amplitude. You can see that for all the graphs we have looked at so far, the amplitude equals 1.
The formal way to say this for any periodic function is:
You know that the maximum value of
This result agrees with what was observed from the graph.
You have seen that changing the value of
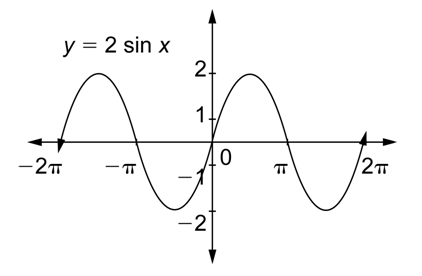
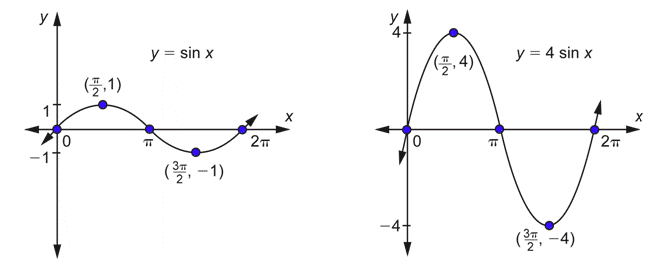
Let’s look at a different kind of change to a function by graphing the function
| 0 | 0 | 0 |
| 1 | ||
| 1 | 2 | |
| 1 | ||
| 0 | 0 |
We’ll take the first and third columns to make part of the graph and then extend that pattern to the left and to the right.
Now you can use this graph in the following example.
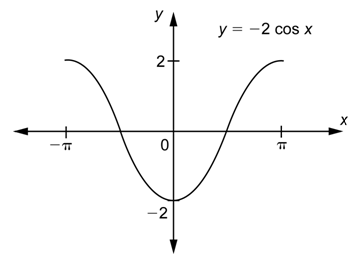
Problem: What is the amplitude of
Answer
You can find the maximum and minimum values of the function from the graph. For example, at
Use the definition of amplitude.
Notice that the height of each hill is 2, and the depth of each valley is 2. This is equal to the amplitude, as we mentioned at the start.
Notice also that the amplitude is equal to the coefficient of the function:
This is not a coincidence.
The amplitude is 2.
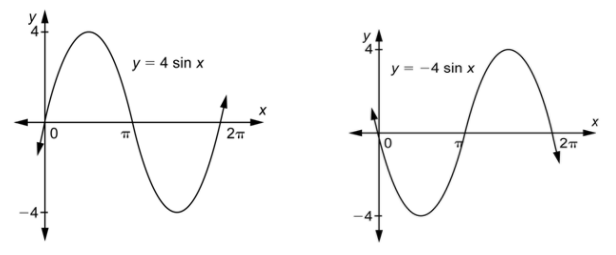
Let’s compare the graph of this function to the graph of the sine function.
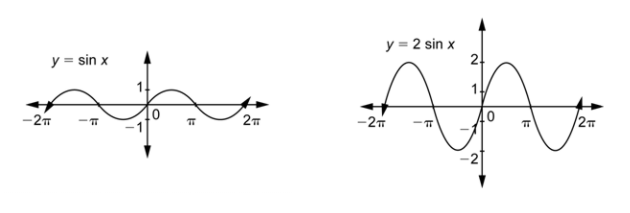
The effect of multiplying
The amplitude of
As the last example,
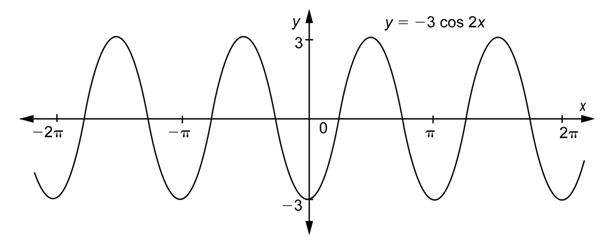
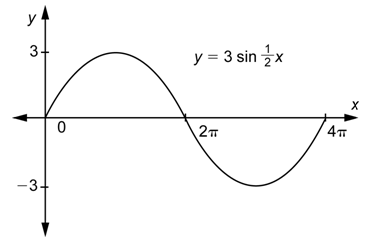
Problem: Determine the amplitude and period of
Answer
Use the formula for amplitude, with
Use the formula for period, with
The amplitude is 3 and the period is
In this example, you could have found the period by looking at the graph above. One complete cycle is shown, for example, on the interval [0,
In the functions
The amplitude of
The period of
Supplemental Interactive Activity
To help you understand changes in amplitude and period for both the sine function and cosine function, try the following interactive exercise.
*Insert Interactive Activity
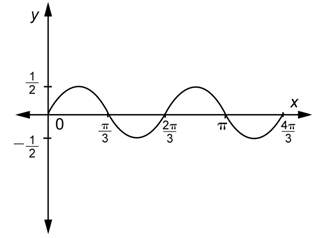
What are the amplitude and period of
- The amplitude is
- The amplitude is
- The amplitude is 1, and the period is
- The amplitude is 1, and the period is
- Answer
-
- Correct. In this function,
- Incorrect. The amplitude is correct, but the period is not. You probably multiplied
- Incorrect. The period is correct, but the amplitude is not. You may have thought the amplitude is the maximum minus the minimum, but it is half of this. The correct answer is A.
- Incorrect. You may have thought the amplitude is the maximum minus the minimum, but it is half of this. You probably multiplied
- Correct. In this function,
Graphs of Sine Functions
You know the function
For example, suppose you wanted the graph of
Note that the points that were on the
Problem: Graph
Answer
The value of
The value of
Though the amplitude and the period are the same as the function
If you want to check these graphs with a graphing calculator, make sure that the graphing window has the correct settings. For this last example, you would use
If the values of
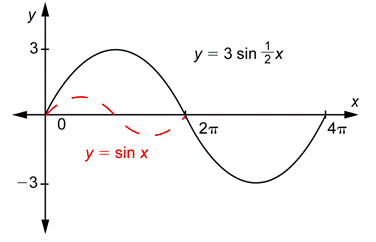
Problem: Graph
Answer
The value of
The value of
To make the graph of
Sometimes you need to stretch the graph of the sine function, and sometimes you need to shrink it.
Problem: Graph two cycles of a sine function whose amplitude is
Answer
There are different functions of the form
Because the amplitude is
The period is
To make the graph, you must combine the two effects described above.
Even without knowing the specific value of a constant, you can sometimes still narrow down the possibilities for the shape of a graph.
The graph of a function
- Answer
-
- Incorrect. This has the correct shape and period, but it is in the wrong position. Regardless of the value of
- Incorrect. This is the graph of a cosine function. Regardless of the value of
- Incorrect. Because the coefficient of
- Correct. Because the coefficient of
- Incorrect. This has the correct shape and period, but it is in the wrong position. Regardless of the value of
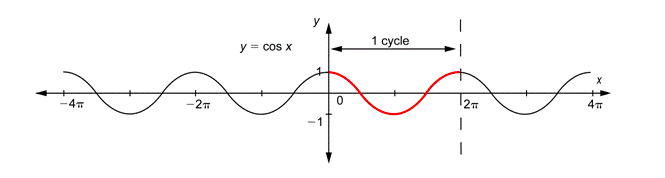
Graphs of Cosine Functions
You know the function
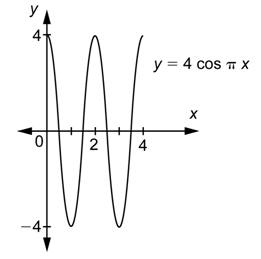
For example, suppose you wanted the graph of
Since this is twice the period of
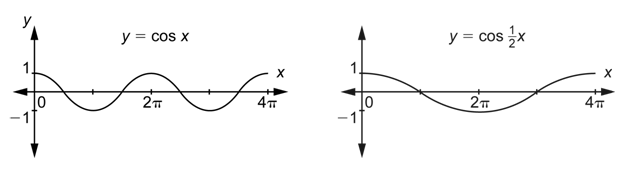
Note that in the interval [0,
If you are using a graphing calculator, you need to adjust the settings for each graph to get a graphing window that shows all the features of the graph. For the last example, you would use
Problem: Graph
Answer
The amplitude equals
The value of
When the only change is a vertical stretch, compression, or flip, the
Again, if the values of
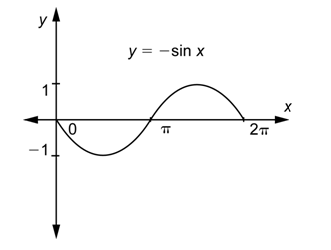
Problem: Graph
Answer
The value of
The value of
Note the effect on the
To make the graph of
In two previous examples (
One last hint: besides trying to figure out the overall effect of the value of
Which of the following options is the graph of
- Answer
-
- Incorrect. This is the graph of
- Incorrect. You confused the effects of
- Correct. The value of
- Incorrect. This graph has the correct period and amplitude. However, you have confused the effect of a minus sign on the inside with a minus sign on the outside. The correct answer is C.
- Incorrect. This is the graph of
Matching Graphs and Functions
Given any function of the form
Given a graph of a sine or cosine function, you also can determine the amplitude and period of the function. From this information, you can find values of
Remember that along with finding the amplitude and period, it’s a good idea to look at what is happening at
This tells you that the graph of
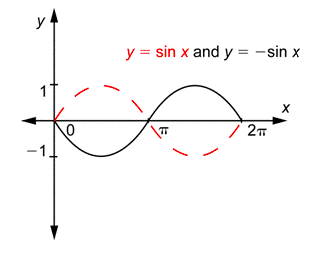
You need to be careful about the sign of
You will need to compare the graph to that of
Here are some examples of this process.
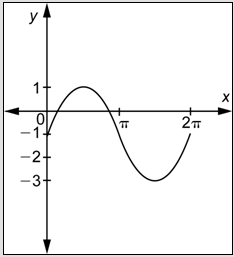
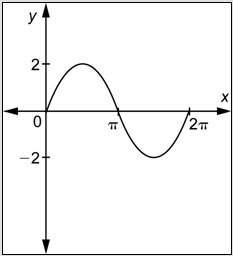
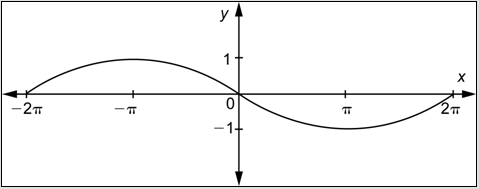
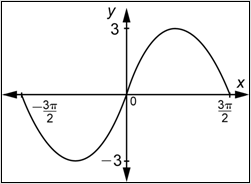
Problem: Determine a function of the form
Answer
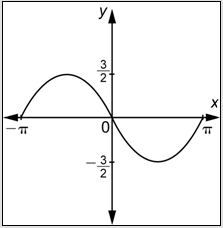
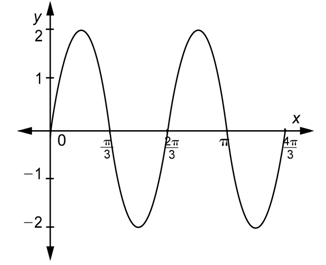
First, observe that the graph passes through the origin, so you are looking for a function of the form
Next, observe that the maximum value of the function is 2 and the minimum is -2, so the amplitude is 2. The graph has the same “orientation” as
Finally, observe that the graph shows two cycles and that one entire cycle is contained in the interval
Combine these three pieces of information.
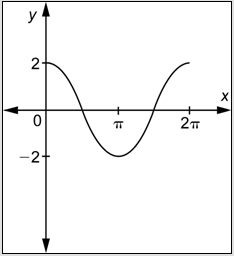
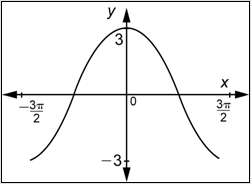
Problem: Determine a function of the form
Answer
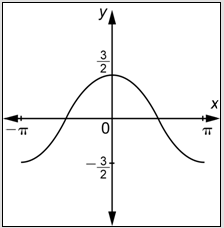
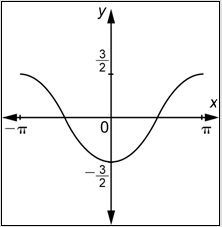
First, observe that the graph does not pass through the origin, but rather crests, reaching a maximum when
Next, observe that the maximum value of the function is
Finally, observe that the graph shows two cycles and that one entire cycle is contained in the interval [0,
Combine these three pieces of information.
Make sure that you recognize where a cycle starts and ends. The period is the length of the interval over which one cycle runs.
Problem: Which of the following functions is represented by the graph below?
- Answer
-
Remember that when writing a function you can use the notation
Which of the following graphs represents
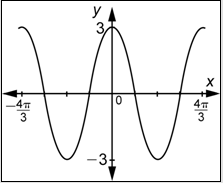
- Answer
-
- Incorrect. This is the graph of a function of the form
- Correct. First, this graph has the shape of a cosine function. Second, because
- Incorrect. This graph does have the shape of a cosine function, and the amplitude is 3, which is correct. However, the period is incorrect. You probably multiplied
- Incorrect. This graph does have the shape of a cosine function. However, in determining the graph, it appears that you switched the values of
- Incorrect. This is the graph of a function of the form
Summary
The functions
You can use this information to graph any of these functions by starting with the basic graph of
You can also start with a graph, determine the values of