
3.5: Comparing Apples to Apples


- Last updated
- May 15, 2024
- Save as PDF

( \newcommand{\kernel}{\mathrm{null}\,}\)
INTRODUCTION
In this collaboration, you will take a critical look at pictographs, which are a type of data display that uses a picture of an object instead of a bar to represent a quantity. When we see an object on paper it is hard to know how each person will think about the object. Below are two illustrations of a basketball. Have each person in your group describe what they see in the pictures and compare the sizes.

Did anyone in your group talk about the diameter (or height) of the balls? If so, how do the sizes compare? Did anyone in your group talk about the area or how much of the paper is covered by each ball? If so, how do the sizes compare? How many little balls do you think you need to cover the big ball? Did anyone in your group talk about how it would be to hold the two balls, and how the sizes would compare?
It is hard to know what will come to mind for each person who views the pictures. And, it turns out that each of these ways of viewing the object will give a different impression of the “size” of the objects, which can lead to misunderstanding or confusion when we compare pictures of objects of different sizes.
SPECIFIC OBJECTIVES
By the end of this collaboration, you should understand that
- pictographs can be misleading because areas and heights of figures do not increase proportionally.
By the end of this collaboration, you should be able to
- solve dimensional analysis scenarios involving multiple conversion factors.
- analyze misrepresentations in graphs related to area and volume.
- evaluate formulas and use the results to make a decision.
PROBLEM SITUATION: ANALYZING DATA ON APPLE JUICE IMPORTS
In the United States, in recent years, there has been an increase in consumption of apple juice from foreign countries. Since imported apple juice is also potentially cheaper, and therefore available to a larger percentage of the population, importing it can be seen as a positive thing. However, importing food from other countries also causes some concerns. These include a loss of control over the quality of imported food, an increased reliance on food from other countries, and a reduction in business for U.S. farmers. You will examine some of these issues below.
(1) The following graph is similar to ones commonly used in media reports. It is called a pictograph because it uses pictures (instead of bars) to represent quantitative changes. This pictograph was created to show the changes in apple juice imports over the 20-year time period from 2001 to 2021.15
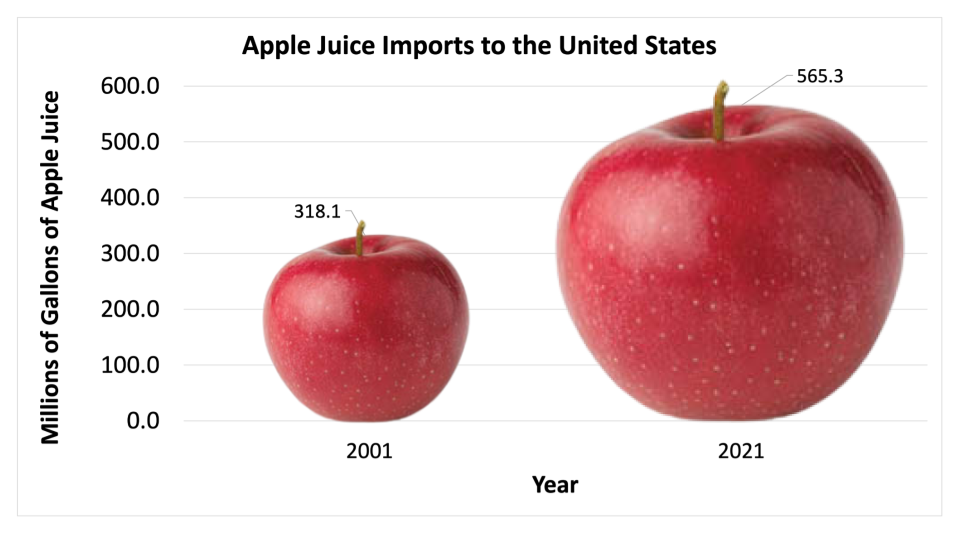
(a) Based on the graph, would you say that apple juice imports grew a little, some, or a lot over this time period? Can you quantify? What are you looking at when you make this comparison?
(b) People who study how to make visual displays of data (like graphs) are called data scientists. Data scientists urge caution when constructing pictographs because if they are not carefully constructed, they can be misleading. For example, in the graph above it is unclear if you should compare the height of the apples, the area of the apples, or the volume of the apples.
To better understand how different interpretations of the data (in this instance the apple’s height, area, and volume) can significantly impact one’s understanding of the change in apple juice imports between 2001 and 2021, fill in the table below.
Assume the area of an apple is approximately the area of a circle and the volume of an apple is approximately the volume of a sphere. The area of a circle is given by the equation A = πr2 and the volume of a sphere is given by V =
- 2001 (small apple) has a height of 32mm
- 2021 (big apple) has a height of 55mm
Work in your group to complete the table. When necessary, round figures to one decimal place.
|
Height of Apple |
Approximate Area of Apple Graphic |
Approximate Volume of Apple Graphic |
|
|
2001 Little Apple |
32mm |
(ii) |
(v) |
|
2021 Big Apple |
55mm |
(iii) |
(vi) |
|
Relative change (in percent) |
(i) |
(iv) |
(vii) |
(c) What percentage did apple juice imports increase by between 2001 and 2021? Round to one decimal place.
(d) Using your answer for part (c), which interpretation of the pictograph (height, area, or volume) most accurately represents the actual change in apple juice imports over this 20-year period? Explain.
(e) How could you make a graph that would portray the data more accurately?
(2) An American company has been criticized for using imported apple juice. The company’s public relations department is asked to prepare a statement defending the use of imports. You find the following information:
- The New York Times reported, “China’s advantage is its cheap labor. A picker makes about 28 cents an hour, or $2 a day, according to the U.S. Apple Association. At that time, workers in Pennsylvania made about $9 to $10 per hour, and those in Washington State about $14 per hour.”16
- It takes about 36 apples to create one gallon of juice.
- One bushel of apples contains about 126 medium apples.
- An experienced apple picker can harvest about 12.5 bushels of apples per hour.
As members of this department, you are asked to calculate how much it costs to pick enough apples to make one gallon of apple juice in China and in the United States.
(3) Select one of the two prompts below. Write a paragraph presenting your argument and supporting it with specific quantitative information.
- (a) Use the information in Question 1 to make the argument that the United States is importing too much apple juice. Include your reasons explaining why this is a problem.
- (b) Use the information in Question 2 to make the argument that it is good that the United States is importing apple juice. Include your reasons explaining how this benefits the country.
FURTHER APPLICATIONS
(4) Total U.S. apple juice consumption for the year 2001 was 505.6 million gallons, and for the year 2021 it was 656.1 million gallons.17 Use this information and the data from this lesson to create a new graph of the import data, by changing the vertical axis to “percentage of total apple juice consumption.” Because pictographs can be eye-catching and can make the data memorable, you can use a pictograph in your graph, but choose one that preserves the integrity of the data.
MAKING CONNECTIONS
Record the important mathematical ideas from the discussion.
___________________________________
16 www.nytimes.com/2007/06/25/business/worldbusiness/25iht-apples.1.6312540.html