
3.5.2: Exercise 3.5


- Last updated
- May 15, 2024
- Save as PDF

( \newcommand{\kernel}{\mathrm{null}\,}\)
MAKING CONNECTIONS TO THE COLLABORATION
(1) Which of the following was one of the main mathematical ideas of the collaboration?
(i) Pictographs are a type of graph in which pictures are used to represent quantities.
(ii) Units are important in dimensional analysis, but do not matter in using formulas except when giving the answer to a problem.
(iii) Units are important in many mathematical skills including graphs, dimensional analysis, and formulas.
(iv) Imports of apple juice have increased due to the high cost of labor in the United States.
DEVELOPING SKILLS AND UNDERSTANDING
(2) Over the last decade, the use of bottled water has increased dramatically in the United States and around the world. In 2010, the annual U.S. consumption of bottled water was 28.3 gallons per capita. In 2020, this had increased to 45.2 gallons.18 The graphic below is designed to illustrate this increase.
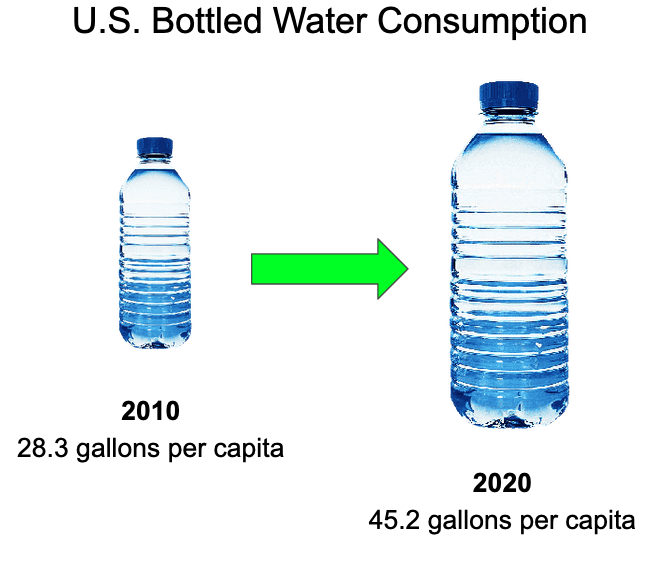
The table below gives the dimensions of the figures. Complete the table as instructed.
(a) Approximate the area of each figure. The bottles shown are similar in shape to rectangles. So, to compare the areas of the figures, think of the rectangle that contains the figure with the given dimensions and calculate the area of that rectangle.
(b) The figures give the illusion of three dimensions. Using the given dimensions, calculate the volume of the cylinder represented by each figure to the nearest tenth. (Use an Internet search or reliable source to look up the formula, if needed.)
(c) Calculate the relative change from the small bottle to the large bottle. Round to the nearest whole percent.
|
Actual data |
Height |
Width |
Area of rectangle |
Volume of cylinder |
|
|
Small bottle |
28.3 gallons/ capita |
4.0 cm |
1.3 cm |
(a)(i) |
(b)(i) |
|
Large bottle |
45.2 gallons/ capita |
6.5 cm |
2.2 cm |
(a)(ii) |
(b)(ii) |
|
Relative change (in percent) |
(c)(i) |
(c)(ii) |
(c)(iii) |
(c)(iv) |
(c)(v) |
(d) Which of the following aspects of the graphic are accurate depictions of the date? There may be more than one correct answer.
(i) Area
(ii) Volume
(iii) Height
(iv) Width
(e) Overall, is the graph accurate or misleading? Explain.
(3) In addition to paying attention to distortions of data, data scientists also rely on artistic ideas to design visually appealing graphs. One theory they rely on is the golden ratio for rectangles. The ratio is given by the formula
g=lw
where l is the length of the longest side of the rectangle and w is the length of the shortest side of the rectangle. When g is close to 1.6, the rectangle is thought to be visually appealing.19
Identify if each item listed below has dimensions that match the golden ratio. You will have to look up the dimensions of some of the items.
Write the exact ratio. Then write if it is “close” or “not close” to the golden ratio.
(a) Small water bottle graphic from Question 2
(i) Ratio:________ (ii) Does this match the golden ratio?__________________
(b) Large water bottle graphic from Question 2
(i) Ratio:________ (ii) Does this match the golden ratio?__________________
(c) Credit card
(i) Ratio:________ (ii) Does this match the golden ratio?__________________
(d) Football field
(i) Ratio:________ (ii) Does this match the golden ratio?__________________
MAKING CONNECTIONS ACROSS THE COURSE
(4) The total U.S. apple juice consumption for the marketing years 2001 and 2021 was 505.6 million gallons and 656.1 million gallons, respectively. Calculate the average consumption of apple juice in fluid ounces per capita per week for 2001 and 2021. Use the following U.S. population figures: 284.97 million people in 2001 and 331.89 million people in 2021. Round answers to the nearest hundredth.
(a) In 2001:
(b) In 2021:
When comparing quantities that change over time, you usually compute the difference in values according to:
New value – Old value
If the average price of a gallon of gasoline in 2020 was $2.19 and the average price in 2022 was $3.98, one might compare these two prices by computing $3.98 – $2.19 = $1.79. Since this number is positive, you can say that the average price of gasoline has increased $1.79 in two years, which is an annual change of 89.5 cents ($1.79 divided by two years).
If the average price for a loaf of bread was $3.90 in 2020 and $3.50 in 2022, then the change in this basic item of food would be –$0.40. The negative sign tells us that the price of bread has decreased over this two-year period.
(5) How much did the average price of a loaf of bread decrease by per year?
(6) The total change in the price of a basic Mac Mini from 2018 to 2023 was –$200.20
(a) The price in 2018 was $799. What was the price in 2023?
(b) Write a sentence describing the average annual change in the price of a Mac Mini during this period.
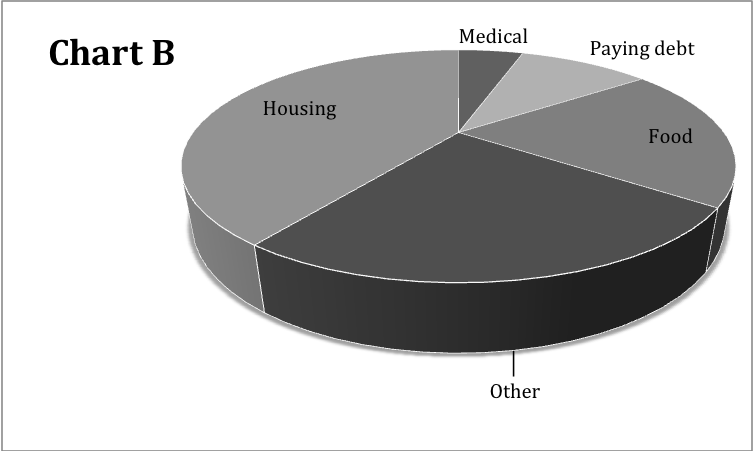
(7) The following pie charts represent how a typical household budget might be broken into categories.
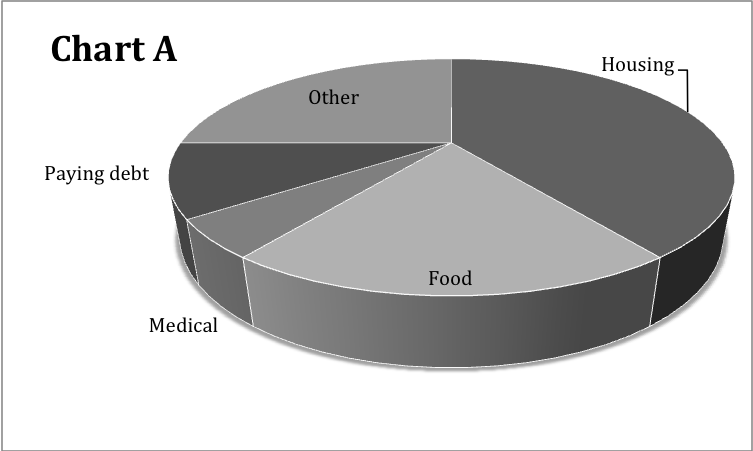
(a) For Chart A, which of the following statements best describes the comparison of the categories “Food” and “Other?”
(i) “Food” is a smaller percentage than “Other.”
(ii) “Food” is a greater percentage than “Other.”
(iii) “Food” is about the same percentage as “Other”.
(b) For Chart B, which of the following statements best describes the comparison of the categories “Food” and “Other?”
(i) “Food” is a smaller percentage than “Other.”
(ii) “Food” is a greater percentage than “Other.”
(iii) “Food” is about the same percentage as “Other.”
(c) The two charts are actually created from the same data (shown below). Do they both accurately represent these data? Why or why not?
|
Housing |
40% |
|
Food |
20% |
|
Medical |
5% |
|
Paying debt |
10% |
|
Other |
25% |
_______________________________________________