
4.7E: Fitting Exponential Models to Data (Exercises)


- Last updated
- Jan 2, 2021
- Save as PDF

( \newcommand{\kernel}{\mathrm{null}\,}\)
section 4.7 exercise
Graph each function on a semi-log scale, then find a formula for the linearized function in the form log(f(x))=mx+b.
1. f(x)=4(1.3)x
2. f(x)=2(1.5)x
3. f(x)=10(0.2)x
4. f(x)=30(0.7)x
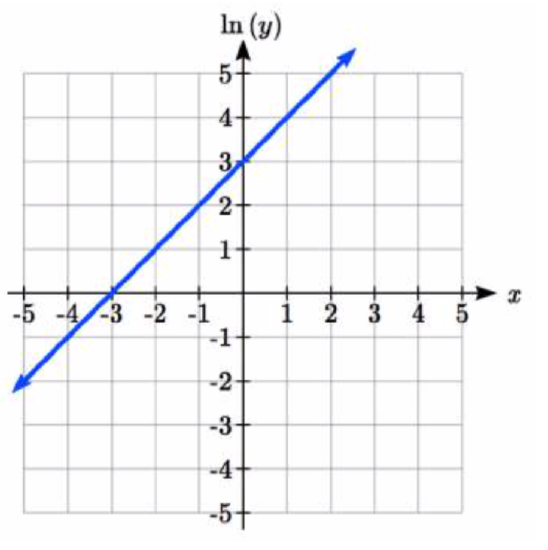
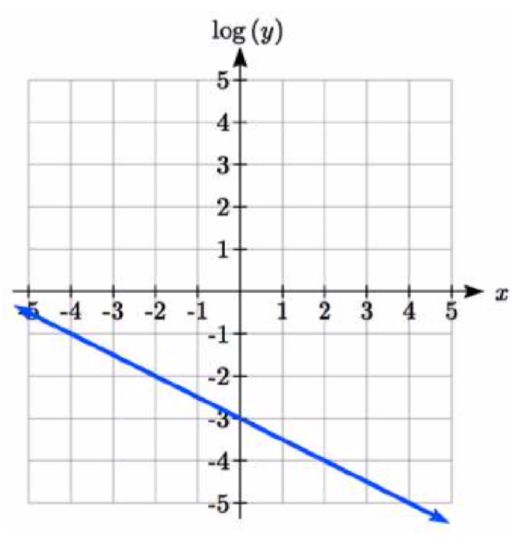
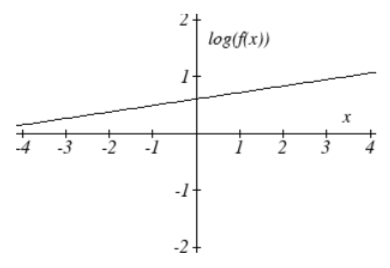
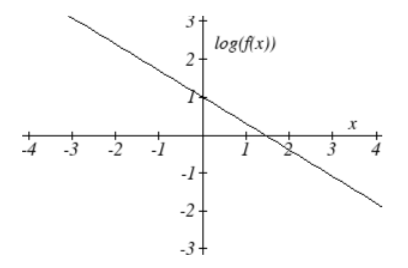
The graph below is on a semi-log scale, as indicated. Find a formula for the exponential function y(x).
5. 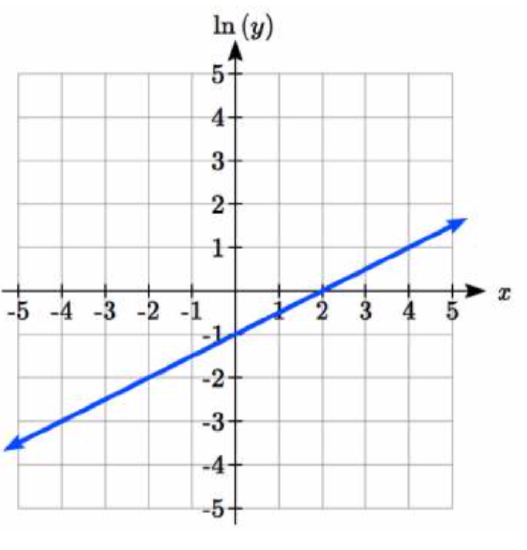 6.
6.
7. 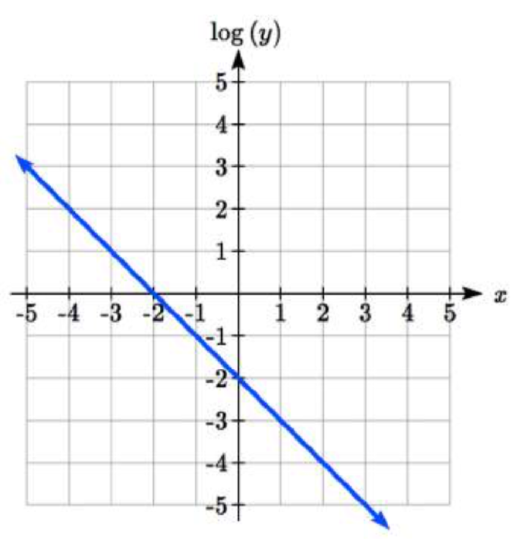 8.
8. 
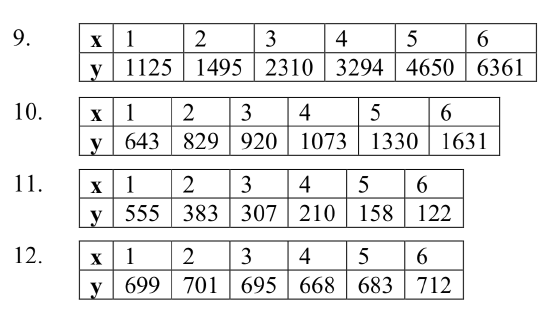
Use regression to find an exponential function that best fits the data given.
13. Total expenditures (in billions of dollars) in the US for nursing home care are shown below. Use regression to find an exponential function that models the data. What does the model predict expenditures will be in 2015?
| Year | 1990 | 1995 | 2000 | 2003 | 2005 | 2008 |
| Expenditure | 53 | 74 | 95 | 110 | 121 | 138 |
14. Light intensity as it passes through water decreases exponentially with depth. The data below shows the light intensity (in lumens) at various depths. Use regression to find an function that models the data. What does the model predict the intensity will be at 25 feet?
| Depth (ft) | 3 | 6 | 9 | 12 | 15 | 18 |
| Lumen | 11.5 | 8.6 | 6.7 | 5.2 | 3.8 | 2.9 |
15. The average price of electricity (in cents per kilowatt hour) from 1990 through 2008 is given below. Determine if a linear or exponential model better fits the data, and use the better model to predict the price of electricity in 2014.
| Year | 1986 | 1988 | 1990 | 1995 | 1997 | 2000 | 2002 | 2004 | 2006 | 2008 |
| Cost | 7.83 | 8.21 | 8.38 | 8.36 | 8.26 | 8.24 | 8.44 | 8.95 | 10.40 | 11.26 |
16. The average cost of a loaf of white bread from 1986 through 2008 is given below. Determine if a linear or exponential model better fits the data, and use the better model to predict the price of a loaf of bread in 2016.
| Year | 1986 | 1988 | 1990 | 1995 | 1997 | 2000 | 2002 | 2004 | 2006 | 2008 |
| Cost | 0.57 | 0.66 | 0.70 | 0.84 | 0.88 | 0.99 | 1.03 | 0.97 | 1.14 | 1.42 |
- Answer
-
1. log(f(x))=log(1.3)x+log(4)
3. log(f(x))=log(0.2)x+1
5. y=e12x−1=e−1e12x≈0.368(1.6487)x
7. y=10−x−2.=10−210−1x=0.01(0.1)x
9. y=776.682(1.426)x
11. y=731.92(0.738)x
13. Expenditures are approximately $205
15. y=7.599(1.016)x r=0.83064, y=0,1493x+7.4893, r=0.81713. Using the better function, we predict electricity will be 11.157 cents per kwh