
7.0: Transformations of Graphs
- Page ID
- 112436

\( \newcommand{\vecs}[1]{\overset { \scriptstyle \rightharpoonup} {\mathbf{#1}} } \)
\( \newcommand{\vecd}[1]{\overset{-\!-\!\rightharpoonup}{\vphantom{a}\smash {#1}}} \)
\( \newcommand{\dsum}{\displaystyle\sum\limits} \)
\( \newcommand{\dint}{\displaystyle\int\limits} \)
\( \newcommand{\dlim}{\displaystyle\lim\limits} \)
\( \newcommand{\id}{\mathrm{id}}\) \( \newcommand{\Span}{\mathrm{span}}\)
( \newcommand{\kernel}{\mathrm{null}\,}\) \( \newcommand{\range}{\mathrm{range}\,}\)
\( \newcommand{\RealPart}{\mathrm{Re}}\) \( \newcommand{\ImaginaryPart}{\mathrm{Im}}\)
\( \newcommand{\Argument}{\mathrm{Arg}}\) \( \newcommand{\norm}[1]{\| #1 \|}\)
\( \newcommand{\inner}[2]{\langle #1, #2 \rangle}\)
\( \newcommand{\Span}{\mathrm{span}}\)
\( \newcommand{\id}{\mathrm{id}}\)
\( \newcommand{\Span}{\mathrm{span}}\)
\( \newcommand{\kernel}{\mathrm{null}\,}\)
\( \newcommand{\range}{\mathrm{range}\,}\)
\( \newcommand{\RealPart}{\mathrm{Re}}\)
\( \newcommand{\ImaginaryPart}{\mathrm{Im}}\)
\( \newcommand{\Argument}{\mathrm{Arg}}\)
\( \newcommand{\norm}[1]{\| #1 \|}\)
\( \newcommand{\inner}[2]{\langle #1, #2 \rangle}\)
\( \newcommand{\Span}{\mathrm{span}}\) \( \newcommand{\AA}{\unicode[.8,0]{x212B}}\)
\( \newcommand{\vectorA}[1]{\vec{#1}} % arrow\)
\( \newcommand{\vectorAt}[1]{\vec{\text{#1}}} % arrow\)
\( \newcommand{\vectorB}[1]{\overset { \scriptstyle \rightharpoonup} {\mathbf{#1}} } \)
\( \newcommand{\vectorC}[1]{\textbf{#1}} \)
\( \newcommand{\vectorD}[1]{\overrightarrow{#1}} \)
\( \newcommand{\vectorDt}[1]{\overrightarrow{\text{#1}}} \)
\( \newcommand{\vectE}[1]{\overset{-\!-\!\rightharpoonup}{\vphantom{a}\smash{\mathbf {#1}}}} \)
\( \newcommand{\vecs}[1]{\overset { \scriptstyle \rightharpoonup} {\mathbf{#1}} } \)
\(\newcommand{\longvect}{\overrightarrow}\)
\( \newcommand{\vecd}[1]{\overset{-\!-\!\rightharpoonup}{\vphantom{a}\smash {#1}}} \)
\(\newcommand{\avec}{\mathbf a}\) \(\newcommand{\bvec}{\mathbf b}\) \(\newcommand{\cvec}{\mathbf c}\) \(\newcommand{\dvec}{\mathbf d}\) \(\newcommand{\dtil}{\widetilde{\mathbf d}}\) \(\newcommand{\evec}{\mathbf e}\) \(\newcommand{\fvec}{\mathbf f}\) \(\newcommand{\nvec}{\mathbf n}\) \(\newcommand{\pvec}{\mathbf p}\) \(\newcommand{\qvec}{\mathbf q}\) \(\newcommand{\svec}{\mathbf s}\) \(\newcommand{\tvec}{\mathbf t}\) \(\newcommand{\uvec}{\mathbf u}\) \(\newcommand{\vvec}{\mathbf v}\) \(\newcommand{\wvec}{\mathbf w}\) \(\newcommand{\xvec}{\mathbf x}\) \(\newcommand{\yvec}{\mathbf y}\) \(\newcommand{\zvec}{\mathbf z}\) \(\newcommand{\rvec}{\mathbf r}\) \(\newcommand{\mvec}{\mathbf m}\) \(\newcommand{\zerovec}{\mathbf 0}\) \(\newcommand{\onevec}{\mathbf 1}\) \(\newcommand{\real}{\mathbb R}\) \(\newcommand{\twovec}[2]{\left[\begin{array}{r}#1 \\ #2 \end{array}\right]}\) \(\newcommand{\ctwovec}[2]{\left[\begin{array}{c}#1 \\ #2 \end{array}\right]}\) \(\newcommand{\threevec}[3]{\left[\begin{array}{r}#1 \\ #2 \\ #3 \end{array}\right]}\) \(\newcommand{\cthreevec}[3]{\left[\begin{array}{c}#1 \\ #2 \\ #3 \end{array}\right]}\) \(\newcommand{\fourvec}[4]{\left[\begin{array}{r}#1 \\ #2 \\ #3 \\ #4 \end{array}\right]}\) \(\newcommand{\cfourvec}[4]{\left[\begin{array}{c}#1 \\ #2 \\ #3 \\ #4 \end{array}\right]}\) \(\newcommand{\fivevec}[5]{\left[\begin{array}{r}#1 \\ #2 \\ #3 \\ #4 \\ #5 \\ \end{array}\right]}\) \(\newcommand{\cfivevec}[5]{\left[\begin{array}{c}#1 \\ #2 \\ #3 \\ #4 \\ #5 \\ \end{array}\right]}\) \(\newcommand{\mattwo}[4]{\left[\begin{array}{rr}#1 \amp #2 \\ #3 \amp #4 \\ \end{array}\right]}\) \(\newcommand{\laspan}[1]{\text{Span}\{#1\}}\) \(\newcommand{\bcal}{\cal B}\) \(\newcommand{\ccal}{\cal C}\) \(\newcommand{\scal}{\cal S}\) \(\newcommand{\wcal}{\cal W}\) \(\newcommand{\ecal}{\cal E}\) \(\newcommand{\coords}[2]{\left\{#1\right\}_{#2}}\) \(\newcommand{\gray}[1]{\color{gray}{#1}}\) \(\newcommand{\lgray}[1]{\color{lightgray}{#1}}\) \(\newcommand{\rank}{\operatorname{rank}}\) \(\newcommand{\row}{\text{Row}}\) \(\newcommand{\col}{\text{Col}}\) \(\renewcommand{\row}{\text{Row}}\) \(\newcommand{\nul}{\text{Nul}}\) \(\newcommand{\var}{\text{Var}}\) \(\newcommand{\corr}{\text{corr}}\) \(\newcommand{\len}[1]{\left|#1\right|}\) \(\newcommand{\bbar}{\overline{\bvec}}\) \(\newcommand{\bhat}{\widehat{\bvec}}\) \(\newcommand{\bperp}{\bvec^\perp}\) \(\newcommand{\xhat}{\widehat{\xvec}}\) \(\newcommand{\vhat}{\widehat{\vvec}}\) \(\newcommand{\uhat}{\widehat{\uvec}}\) \(\newcommand{\what}{\widehat{\wvec}}\) \(\newcommand{\Sighat}{\widehat{\Sigma}}\) \(\newcommand{\lt}{<}\) \(\newcommand{\gt}{>}\) \(\newcommand{\amp}{&}\) \(\definecolor{fillinmathshade}{gray}{0.9}\)In Chapter 4 we saw that the amplitude, period, and midline of a sinusoidal graph are determined by the coefficients in its formula. The circular functions (sine and cosine of real numbers) behave the same way.
Period, Midline, and Amplitude
Changes to the amplitude, period, and midline are called transformations of the basic sine and cosine graphs.
• Changing the midline shifts the graph vertically.
• Changing the amplitude stretches or compresses the graph vertically.
• Changing the period stretches or compresses the graph horizontally.
First, we’ll consider changes in amplitude.
Compare the graphs of \(f(x) = 2 \sin x\) and \(g(x) = 0.5 \sin x\) with the graph of \(y = \sin x\).
- Answer
-
With your calculator set in radian mode, graph the three functions in the ZTrig window (press ZOOM 7). The graphs are shown below.
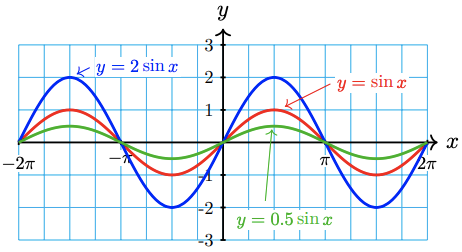
All three graphs have the same period \((2 \pi)\) and midline \((y=0)\), but the graph of \(f\) has amplitude 2, and the graph of \(g\) has amplitude 0.5.
The amplitude of \(y=A \sin t\) is given by \(|A|\), and the same is true of \(y=A \cos t\). In the next exercise, remember that the amplitude is always a nonnegative number.
Compare the graphs of \(f(x) = 3 \cos x\) and \(g(x) = -3 \cos x\) with the graph of \(y = \cos x\).
- Answer
-
Both graphs have amplityde 3. The graph of \(g(x) = -3 \cos x\) is reflected about the \(x\)-axis.
Next we'll consider changes in the period of the graph.
Compare the graphs of \(f(x)=\cos 2 x\) and \(g(x)=\cos \frac{1}{3} x\) with the graph of \(y=\cos x\).
- Answer
-
With your calculator set in radian mode, graph \(f(x)=\cos 2 x\) and \(y=\cos x\) in the same window, as shown below.
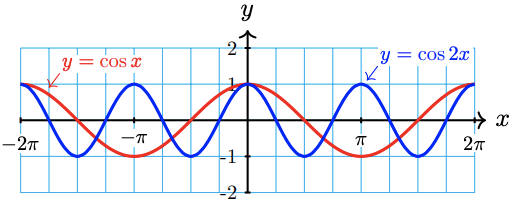
Both graphs have the same amplitude (1) and midline \((y=0)\), but the graph of \(f\) completes two cycles from 0 to \(2 \pi\) instead of one. The period of \(f(x)=\cos 2 x\) is \(\frac{2 \pi}{2}=\pi\).
Now graph \(g(x)=\cos \frac{1}{3} x\) and \(y=\cos x\) in the same window. Set Xmin = 0 and Xmax =6 \(\pi\).
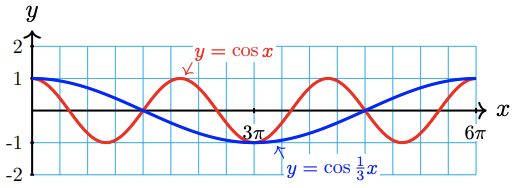
The graph of \(g(x)=\cos \dfrac{1}{3} x\) completes one cycle between 0 and \(6 \pi\). Its period is \(\dfrac{2 \pi}{\frac{1}{3}}=6 \pi\).
The period of \(y=\cos B t\) is given by \(\frac{2 \pi}{|B|}\), and the same is true of \(y=\sin B t\).
a Compare the graph of \(f(x)=\sin 3 x\) with the graph of \(y=\sin x\). Use the window \(\mathrm{X} \min =0, \mathrm{X} \max =2 \pi, \mathrm{Ymin}=-2, \mathrm{Ymax}=2\).
b Compare the graph of \(g(x)=\sin \frac{1}{4} x\) with the graph of \(y=\sin x\). Use the window \(\mathrm{X} \min =0, \mathrm{X} \max =8 \pi, \mathrm{Ymin}=-2, \mathrm{Ymax}=2\).
- Answer
-
a The graph of \(f\) completes 3 cycles from 0 to \(2 \pi\). Its period is \(\frac{2 \pi}{3}\).
b The graph of \(g\) completes one cycle from 0 to \(8 \pi\). Its period is \(8 \pi\).
Next we’ll consider changes in midline.
Compare the graph of \(f(x)=2+\sin x\) with the graph of \(y=\sin x\).
- Answer
-
Graph both functions in the ZTrig window. The graphs are shown below.
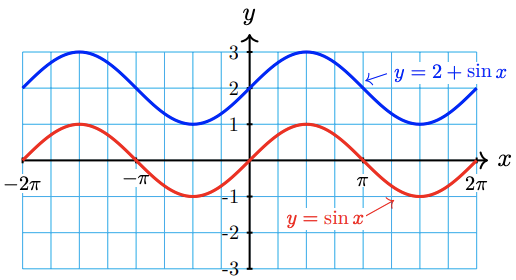
Each point on the graph of \(f(x)=2+\sin x\) has \(y\)-coordinate 2 units higher than the corresponding point on the graph of \(y=\sin x\). Thus, the graph of \(f(x)=2+\sin x\) is shifted vertically by 2 units relative to the graph of \(y=\sin x\). In particular, the midline of \(f(x)=\mathbf{2}+\sin x\) is the line \(y=\mathbf{2}\).
Compare the graph of \(g(x)=-3+\cos x\) with the graph of \(y=\cos x\).
- Answer
-
The graph of \(g\) is shifted down 3 units. Its midline is \(y=-3\).
Here is a summary of our findings.
1 The graph of
\(y=A \cos x \quad \text { or } \quad y=A \sin x\)
has amplitude \(|A|\).
2 The graph of
\(y=\cos B x \quad \text { or } \quad y=\sin B x\)
has period \(\frac{2 \pi}{B}\).
3 The graph of
\(y=k+\cos x \quad \text { or } \quad y=k+\sin x\)
has midline \(y=k\).
Graphs of Sinusoidal Functions
The values of the parameters \(A, B\), and \(k\) determine the shape of the graphs of
\(y=k+A \sin B x \quad \text { or } \quad y=k+A \cos B x\)
By adjusting the amplitude, period, and midline of the sine or cosine graph, we can sketch these sinusoidal functions.
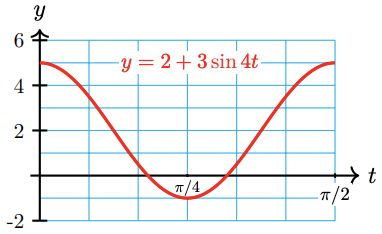
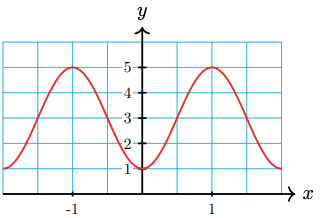
a State the amplitude, period, and midline of \(y=2+3 \cos 4 t\).
b Sketch by hand a graph of \(y=2+3 \cos 4 t\).
- Answer
-
a The amplitude of the graph is 3, its midline is \(y=2\), and its period is \(\frac{2 \pi}{4}=\frac{\pi}{2}\).
b One way to make a quick sketch of a sinusoidal graph is to use a table of values. The trick is to choose convenient values for the input variable. In the table below, notice that we choose the quadrantal angles as the input values for the trigonometric function.
\(t\) \(4t\) \(\cos 4t\) \(3 \cos 4t\) \(y = 2 + \cos 4t\) 0 1 \(\dfrac{\pi}{2}\) 0 \(\pi\) -1 \(\dfrac{3\pi}{2}\) 0 \(2\pi\) 1 Now we work backwards from \(4t\) to find the values of \(t\), and forwards from \(\cos 4t\) to find the values of \(y\).
\(t\) \(4t\) \(\cos 4t\) \(3 \cos 4t\) \(y = 2 + \cos 4t\) 0 0 1 3 5 \(\dfrac{\pi}{8}\) \(\dfrac{\pi}{2}\) 0 0 2 \(\dfrac{\pi}{4}\) \(\pi\) -1 -3 -1 \(\dfrac{3\pi}{8}\) \(\dfrac{3\pi}{2}\) 0 0 2 \(\dfrac{\pi}{2}\) \(2\pi\) 1 3 5 Notice from the table that the graph completes one cycle from \(t=0\) to \(t=\frac{\pi}{2}\), which confirms that the period is \(\frac{\pi}{2}\). Finally, we plot the points \((t, y)\) from the table, and use them as "guidepoints" to sketch a sinusoidal graph, as shown below.
a State the amplitude, period, and midline of the graph of \(y=4-2 \sin \frac{t}{3}\).
b Complete the table and sketch a graph of \(y=4-2 \sin \frac{t}{3}\).
| \(t\) | \(\dfrac{t}{3}\) | \(\sin \dfrac{t}{3}\) | \(-2 \sin \dfrac{t}{3}\) | \(y = 4 - 2\sin \dfrac{t}{3}\) |
| 0 | ||||
| \(\dfrac{\pi}{2}\) | ||||
| \(\pi\) | ||||
| \(\dfrac{3\pi}{2}\) | ||||
| \(2\pi\) |
- Answer
-
a Amplitude: 2, period: \(6\pi\), midline: \(y = 4\).
\(t\) \(\dfrac{t}{3}\) \(\sin \dfrac{t}{3}\) \(-2 \sin \dfrac{t}{3}\) \(y = 4 - 2\sin \dfrac{t}{3}\) 0 0 0 0 4 \(\dfrac{3\pi}{2}\) \(\dfrac{\pi}{2}\) 1 -2 2 \(3\pi\) \(\pi\) 0 0 4 \(\dfrac{9\pi}{2}\) \(\dfrac{3\pi}{2}\) -1 2 6 \(6\pi\) \(2\pi\) 0 0 4 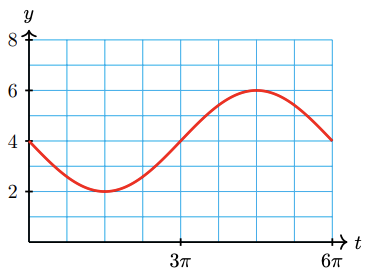
Modeling with Sinusoidal Functions
Sinusoidal functions are used to model a great variety of physical phenomena, including sound and light waves, tides and planetary orbits, and the life cycles of plants and animals. They are also often used to approximate periodic functions that are not exactly sinusoidal, such as blood pressure.
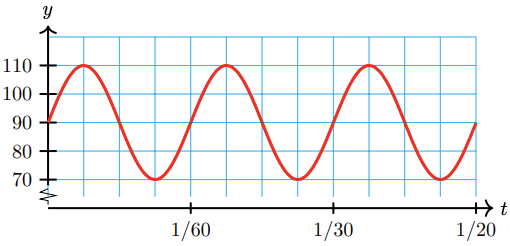
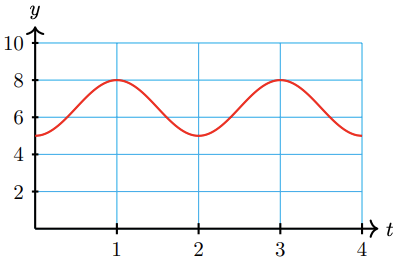
A typical blood pressure for a healthy adult, measured in millimeters of mercury, varies between 70 and 110, and a typical heart rate is 60 beats per minute. Write a sinusoidal function that approximates blood pressure, and sketch its graph.
- Answer
-
We would like a function of the form \(y=k+a \sin B t\), so we must find the values of the parameters \(A, B\) and \(k\).
- The midline of the graph is \(y=\frac{70+110}{2}=90\), and the amplitude is \(110-90=20\), so \(A=20\) and \(k=90\).
- The graph repeats 60 times per minute, so the period is \(\frac{1}{60}\) minute, and \(B=\frac{2 \pi}{\frac{1}{60}}=120 \pi\)
Thus,
\(y=90+20 \sin 120 \pi t\)
The graph of the function is shown below.
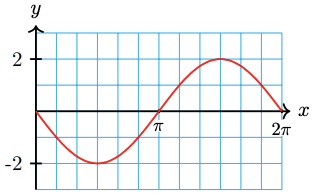
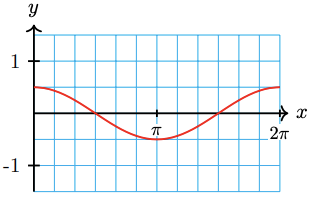
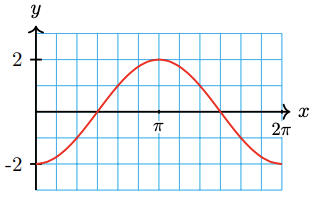
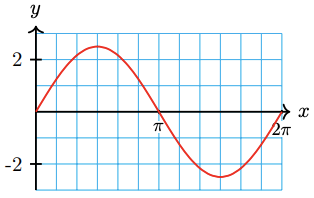
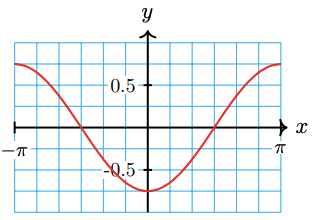
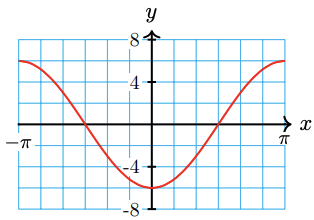
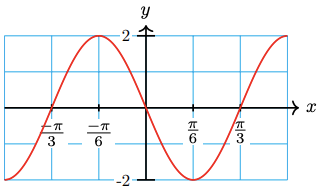
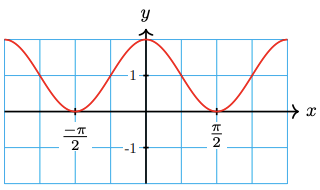
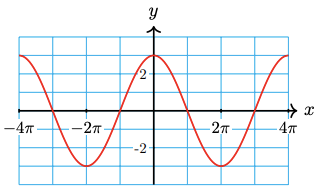
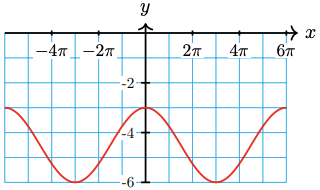
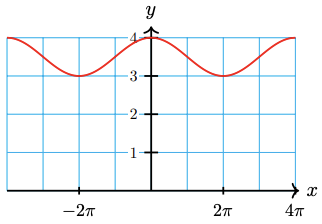
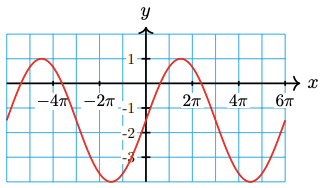
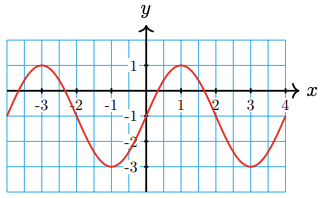
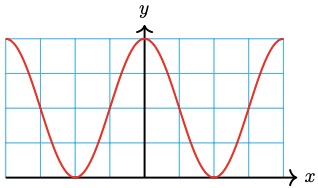
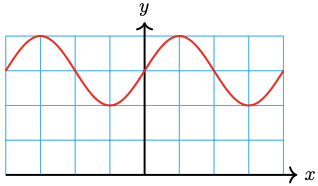
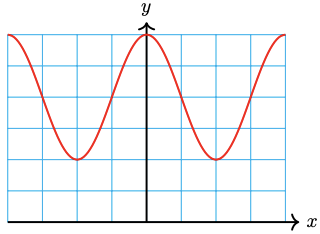
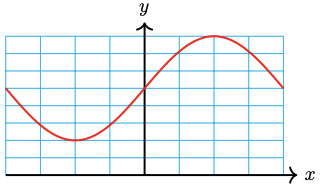
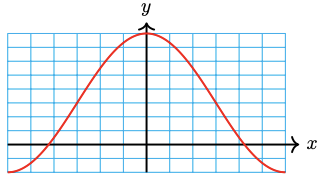
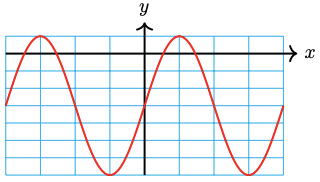
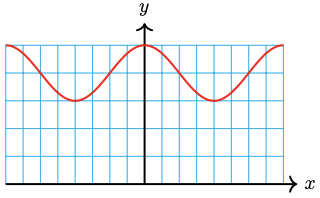
Note 7.10 In Example 5, we could have chosen either a sine or a cosine function to model blood pressure; both describe the periodic behavior described. However, if we are given, or would like to specify, the starting point for a sinusoidal function, one choice can be more suitable than the other. Consider the functions graphed below.
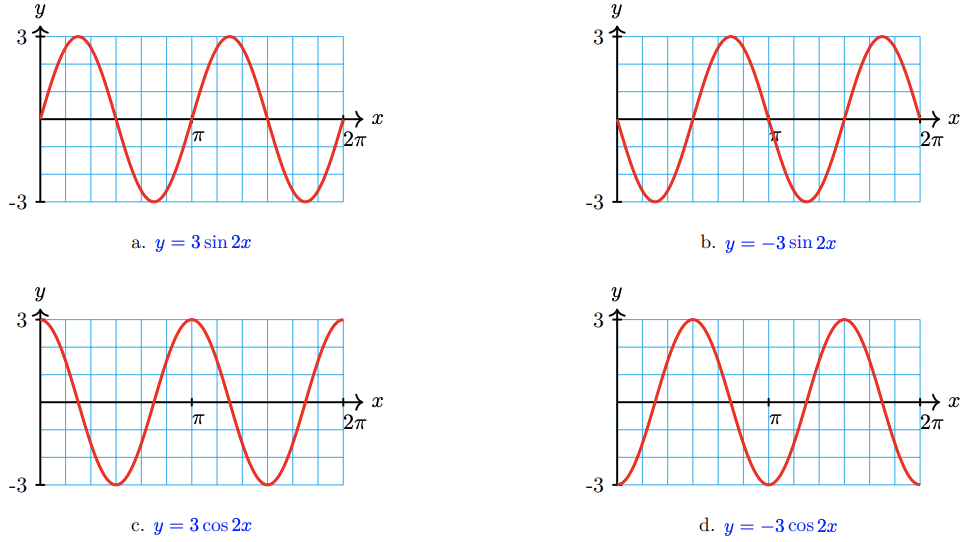
All four functions have the same amplitude and period, but they start at different points on the cycle.
- The graphs in (a) and (b) start on the midline, so they are best modeled by sine functions.
- The graph in (b) starts out decreasing instead of increasing, so the coefficient A is negative.
- The graph in (c) is modeled by a cosine, because it starts at the maximum point, and the graph in (d) starts at the minimum point, so we choose a negative cosine to model it.
(In Section 7.2, we’ll consider sinusoidal functions that start at other positions on the cycle.)
In Exercise 5, note the starting point of the graph, and choose the most appropriate sinusoidal function to model the function.
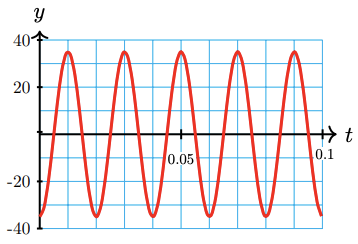
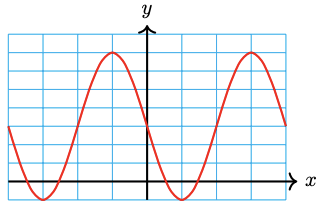
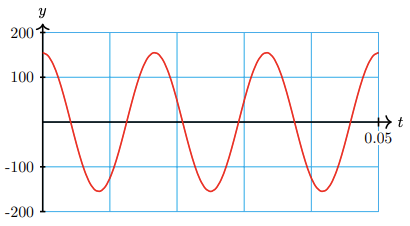
The graph below shows the voltage of a generator, as seen on an oscilloscope.
a Write a sinusoidal function for the voltage level.
b What is the frequency of the signal, in cycles per second?
- Answer
-
a \(y=-35 \cos 100 \pi t\)
b 50 cycles per second
The Tangent Function
The transformations of shifting and stretching can be applied to the tangent function as well. The graph of \(y=\tan x\) does not have an amplitude, but we can see any vertical stretch by comparing the function values at the guidepoints.
1. Graph \(y=1+3 \tan 2 x\).
2. Describe the transformations of the graph, compared to \(y=\tan x\).
- Answer
-
a Recall that the period of the tangent function is \(\pi\). We make a table of values for one cycle of the function, choosing multiples of \(\frac{\pi}{4}\) as the inputs for the tangent function. Then we plot the guidepoints, and sketch a tangent function through them. The graph is shown below.
\(x\) \(2x\) \(\tan 2x\) \(1 + 3 \tan 2x\) 0 0 0 1 \(\dfrac{\pi}{8}\) \(\dfrac{\pi}{4}\) 1 4 \(\dfrac{\pi}{4}\) \(\dfrac{\pi}{2}\) --- --- \(\dfrac{3\pi}{8}\) \(\dfrac{3\pi}{4}\) -1 -2 \(\dfrac{\pi}{2}\) \(\pi\) 0 1 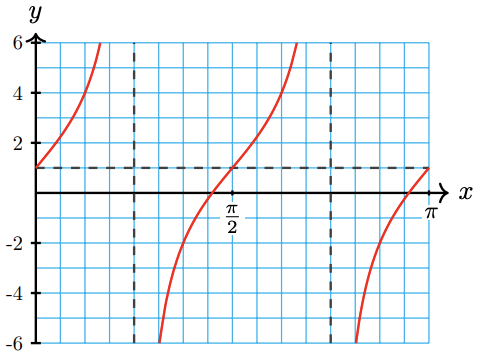
b Writing the formula as
\(y=A \tan B x+k=3 \tan 2 x+1\)
we see that the graph is stretched vertically by a factor of \(A=3\). The midline is \(y=1\), so the graph is shifted up by 1 unit. Finally, the coefficient \(B=2\) compresses the graph horizontally by a factor of 2, so the period of the graph is \(\frac{\pi}{2}\), and there are four cycles between 0 and \(2 \pi\)
a Identify the midline and period of the tangent graph shown below.
Find an equation of the form
\(y = A \tan Bx + k\)
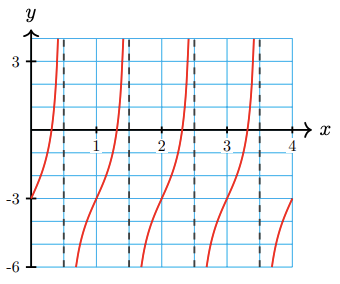
b for the graph.
- Answer
-
a Midline: \(y = -2\), period = 2
b \(y = -3 + 2 \tan \pi x\)
Review the following skills you will need for this section.
Complete the table.
1.| \(t\) | 0 | \(\dfrac{\pi}{2}\) | \(\pi\) | \(\dfrac{3\pi}{2}\) | \(2\pi\) |
| \(t + \dfrac{\pi}{6}\) |
| \(t\) | 0 | \(\dfrac{\pi}{2}\) | \(\pi\) | \(\dfrac{3\pi}{2}\) | \(2\pi\) |
| \(t - \dfrac{\pi}{6}\) |
| \(x\) | 0 | \(\dfrac{\pi}{2}\) | \(\pi\) | \(\dfrac{3\pi}{2}\) | \(2\pi\) |
| \(x - \dfrac{\pi}{3}\) |
| \(x\) | 0 | \(\dfrac{\pi}{2}\) | \(\pi\) | \(\dfrac{3\pi}{2}\) | \(2\pi\) |
| \(x + \dfrac{\pi}{3}\) |
- Answer
- 1.
2.\(t\) 0 \(\dfrac{\pi}{2}\) \(\pi\) \(\dfrac{3\pi}{2}\) \(2\pi\) \(t + \dfrac{\pi}{6}\) \(\dfrac{\pi}{6}\) \(\dfrac{2\pi}{3}\) \(\dfrac{7\pi}{6}\) \(\dfrac{5\pi}{3}\) \(\dfrac{13\pi}{6}\)
3.\(t\) 0 \(\dfrac{\pi}{2}\) \(\pi\) \(\dfrac{3\pi}{2}\) \(2\pi\) \(t - \dfrac{\pi}{6}\) \(\dfrac{-\pi}{6}\) \(\dfrac{\pi}{3}\) \(\dfrac{5\pi}{6}\) \(\dfrac{4\pi}{3}\) \(\dfrac{11\pi}{6}\)
4.\(x\) 0 \(\dfrac{\pi}{2}\) \(\pi\) \(\dfrac{3\pi}{2}\) \(2\pi\) \(x - \dfrac{\pi}{3}\) \(\dfrac{-\pi}{3}\) \(\dfrac{\pi}{6}\) \(\dfrac{2\pi}{3}\) \(\dfrac{7\pi}{6}\) \(\dfrac{5\pi}{3}\) \(x\) 0 \(\dfrac{\pi}{2}\) \(\pi\) \(\dfrac{3\pi}{2}\) \(2\pi\) \(x + \dfrac{\pi}{3}\) \(\dfrac{\pi}{3}\) \(\dfrac{5\pi}{6}\) \(\dfrac{4\pi}{3}\) \(\dfrac{11\pi}{6}\) \(\dfrac{7\pi}{3}\)
Section 7.1 Summary
Vocabulary
• Transformation
• Amplitude
• Period
• Midline
Concepts
1 Changes to the amplitude, period, and midline of the basic sine and cosine graphs are called transformations. Changing the midline shifts the graph vertically, changing the amplitude stretches or compresses the graph vertically, and changing the period stretches or compresses the graph horizontally.
2
1 The graph of
\(y=A \cos x \quad \text { or } \quad y=A \sin x\)
has amplitude \(|A|\).
2 The graph of
\(y=\cos B x \quad \text { or } \quad y=\sin B x\)
has period \(\frac{2 \pi}{B}\).
3 The graph of
\(y=k+\cos x \quad \text { or } \quad y=k+\sin x\)
has midline \(y=k\).
3 One way to make a quick sketch of a sinusoidal graph is to use a table of values. The trick is to choose convenient values for the input variable.
4 The transformations of shifting and stretching can be applied to the tangent function as well.
Study Questions
1 Count from 0 to \(2 \pi\) by multiples of \(\frac{\pi}{4}\).
2 Count from 0 to \(2 \pi\) by multiples of \(\frac{\pi}{6}\).
3 Transformationhe maximum value of a certain sinusoidal function is \(M\), and its minimum value is \(m\). What is the midline of the function? What is its amplitude?
4 \(f(x)=k+A \tan x\), and \(f(0)=4, f\left(\frac{\pi}{4}\right)=6\). What are the values of \(k\) and \(A\)?
Skills
1 Identify the amplitude, period, and midline of a circular function #1–8, 23–30
2 Graph a circular function #9–16, 31–44
3 Find a formula for the graph of a circular function #17–30
4 Model periodic phenomena with circular functions #45–52
5 Graph transformations of the tangent function #535–8
6 Solve trigonometric equations graphically #59–70
Homework 7-1
For Problems 1–8, state the amplitude, period, and midline of the graph.
1. \(y=-3+2 \sin x\)
2. \(y=4-3 \cos x\)
3. \(y=-\cos 4 x\)
4. \(y=-\sin 3 x\)
5. \(y=-5 \sin \dfrac{x}{3}\)
6. \(y=6 \cos \dfrac{x}{2}\)
7. \(y=1-\cos \pi x\)
8. \(y=2+\sin 2 \pi x\)
In Problems 9–16, we use transformations to sketch graphs of the functions in Problems 1–8. Sketch one cycle of each graph by hand and label scales on the axes.
9.
a \(y=\sin x\)
b \(y=2 \sin x\)
c \(y=-3+2 \sin x\)
10.
a \(y=\cos x\)
b \(y=-3 \cos x\)
c \(y=4-3 \cos x\)
11.
a \(y=\cos x\)
b \(y=\cos 4 x\)
c \(y=-\cos x\)
12.
a \(y=\sin x\)
b \(y=\sin 3 x\)
c \(y=-\sin 3 x\)
13.
a \(y=\sin x\)
b \(y=\sin \dfrac{x}{3}\)
с \(y=-5 \sin \dfrac{x}{3}\)
14.
a \(y=\cos x\)
b \(y=\cos \dfrac{x}{2}\)
c \(y=6 \cos \dfrac{x}{2}\)
15.
a \(y=\cos x\)
b \(y=\cos \pi x\)
c \(y=1-\cos \pi x\)
16.
a \(y=\sin x\)
b \(y=\sin 2 \pi x\)
c \(y=2+\sin 2 \pi x\)
For Problems 17–22, write an equation for the graph using sine or cosine.
17. 
18. 
19. 
20. 
21. 
22. 
For Problems 23–30,
a State the amplitude, period, and midline of the graph.
b Write an equation for the graph using sine or cosine.
23. 
24. 
25. 
26. 
27. 
28. 
29. 
30. 
In Problems 31–36, we use a table of values to sketch circular functions.
a Complete the table of values for the function.
b Sketch a graph of the function and label the scales on the axes.
31. \(y = 2 - 5 \cos 2t\)
| \(t\) | \(2t\) | \(\cos 2t\) | \(-5 \cos 2t\) | \(2 - 5 \cos 2t\) |
| 0 | ||||
| \(\dfrac{\pi}{2}\) | ||||
| \(\pi\) | ||||
| \(\dfrac{3\pi}{2}\) | ||||
| \(2\pi\) |
32. \(y = -2 + 4 \sin 3t\)
| \(t\) | \(3t\) | \(\sin 3t\) | \(4 \sin 3t\) | \(-2 + 4 \sin 3t\) |
| 0 | ||||
| \(\dfrac{\pi}{2}\) | ||||
| \(\pi\) | ||||
| \(\dfrac{3\pi}{2}\) | ||||
| \(2\pi\) |
33. \(y = 1 + 3 \cos \dfrac{t}{2}\)
| \(t\) | \(\dfrac{t}{2}\) | \(\cos \dfrac{t}{2}\) | \(3\cos \dfrac{t}{2}\) | \(1 + 3\cos \dfrac{t}{2}\) |
| 0 | ||||
| \(\dfrac{\pi}{2}\) | ||||
| \(\pi\) | ||||
| \(\dfrac{3\pi}{2}\) | ||||
| \(2\pi\) |
34. \(y = -2 -3 \sin \dfrac{t}{4}\)
| \(t\) | \(\dfrac{t}{4}\) | \(\sin \dfrac{t}{4}\) | \(3\sin \dfrac{t}{4}\) | \(-2 -3 \sin \dfrac{t}{4}\) |
| 0 | ||||
| \(\dfrac{\pi}{2}\) | ||||
| \(\pi\) | ||||
| \(\dfrac{3\pi}{2}\) | ||||
| \(2\pi\) |
35. \(y = -3 + 2 \sin \dfrac{t}{3}\)
36. \(y = -1 + 4 \cos \dfrac{t}{6}\)
For Problems 37–44, label the scales on the axes for the graph.
37. \(y=3-4 \sin 2 x\)
38. \(y=2 \cos 5 x+2\)
39. \(y=\dfrac{1}{2} \sin 3 x+\dfrac{3}{2}\)
40. \(y=\dfrac{2}{5} \cos 6 x+\dfrac{4}{5}\)
41. \(50-30 \sin \dfrac{x}{4}\)
42. \(25 \cos \dfrac{x}{3}+15\)
43. \(y=4 \sin \pi x-3\)
44. \(y=\dfrac{1}{2} \cos \dfrac{\pi x}{2}+2\)
45. The height of the tide in Cabot Cove can be approximated by a sinusoidal function. At 5 am on July 23, the water level reached its high mark at the 20-foot line on the pier, and at 11 am, the water level was at its lowest at the 4-foot line.
a Sketch a graph of \(W(t)\), the water level as a function of time, from 5 am on July 23 to 5 am on July 24.
b Write an equation for the function.
46. The population of mosquitoes at Marsh Lake is a sinusoidal function of time. The population peaks around June 1 at about 6000 mosquitoes per square kilometer, and is smallest on December 1, at 1000 mosquitoes per square kilometer.
a Sketch a graph of \(M(t)\), the number of mosquitoes as a function of the month, where \(t=0\) on June 1.
b Write an equation for the function.
47. The paddlewheel on the Delta Queen steamboat is 28 feet in diameter, and is rotating once every ten seconds. The bottom of the paddlewheel is 4 feet below the surface of the water.
a The ship's logo is painted on one of the paddlewheel blades. At \(t=0\), the blade with the logo is at the top of the wheel. Sketch a graph of the logo's height above the water as a function of \(t\).
b Write an equation for the function.
48. Delbert’s bicycle wheel is 24 inches in diameter, and he has a light attached to the spokes 10 inches from the center of the wheel. It is dark, and he is cycling home slowly from work. The bicycle wheel makes one revolution every second.
a At \(t=0\), the light is at its highest point the bicycle wheel. Sketch a graph of the light's height as a function of \(t\).
b Write an equation for the function.
For Problems 49–52, write an equation for the sinusoidal function whose graph is shown.
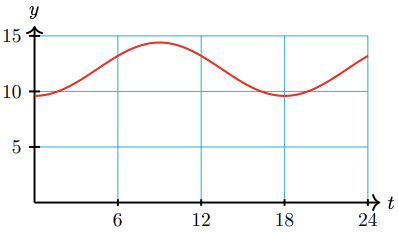
49. The number of hours of daylight in Salt Lake City varies from a minimum of 9.6 hours on the winter solstice to a maximum of 14.4 hours on the summer solstice. Time is measured in months, starting at the winter solstice.
50. A weight is 6.5 feet above the floor, suspended from the ceiling by a spring. The weight is pulled down to 5 feet above the floor and released, rising past 6.5 feet in 0.5 seconds before attaining its maximum height of feet. The weight oscillates between its minimum and maximum height.
51. The voltage used in U.S. electrical current changes from 155V to 155V and back 60 times each second.
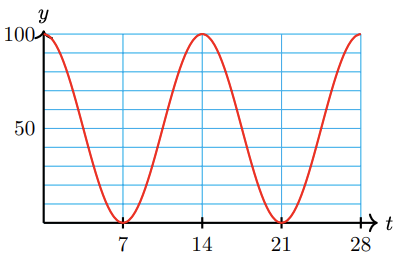
52. Although the moon is spherical, what we see from earth looks like a disk, sometimes only partly visible. The percentage of the moon’s disk that is visible varies between 0 (at new moon) to 100 (at full moon), over a 28-day cycle.
For Problems 53–58,
a Make a table of values and sketch a graph of the function.
b Give its period and midline.
53. \(y=\tan 2 x\)
54. \(y=\tan 4 x\)
55. \(y=4+2 \tan 3 x\)
56. \(y=3+\dfrac{1}{2} \tan 2 x\)
57. \(y=3-\tan \dfrac{x}{4}\)
58. \(y=1-2 \tan \dfrac{x}{3}\)
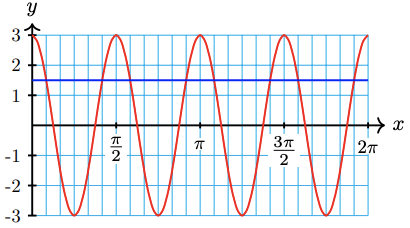
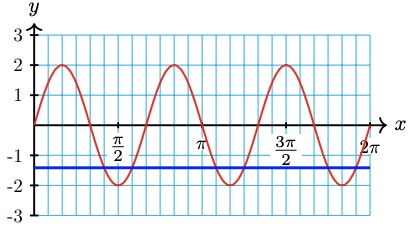
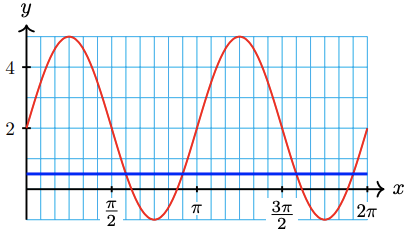
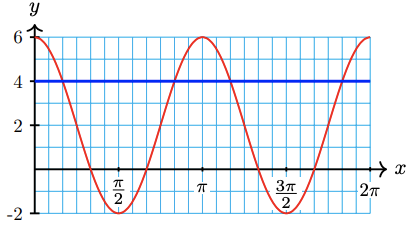
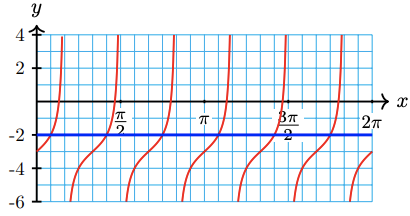
For Problems 59-64, use the graph to find all solutions between 0 and \(2 \pi\).
59. \(3 \cos 4 x=1.5\)
60. \(2 \sin 3 x=-\sqrt{2}\)
61. \(2+3 \sin 2 x=0.5\)
62. \(2+4 \cos 2 x=4\)
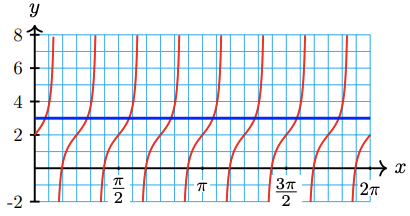
63. \(-3+\tan 3 x=-2\)
64. \(2+\tan _y 4 x=3\)
For Problems 65–70,
a Use a calculator to graph the function for \(0 \leq x \leq 2 \pi\).
b Use the intersect feature to find all solutions between 0 and \(2 \pi\). Round your answers to hundredths.
65.
a \(f(x)=3 \sin 2 x\)
b \(3 \sin 2 x=-1.5\)
66.
a \(g(x)=-2 \cos 3 x\)
b \(-2 \cos 3 x=1\)
67.
a \(h(x)=2-4 \cos \dfrac{x}{4}\)
b \(2-4 \cos \dfrac{x}{4}=0\)
68.
a \(H(x)=3+2 \sin \dfrac{x}{2}\)
b \(3+2 \sin \dfrac{x}{2}=5\)
69.
a \(G(x)=-1+3 \cos 3 x\)
b \(-1+3 \cos 3 x=1\)
70.
a \(F(x)=4-3 \sin 2 x\)
b \(4-3 \sin 2 x=2.5\)