
1.2: Solving Linear Equations in Two Variables


( \newcommand{\kernel}{\mathrm{null}\,}\)
In this section, you will learn to:
- Show all solutions to an equation by graphing a line.
- Graph a line by finding its intercepts.
- Graph and find equations of vertical and horizontal lines.
- Find the slope of a line.
- Graph the line if a point and the slope are given.
Before you get started, take this prerequisite quiz.
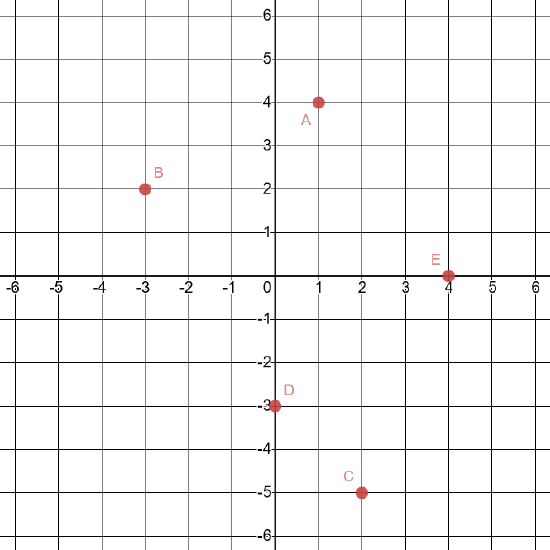
1. On a piece of graph paper, plot and label these points: A(1, 4), B(-3, 2), C(2, -5), D(0, -3), E(4, 0).
- Click here to check your answer
-
If you missed any part of this problem, review here. (Note that this will open a different textbook in a new window.)
2. Write the coordinates of each of the points shown in this graph.
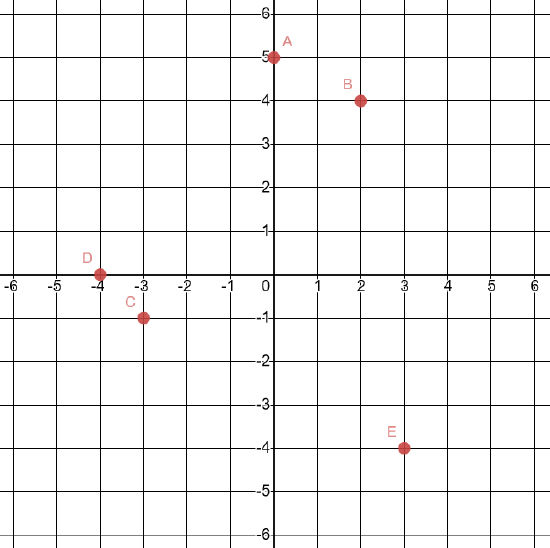
- Click here to check your answer
-
A(0, 5)
B(2, 4)
C(-3, -1)
D(-4, 0)
E(3, -4)
If you missed any part of this problem, review here. (Note that this will open a different textbook in a new window.)
3. Solve the equation 2x−6y=24 for the given values.
a. Solve for x when y=5.
b. Solve for y when x=3.
- Click here to check your answer
-
a. x=27
b. y=−3
If you missed any part of this problem, review Section 1.1. (Note that this will open a in a new window.)
4. Simplify each expression without the use of a calculator.
a. −4−(−7)
b. −4+(−7)
c. −4−7
d. −4+7
- Click here to check your answer
-
a. 3
b. −11
c. −11
d. 3
If you missed any part of this problem, review here. (Note that this will open a different textbook in a new window.)
Solutions of Equations with Two Variables
Remember that a solution is the value(s) of the variable(s) that make(s) the equation true.
When an equation only has one variable, we can isolate that variable to identify the solution. In most equations with one variable, there exists only one value that can make the equation true. For example, in the equation 6=x+2, the only solution to this equation is x=4 since that is the only value of the variable that would make the equation true.
When an equation has two variables however, there exist infinite values for the variables that make the equation true. For example, consider the equation y=x+2.
- If x=0, then y=2.
- If x=1, then y=3.
- If x=2, then y=4.
- If x=100, then y=102.
There are an infinite number of possibilities that can make the equation y=x+2 true. Rather than try to list all solutions to the equation (which is impossible), we can show all solutions to the equation by graphing them on a coordinate grid. Each solution is listed as an (x, y) point, as shown here:
- If x=0, then y=2. This is shown as the point (0, 2).
- If x=1, then y=3. This is shown as the point (1, 3).
- If x=2, then y=4. This is shown as the point (2, 4).
- If x=100, then y=102. This is shown as the point (100, 102).
The graph for y=x+2 would look like the graph below. Note that the points (0, 2), (1, 3), and (2, 4) are included among the points that the graph goes through. If the line were drawn out far enough, it would go through the point (100, 102) as well.

Note that this graph goes through infinite points that are not labeled here. Every point the graph touches would be a solution to the equation y=x+2 though, including (3, 5), (-2, 0), and even (1.5, 3.5). You are encouraged to test each of these pairs of values into the equation to verify that they do indeed make the equation true!
Graphing a Line from its Equation
Equations whose graphs are straight lines are called linear equations. The following are some examples of linear equations:
2x−3y=6,3x=4y−7,y=2x−5,2y=3, and x−2=0
A line is completely determined by two points. Therefore, to graph a linear equation we need to find the coordinates of two points. This can be accomplished by choosing an arbitrary value for x or y and then solving for the other variable.
Graph the line: y=3x+2
Solution
We need to find the coordinates of at least two points. We arbitrarily choose x = - 1, x = 0, and x = 1.
- If x = -1, then y = 3(-1) + 2 or -1. Therefore, (-1, -1) is a point on this line.
- If x = 0, then y = 3(0) + 2 or y = 2. Hence the point (0, 2).
- If x = 1, then y = 5, and we get the point (1, 5).
Below, the results are summarized, and the line is graphed.
| x | y | (x, y) |
|---|---|---|
| -1 | -1 | (-1, -1) |
| 0 | 2 | (0, 2) |
| 1 | 5 | (1,5) |

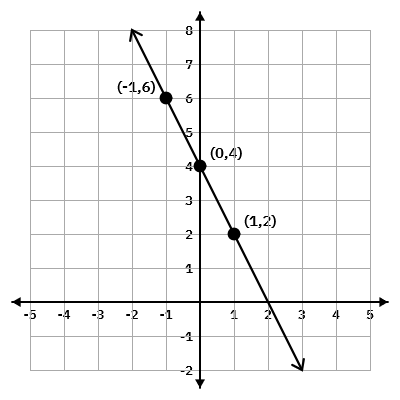
Graph the line: 2x+y=4
Solution
Again, we need to find coordinates of at least two points.
We arbitrarily choose x = -1, x = 0, and y = 2.
- If x = -1, then 2(-1) + y = 4 which results in y = 6. Therefore, (-1, 6) is a point on this line.
- If x = 0, then 2(0) + y = 4, which results in y = 4. Hence the point (0, 4).
- If y = 2, then 2x + 2 = 4, which yields x = 1, and gives the point (1, 2).
The table below shows the points, and the line is graphed.
| x | y | (x, y) |
|---|---|---|
| -1 | 6 | (-1, 6) |
| 0 | 4 | (0, 4) |
| 1 | 2 | (1,2) |
Graph the line: y=2x−3.
- Click here to check your answer

Intercepts
The points at which a line crosses the coordinate axes are called the intercepts. Since the line is touching one axis at each intercept, we know the value of one of the variables at that point.
Consider this graph below. Even though this graph isn't as "simple" as a linear graph, we can still discuss its intercepts.
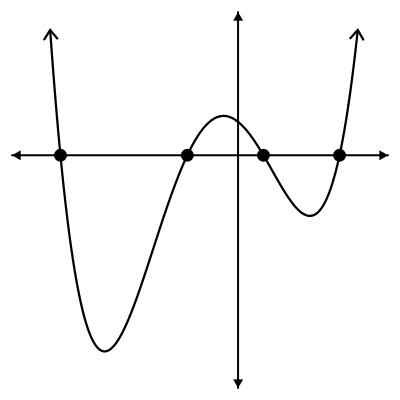
The x-intercepts on this graph are identified with points. Even without numbers on this graph, we can still know something about the x-intercepts. What do all 4 of these points have in common? Each of them has a y-value of zero. Or to write out the coordinates of these points, they would each look like (_?_ , 0).
Likewise, we could consider the y-intercept of the same graph:
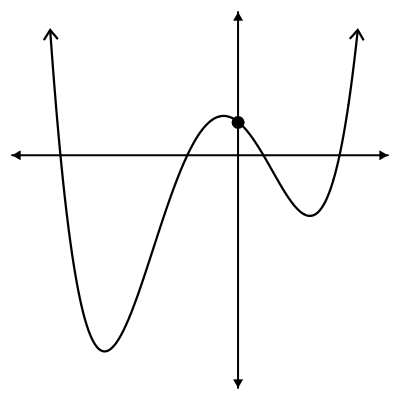
Even without numbers on this graph, we can still know something about the y-intercept. What is it? We know it has an x-value of zero. Or to write out the coordinate of this point, it would look like (0, _?_).
When graphing a line by plotting two points, using the intercepts is often preferred because they are often relatively easy to find.
- To find the value of the x-intercept, we let y = 0 and solve for x.
- To find the value of the y-intercept, we let x = 0 and solve for y.
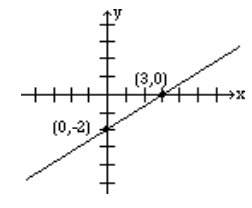
Find the intercepts of the line: 2x−3y=6, and graph.
Solution
To find the x-intercept, let y = 0 in the equation and solve for x.
2x−3(0)=62x−0=62x=6x=3
Therefore, the x-intercept is the point (3,0).
To find the y-intercept, let x = 0 in the equation and solve for y.
2(0)−3y=60−3y=6−3y=6y=−2
Therefore, the y-intercept is the point (0, -2).
To graph the line, plot the points for the x-intercept (3,0) and the y-intercept (0, -2), and use them to draw the line.
Find the intercepts of the line: 4x+2y=12, and graph.
- Click here to check your answer
Horizontal and Vertical Lines
When an equation of a line has only one variable, the resulting graph is a horizontal or a vertical line.
- The graph of the line x=a, where a is a constant, is a vertical line that passes through the point (a,0). Every point on this line has the x-coordinate equal to a, regardless of the y-coordinate.
- The graph of the line y=b, where b is a constant, is a horizontal line that passes through the point (0,b). Every point on this line has the y-coordinate equal to b, regardless of the x-coordinate.
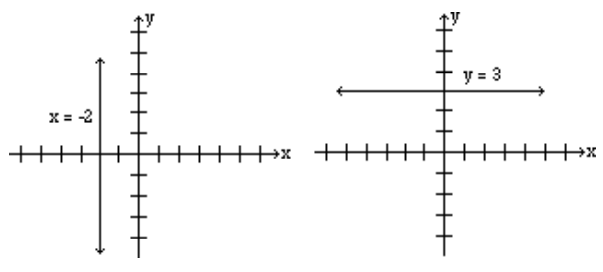
Graph the lines: x = -2 , and y = 3.
Solution
The graph of the line x = -2 is a vertical line that has the x-coordinate -2 no matter what the y-coordinate is. The graph is a vertical line passing through point (-2, 0).
The graph of the line y = 3, is a horizontal line that has the y-coordinate 3 regardless of what the x-coordinate is. Therefore, the graph is a horizontal line that passes through point (0, 3).
Note: Most students feel that the coordinates of points must always be integers. This is not true, and in real life situations, not always possible. Do not be intimidated if your points include numbers that are fractions or decimals.
Graphing Using Slope
A graph of a line can also be determined if one point and the "steepness" of the line is known. The number that refers to the steepness or inclination of a line is called the slope of the line.
From previous math courses, many of you remember slope as the "rise over run," or "the vertical change over the horizontal change" and have often seen it expressed as:
riserun,vertical changehorizontal change,ΔyΔx etc.
We give a precise definition.
If (x1, y1) and (x2, y2) are two different points on a line, the slope of the line is
slope=m=y2−y1x2−x1
Find the slope of the line passing through points (−2, 3) and (4, −1), and graph the line.
Solution
Let (x1, y1) = (−2, 3) and (x2, y2) = (4, −1), then the slope (via Equation ???) is
| m=−1−34−(−2)=−46=−23 | 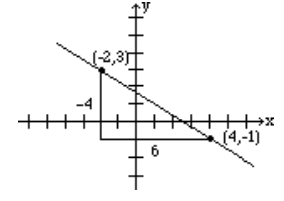 |
To give the reader a better understanding, both the vertical change, -4, and the horizontal change, 6, are shown in the above figure.
When two points are given, it does not matter which point is denoted as (x1, y1) and which (x2, y2). The value for the slope will be the same.
In Example 1.2.1, if we instead choose (x1, y1) = (4, −1) and (x2, y2) = (−2, 3), then we will get the same value for the slope as we obtained earlier.
The steps involved are as follows.
m=3−(−1)−2−4=4−6=−23
Find the slope of the line that passes through the points (−1, −4) and (3, −4) and graph the line.
Solution
Let (x1, y1) = (−1, −4) and (x2, y2) = (3, −4), then the slope is
m=−4−(−4)3−(−1)=04=0
Note: The slope of any horizontal line is 0
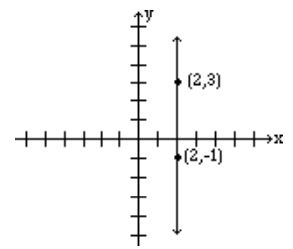
Find the slope of the line that passes through the points (2, 3) and (2, −1), and graph the line.
Solution
Let (x1, y1) = (2, 3) and (x2, y2) = (2, −1) then the slope is
m=−1−32−2=40=undefined.
NOTE: Remember that zero can NEVER be in the denominator of a fraction. When we encounter this scenario, the value is undefined. It does not exist. This is different than having a value of zero.
Note: The slope of any vertical line is undefined.
Find the slope of the line that passes through the points (-2, -6) and (2, 4), and graph the line.
- Click here to check your answer
- The slope is m=52.

Using the previous four examples, students should observe that:
- if a line rises when going from left to right, the line has a positive slope.
- if a line falls going from left to right, the line has a negative slope.
- if a line is horizontal where the value of y never changes, the line has a slope of zero.
- if a line is vertical where the value of x never changes, the line does not have a slope.
Sometimes we are given the slope and a point on the line and need to graph the entire line. In this case, we can use the given point as a "starting point" and use slope as riserun to graph additional points.
Graph the line that passes through the point (1, 2) and has slope −34.
Solution
Slope equals riserun. The fact that the slope is −34, means that for every rise of -3 units (fall of 3 units) there is a run of 4. So if from the given point (1, 2) we go down 3 units and go right 4 units, we reach the point (5, -1). The graph is obtained by connecting these two points.
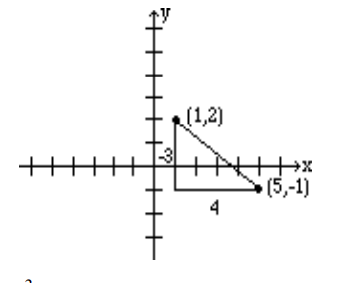
Alternatively, since 3−4 represents the same number, the line can be drawn by starting at the point (1,2) and choosing a rise of 3 units followed by a run of -4 units. So from the point (1, 2), we go up 3 units, and to the left 4, thus reaching the point (-3, 5) which is also on the same line. See figure below.
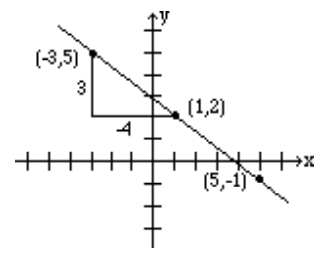
Remember that mathematically, −34, −34, and 3−4 are all equivalent to one another.
Find the slope of the line 2x+3y=6 by finding two points on the line.
Solution
In order to find the slope of this line, we will choose any two points on this line.
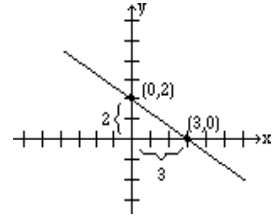
Again, the selection of x and y intercepts seems to be a good choice. The x-intercept is (3, 0), and the y-intercept is (0, 2). Therefore, the slope is
m=2−00−3=−23.
The graph below shows the line and the x-intercepts and y-intercepts:
Find the slope and the y-intercept of the line y=3x+2.
Solution
We again find two points on the line, e.g., (0, 2) and (1, 5). Therefore, the slope is
m=5−21−0=31=3.
Look at the slopes and the y-intercepts of the following lines.
| The line | slope | y-intercept |
|---|---|---|
| y=3x+2 | 3 | 2 |
| y=−2x+5 | -2 | 5 |
| y=32x−4 | 32 | -4 |
It is no coincidence that when an equation of the line is solved for y, the coefficient of the x term represents the slope, and the constant term represents the y-intercept.
In other words, for the line y=mx+b, m is the slope, and b is the y-intercept. We will examine this more in the next section.
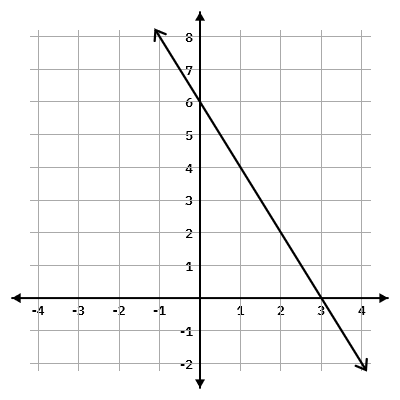
Determine the slope and y-intercept of the line 2x+3y=6.
Solution
We solve for y:
2x+3y=63y=−2x+6y=(−2/3)x+2
The slope = the coefficient of the x term = − 2/3.
The y-intercept = the constant term = 2.