
2.3: Using Transformations to Graph Functions
- Page ID
- 48334
Learning Objectives
- Define the rigid transformations and use them to sketch graphs.
- Define the non-rigid transformations and use them to sketch graphs.
Prerequisite Skills
Before you get started, take this prerequisite quiz.
1. Sketch a graph of each of the following functions. Include at least 3 key points on each graph.
a. \(y=x\)
- Click here to check your answer
-

b. \(y=x^2\)
- Click here to check your answer
-

c. \(y=x^3\)
- Click here to check your answer
-

d. \(y=|x|\)
- Click here to check your answer
-

e. \(y=\sqrt{x}\)
- Click here to check your answer
-

f. \(y=\dfrac{1}{x}\)
- Click here to check your answer
-

If you missed any part of this problem, review Section 2.2. (Note that this will open in a new window.)
When the graph of a function is changed in appearance and/or location we call it a transformation. There are two types of transformations. A rigid transformation57 changes the location of the function in a coordinate plane, but leaves the size and shape of the graph unchanged. A non-rigid transformation58 changes the size and/or shape of the graph.
Vertical and Horizontal Translations
A vertical translation59 is a rigid transformation that shifts a graph up or down relative to the original graph. This occurs when a constant is added to any function. If we add a positive constant to each \(y\)-coordinate, the graph will shift up. If we add a negative constant, the graph will shift down. For example, consider the functions \(g(x) = x^{2} − 3\) and \(h(x) = x^{2} + 3\). Begin by evaluating for some values of the independent variable \(x\).

Now plot the points and compare the graphs of the functions \(g\) and \(h\) to the basic graph of \(f(x) = x^{2}\), which is shown using a dashed grey curve below.
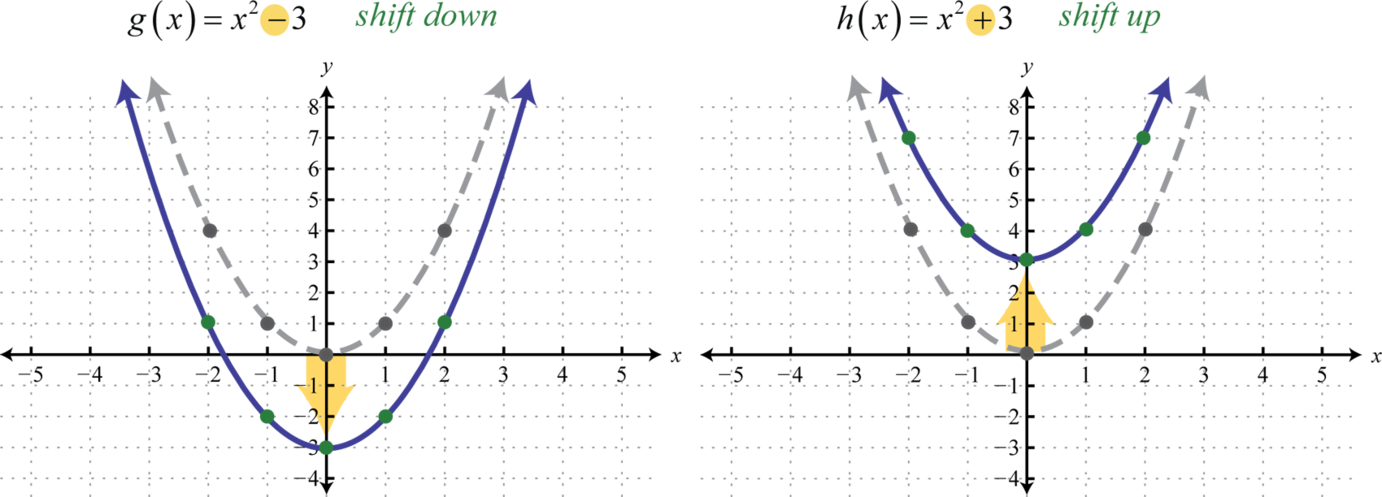
The function \(g\) shifts the basic graph down \(3\) units and the function \(h\) shifts the basic graph up \(3\) units. In general, this describes the vertical translations; if \(k\) is any positive real number:
| Vertical shift up \(k\) units: | \(F(x)=f(x)+k\) |
|---|---|
| Vertical shift down \(k\) units: | \(F(x)=f(x)-k\) |
Table 2.5.1
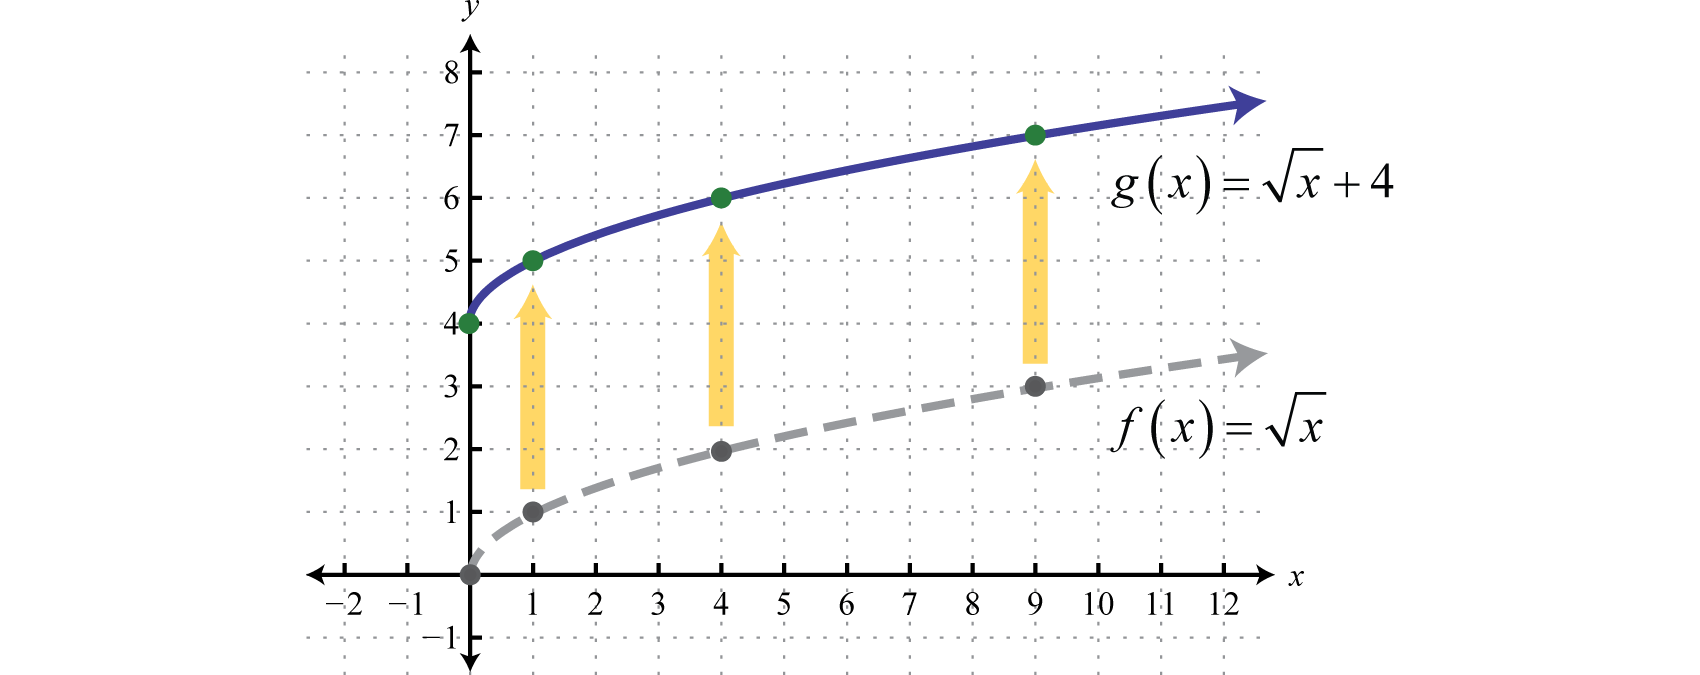
Example \(\PageIndex{1}\):
Sketch the graph of \(g(x)=\sqrt{x}+4\).
Solution
Begin with the basic function defined by \(f(x)=\sqrt{x}\) and shift the graph up \(4\) units.
Answer:
A horizontal translation60 is a rigid transformation that shifts a graph left or right relative to the original graph. This occurs when we add or subtract constants from the \(x\)-coordinate before the function is applied. For example, consider the functions defined by \(g(x)=(x+3)^{2}\) and \(h(x)=(x−3)^{2}\) and create the following tables:
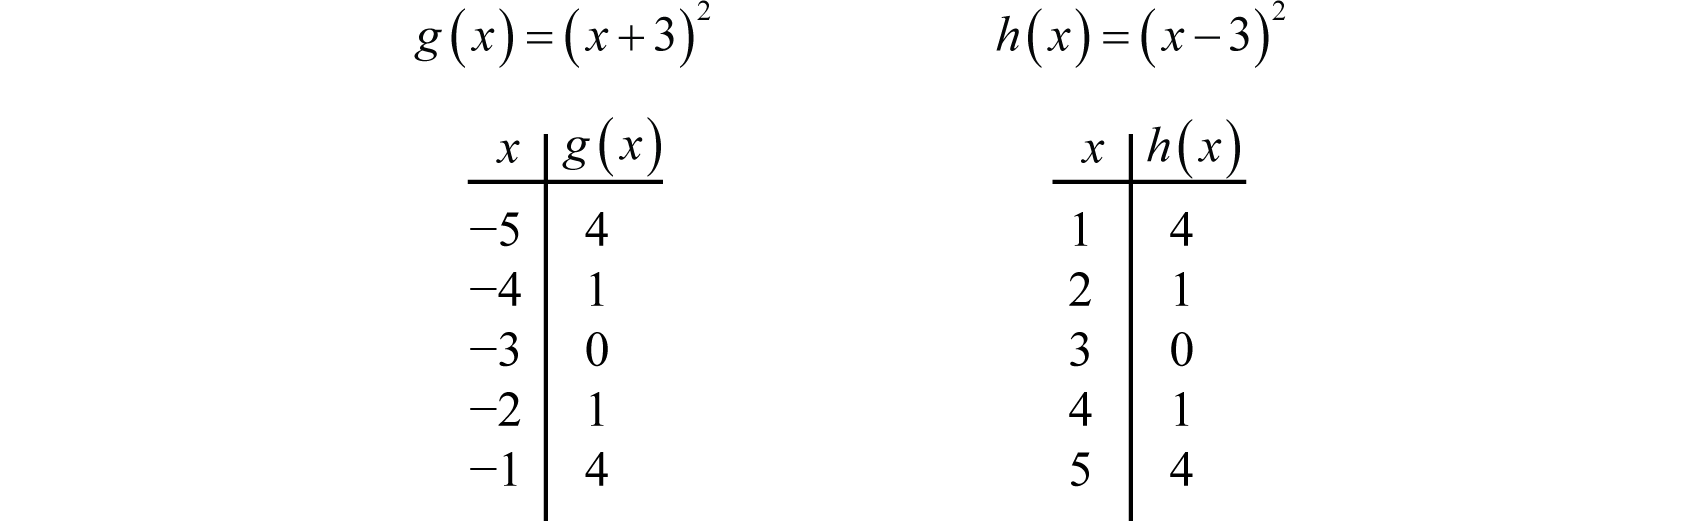
Here we add and subtract from the x-coordinates and then square the result. This produces a horizontal translation.
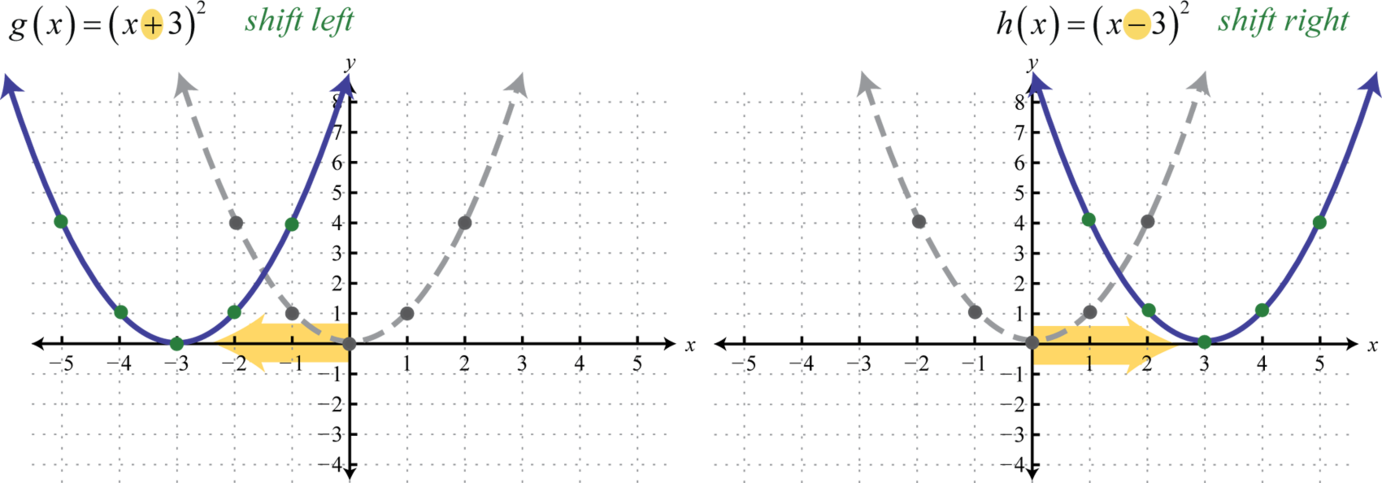
Note that this is the opposite of what you might expect. In general, this describes the horizontal translations; if \(h\) is any positive real number:
| Horizontal shift left \(h\) units: | \(F(x)=f(x+h)\) |
|---|---|
| Horizontal shift right \(h\) units: | \(F(x)=f(x-h)\) |
Table 2.5.2
Example \(\PageIndex{2}\):
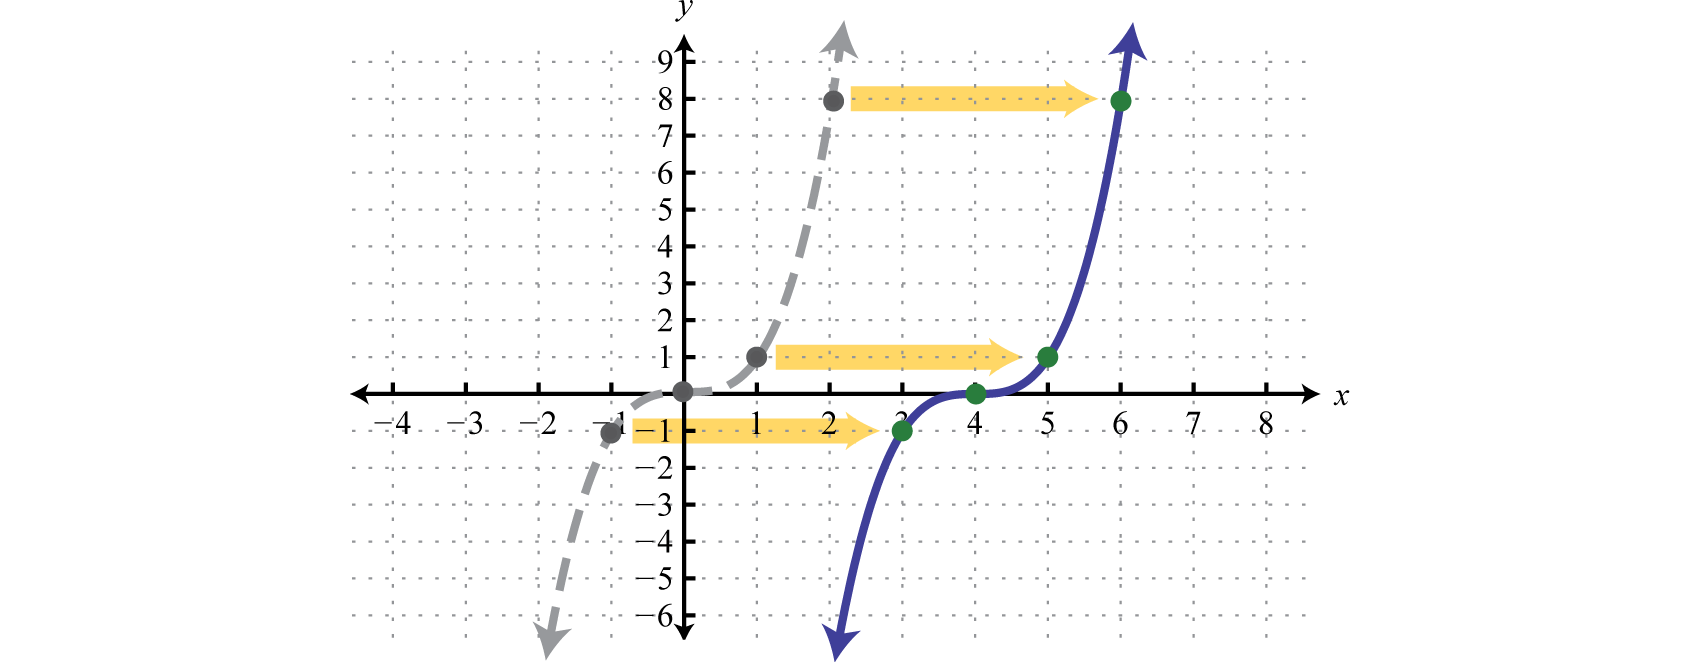
Sketch the graph of \(g(x)=(x−4)^{3}\).
Solution
Begin with a basic cubing function defined by \(f(x)=x^{3}\) and shift the graph \(4\) units to the right.
Answer:
It is often the case that combinations of translations occur.
Example \(\PageIndex{3}\):
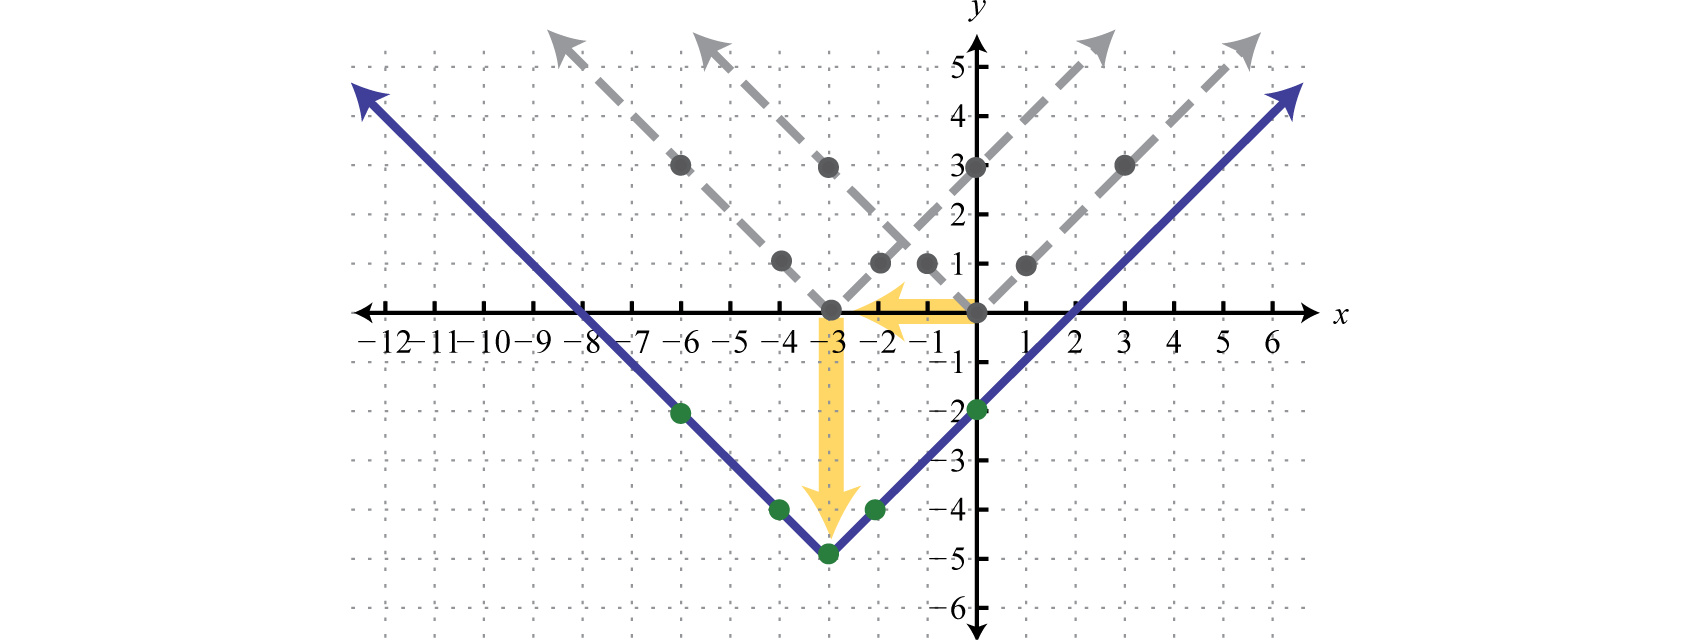
Sketch the graph of \(g(x)=|x+3|−5\).
Solution
Start with the absolute value function and apply the following transformations.
\(\begin{array} { l } { y = | x | } \quad\quad\quad\quad\color{Cerulean}{Basic \:function} \\ { y = | x + 3 | } \quad\: \quad\color{Cerulean}{Horizontal \:shift \: left \:3 \:units} \\ { y = | x + 3 | - 5 } \:\:\:\color{Cerulean}{Vertical \:shift \:down \:5 \:units} \end{array}\)
Answer:
The order in which we apply horizontal and vertical translations does not affect the final graph.
Example \(\PageIndex{4}\):
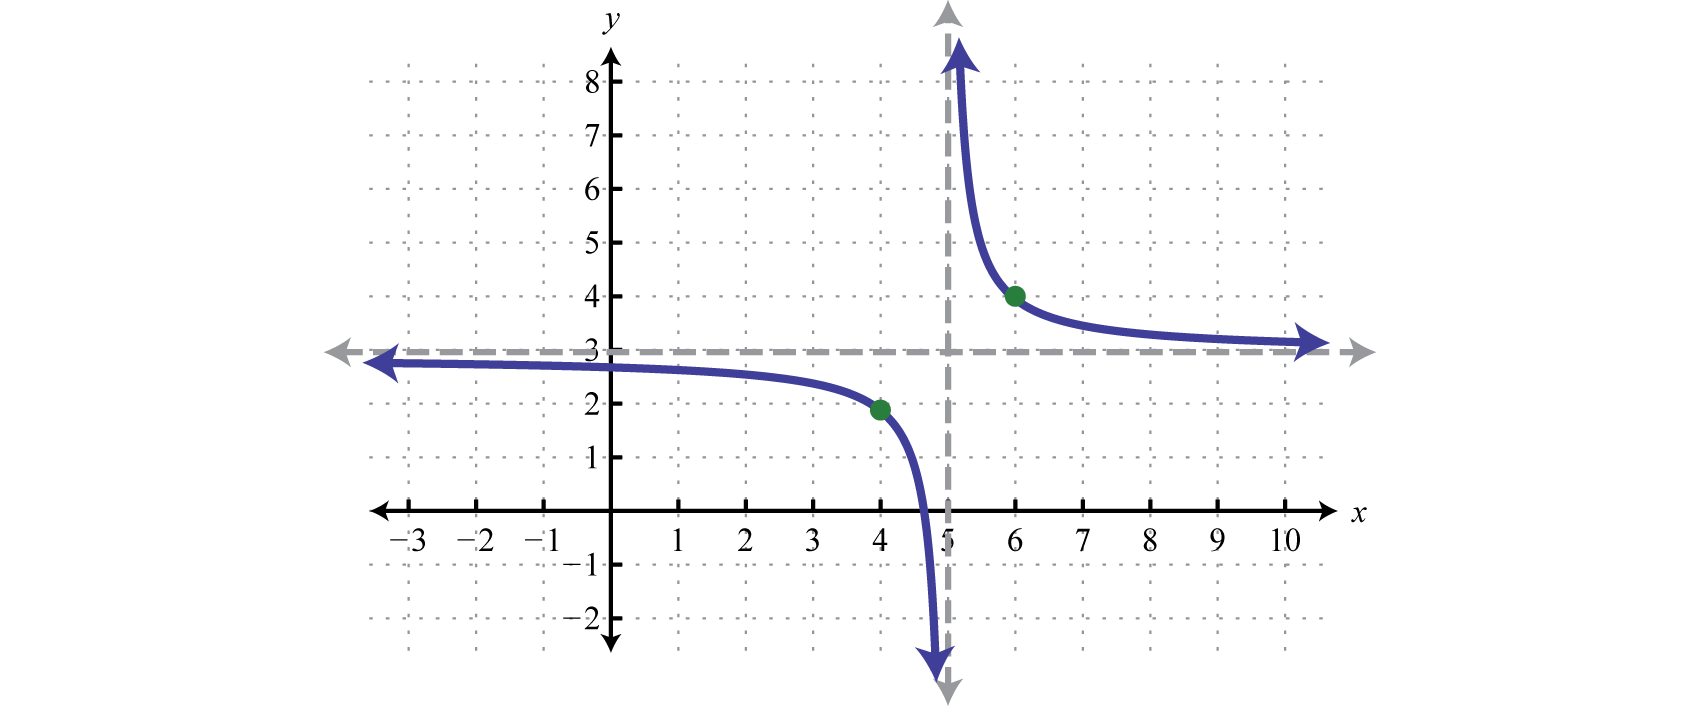
Sketch the graph of \(g ( x ) = \frac { 1 } { x - 5 } + 3\).
Solution
Begin with the reciprocal function and identify the translations.
\(\begin{array} { l } { y = \frac{1}{x} } \quad\quad\quad\quad\color{Cerulean}{Basic \:function} \\ { y = \frac{1}{x-5} } \quad\: \quad\:\:\:\color{Cerulean}{Horizontal \:shift \: right \:5 \:units} \\ { y = \frac{1}{x-5} +3 } \:\:\:\:\:\:\:\color{Cerulean}{Vertical \:shift \:up \:3 \:units} \end{array}\)
Take care to shift the vertical asymptote from the y-axis 5 units to the right and shift the horizontal asymptote from the x-axis up 3 units.
Answer:
Exercise \(\PageIndex{1}\)
Sketch the graph of \(g ( x ) = ( x - 2 ) ^ { 2 } + 1\).
- Answer
-
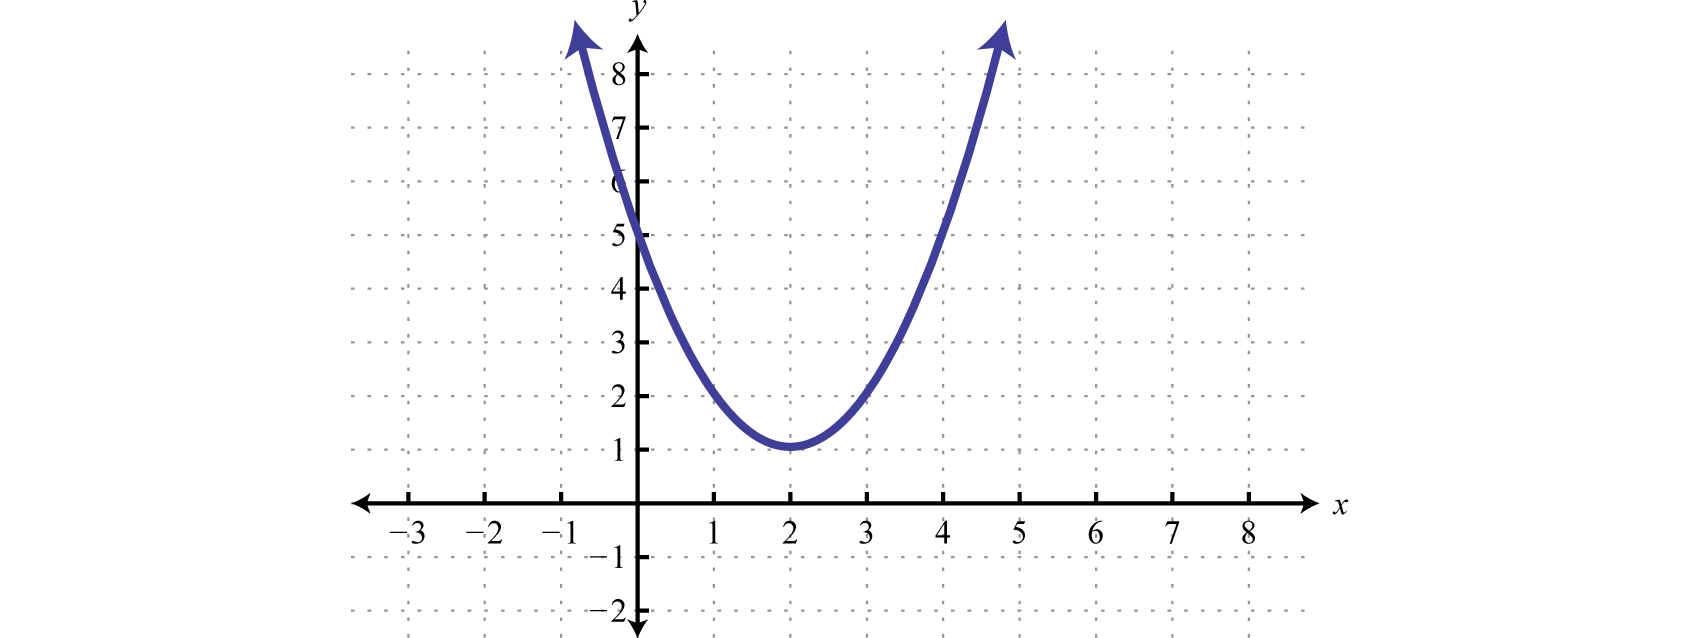
Figure 2.5.9 www.youtube.com/v/6F6zKaogxTE
Reflections
A reflection61 is a transformation in which a mirror image of the graph is produced about an axis. In this section, we will consider reflections about the \(x\)- and \(y\)-axis. The graph of a function is reflected about the \(x\)-axis if each \(y\)-coordinate is multiplied by \(−1\). The graph of a function is reflected about the \(y\)-axis if each \(x\)-coordinate is multiplied by \(−1\) before the function is applied. For example, consider \(g(x)=\sqrt{−x}\) and \(h(x)=−\sqrt{x}\).

Compare the graph of \(g\) and \(h\) to the basic square root function defined by \(f(x)=\sqrt{x}\), shown dashed in grey below:

The first function \(g\) has a negative factor that appears “inside” the function; this produces a reflection about the \(y\)-axis. The second function \(h\) has a negative factor that appears “outside” the function; this produces a reflection about the \(x\)-axis. In general, it is true that:
| Reflection about the \(y\)-axis: | \(F ( x ) = f ( - x )\) |
|---|---|
| Reflection about the \(x\)-axis: | \(F ( x ) = - f ( x )\) |
Table 2.5.3
When sketching graphs that involve a reflection, consider the reflection first and then apply the vertical and/or horizontal translations.
Example \(\PageIndex{5}\):
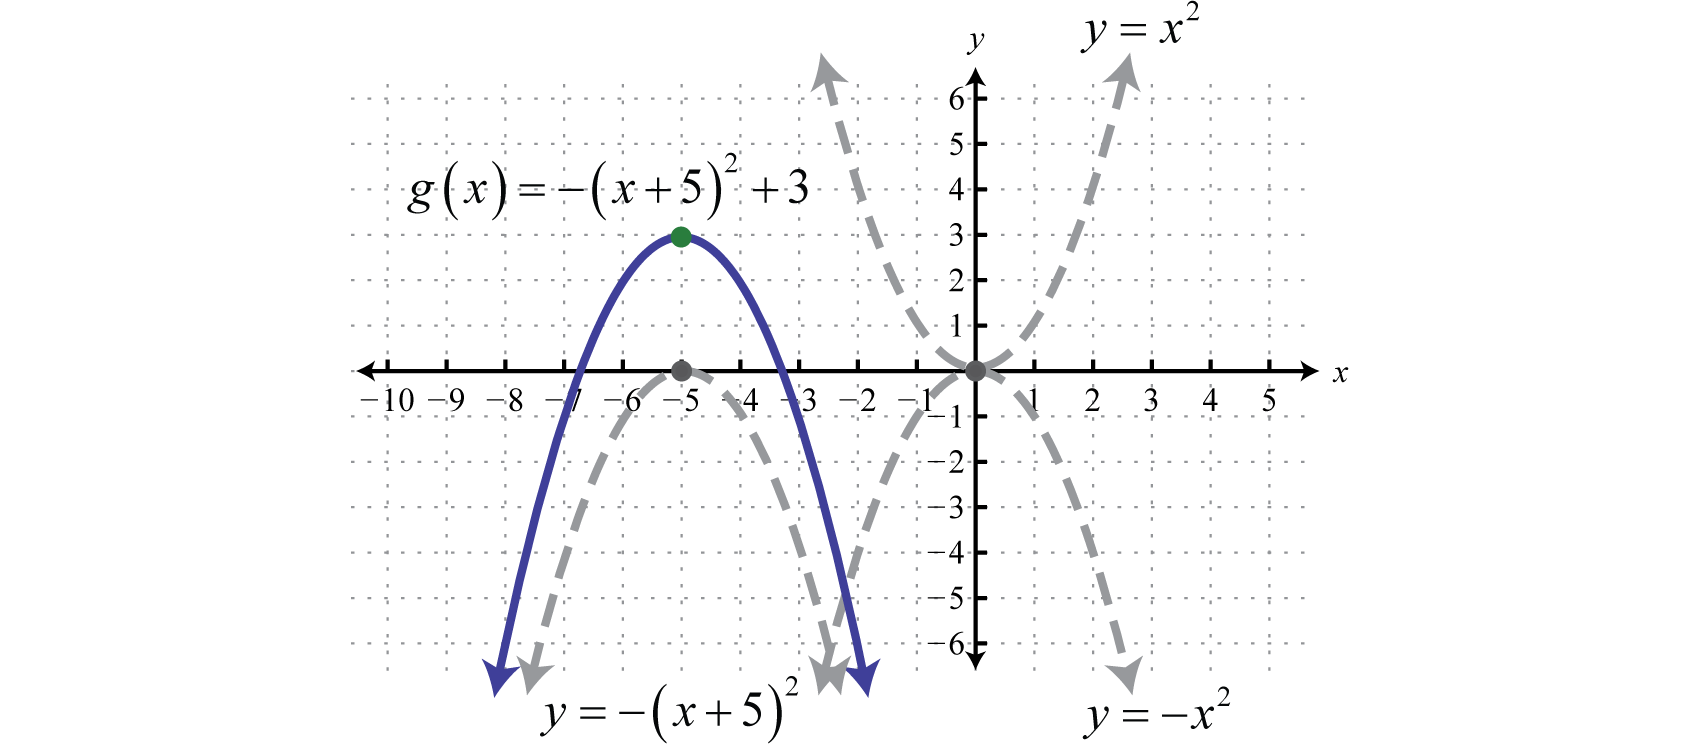
Sketch the graph of \(g ( x ) = - ( x + 5 ) ^ { 2 } + 3\).
Solution
Begin with the squaring function and then identify the transformations starting with any reflections.
\(\begin{array} { l } { y = x ^ { 2 } } \quad\quad\quad\quad\quad\quad\color{Cerulean}{Basic\: function.} \\ { y = - x ^ { 2 } } \quad\quad\quad\quad\quad\:\color{Cerulean}{Relfection\: about\: the\: x-axis.} \\ { y = - ( x + 5 ) ^ { 2 } } \quad\quad\:\:\:\color{Cerulean}{Horizontal\: shift\: left\: 5\: units.} \\ { y = - ( x + 5 ) ^ { 2 } + 3 } \quad\color{Cerulean}{Vertical\: shift\: up\: 3\: units.} \end{array}\)
Use these translations to sketch the graph.
Answer:
Exercise \(\PageIndex{2}\)
Sketch the graph of \(g ( x ) = - | x | + 3\).
- Answer
-
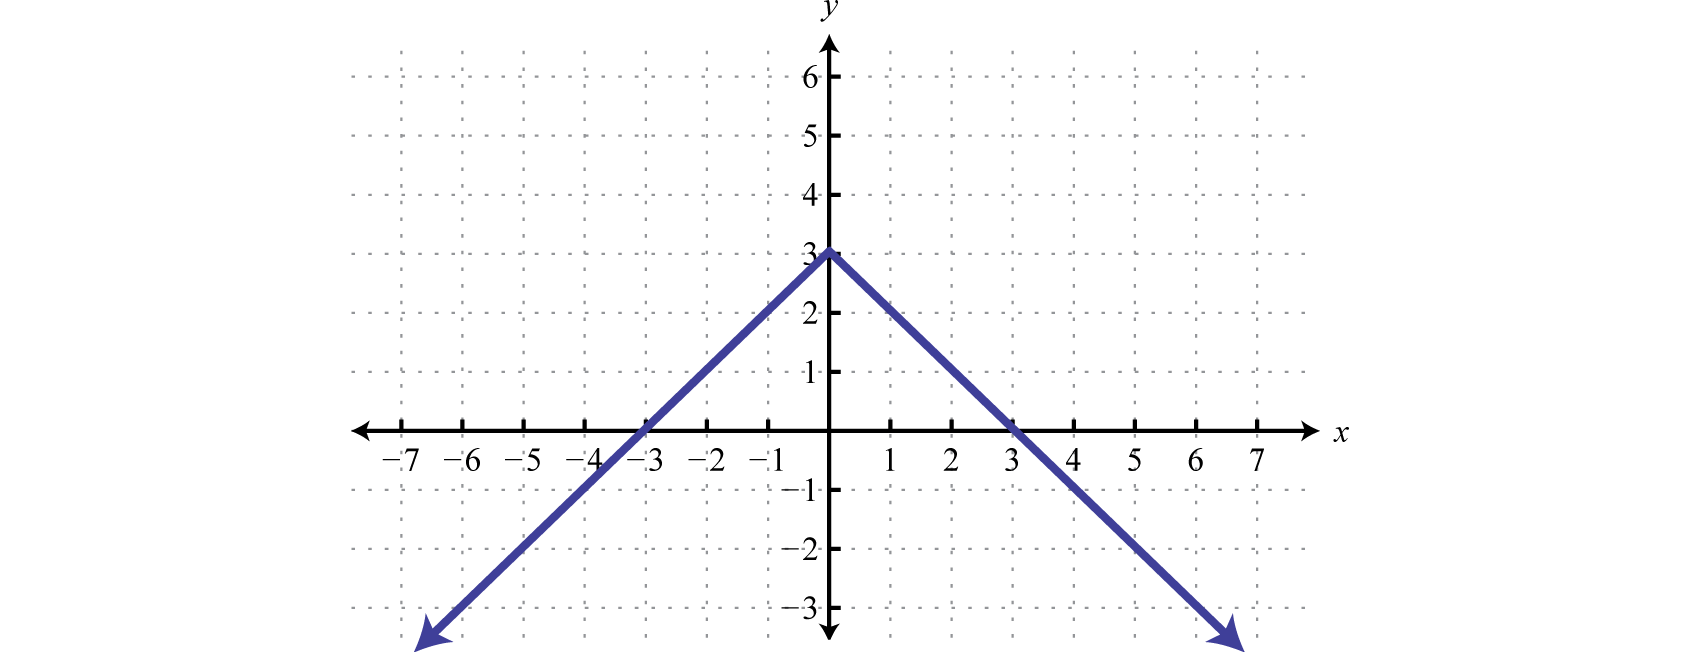
Figure 2.5.13 www.youtube.com/v/XsbLkFWWzBc
Dilations
Horizontal and vertical translations, as well as reflections, are called rigid transformations because the shape of the basic graph is left unchanged, or rigid. Functions that are multiplied by a real number other than \(1\), depending on the real number, appear to be stretched vertically or stretched horizontally. This type of non-rigid transformation is called a dilation62. For example, we can multiply the squaring function \(f(x) = x^{2}\) by \(4\) and \(\frac{1}{4}\) to see what happens to the graph.

Compare the graph of \(g\) and \(h\) to the basic squaring function defined by \(f(x)=x^{2}\), shown dashed in grey below:
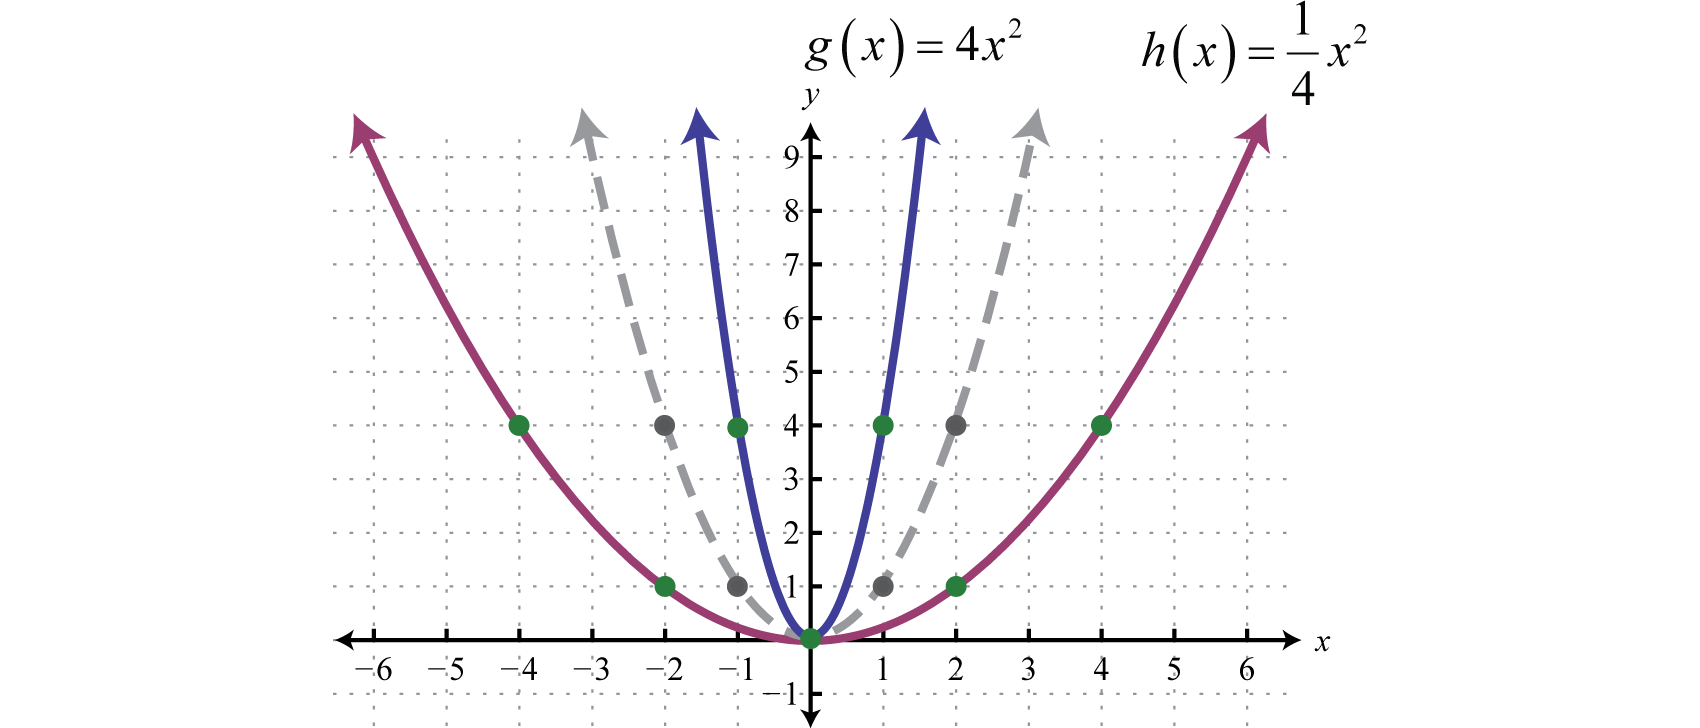
The function \(g\) is steeper than the basic squaring function and its graph appears to have been stretched vertically. The function \(h\) is not as steep as the basic squaring function and appears to have been stretched horizontally.
In general, we have:
| Dilation: | \(F ( x ) = a \cdot f ( x )\) |
|---|
Table 2.5.4
If the factor \(a\) is a nonzero fraction between \(−1\) and \(1\), it will stretch the graph horizontally. Otherwise, the graph will be stretched vertically. If the factor \(a\) is negative, then it will produce a reflection as well.
Example \(\PageIndex{6}\):
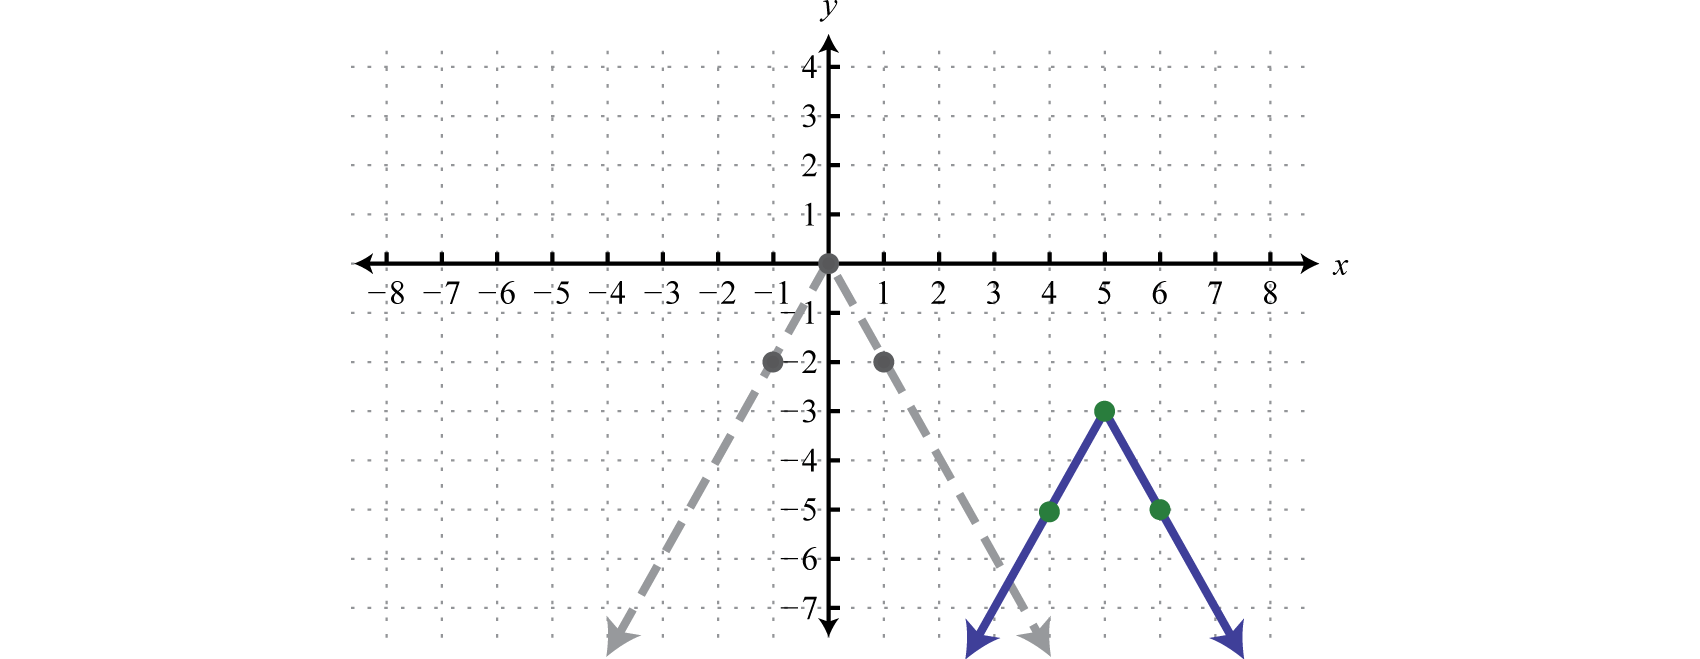
Sketch the graph of \(g ( x ) = - 2 | x - 5 | - 3\).
Solution
Here we begin with the product of \(−2\) and the basic absolute value function: \(y=−2|x|\).This results in a reflection and a dilation.
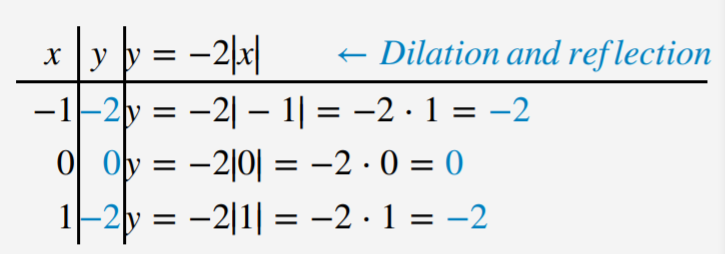.png?revision=1)
Use the points \(\{(−1, −2), (0, 0), (1, −2)\}\) to graph the reflected and dilated function \(y=−2|x|\). Then translate this graph \(5\) units to the right and \(3\) units down.
\(\begin{array} { l } { y = - 2 | x | } \quad\quad\quad\quad\:\color{Cerulean}{Basic\: graph\: with\: dilation\: and\: reflection\: about\: the\: x-axis.}\\ { y = - 2 | x - 5 | } \quad\quad\:\:\color{Cerulean}{Shift\: right\: 5\: units.} \\ { y = - 2 | x - 5 | - 3 } \:\:\:\:\color{Cerulean}{Shift\: down\: 3\: units.} \end{array}\)
Answer:
In summary, given positive real numbers \(h\) and \(k\):
| Vertical shift up \(k\) units: | \(F(x)=f(x)+k\) |
|---|---|
| Vertical shift down \(k\) units: | \(F(x)=f(x)-k\) |
Table 2.5.1
| Horizontal shift left \(h\) units: | \(F(x)=f(x+h)\) |
|---|---|
| Horizontal shift right \(h\) units: | \(F(x)=f(x-h)\) |
Table 2.5.2
| Reflection about the \(y\)-axis: | \(F ( x ) = f ( - x )\) |
|---|---|
| Reflection about the \(x\)-axis: | \(F ( x ) = - f ( x )\) |
Table 2.5.3
| Dilation: | \(F ( x ) = a \cdot f ( x )\) |
|---|
Table 2.5.4
Key Takeaways
- Identifying transformations allows us to quickly sketch the graph of functions. This skill will be useful as we progress in our study of mathematics. Often a geometric understanding of a problem will lead to a more elegant solution.
- If a positive constant is added to a function, \(f(x) + k\), the graph will shift up. If a positive constant is subtracted from a function, \(f(x) − k\), the graph will shift down. The basic shape of the graph will remain the same.
- If a positive constant is added to the value in the domain before the function is applied, \(f(x + h)\), the graph will shift to the left. If a positive constant is subtracted from the value in the domain before the function is applied, \(f(x − h)\), the graph will shift right. The basic shape will remain the same.
- Multiplying a function by a negative constant, \(−f(x)\), reflects its graph in the \(x\)-axis. Multiplying the values in the domain by \(−1\) before applying the function, \(f(−x)\), reflects the graph about the \(y\)-axis.
- When applying multiple transformations, apply reflections first.
- Multiplying a function by a constant other than \(1\), \(a ⋅ f(x)\), produces a dilation. If the constant is a positive number greater than \(1\), the graph will appear to stretch vertically. If the positive constant is a fraction less than \(1\), the graph will appear to stretch horizontally.
Footnotes
57A set of operations that change the location of a graph in a coordinate plane but leave the size and shape unchanged.
58A set of operations that change the size and/or shape of a graph in a coordinate plane.
59A rigid transformation that shifts a graph up or down.
60A rigid transformation that shifts a graph left or right.
61A transformation that produces a mirror image of the graph about an axis.
62A non-rigid transformation, produced by multiplying functions by a nonzero real number, which appears to stretch the graph either vertically or horizontally.