
11.4: Graphing Linear Equations (Part 2)

( \newcommand{\kernel}{\mathrm{null}\,}\)
Graph Vertical and Horizontal Lines
Can we graph an equation with only one variable? Just x and no y, or just y without an x? How will we make a table of values to get the points to plot?
Let’s consider the equation x = −3. The equation says that x is always equal to −3, so its value does not depend on y. No matter what y is, the value of x is always −3.
To make a table of solutions, we write −3 for all the x values. Then choose any values for y. Since x does not depend on y, you can chose any numbers you like. But to fit the size of our coordinate graph, we’ll use 1, 2, and 3 for the y-coordinates as shown in the table.
| x = -3 | ||
|---|---|---|
| x | y | (x, y) |
| -3 | 1 | (-3, 1) |
| -3 | 2 | (-3, 2) |
| -3 | 3 | (-3, 3) |
Then plot the points and connect them with a straight line. Notice in Figure 11.4.5 that the graph is a vertical line.
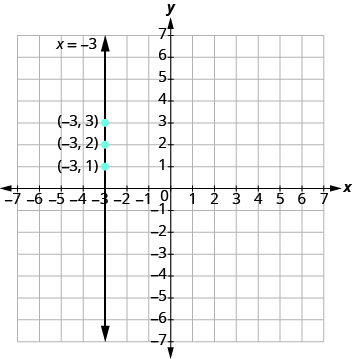
Figure 11.4.5
A vertical line is the graph of an equation that can be written in the form x = a. The line passes through the x -axis at (a, 0).
Graph the equation x = 2. What type of line does it form?
Solution
The equation has only variable, x, and x is always equal to 2. We make a table where x is always 2 and we put in any values for y.
| x = -3 | ||
|---|---|---|
| x | y | (x, y) |
| 2 | 1 | (2, 1) |
| 2 | 2 | (2, 2) |
| 2 | 3 | (2, 3) |
Plot the points and connect them as shown.
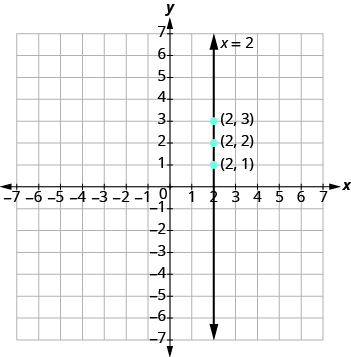
The graph is a vertical line passing through the x -axis at 2.
Graph the equation: x = 5.
- Answer
-
Graph the equation: x = −2.
- Answer
-
What if the equation has y but no x ? Let’s graph the equation y = 4. This time the y -value is a constant, so in this equation y does not depend on x.
To make a table of solutions, write 4 for all the y values and then choose any values for x.
We’ll use 0, 2, and 4 for the x -values.
| x = -3 | ||
|---|---|---|
| x | y | (x, y) |
| 0 | 4 | (0, 4) |
| 2 | 4 | (2, 4) |
| 4 | 4 | (4, 4) |
Plot the points and connect them, as shown in Figure 11.4.6. This graph is a horizontal line passing through the y-axis at 4.
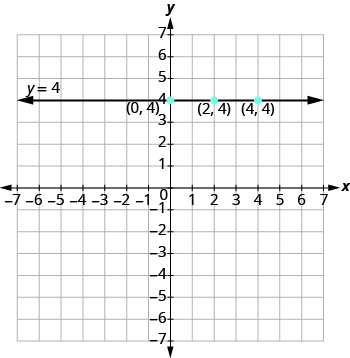
Figure 11.4.6
A horizontal line is the graph of an equation that can be written in the form y = b. The line passes through the y-axis at (0, b).
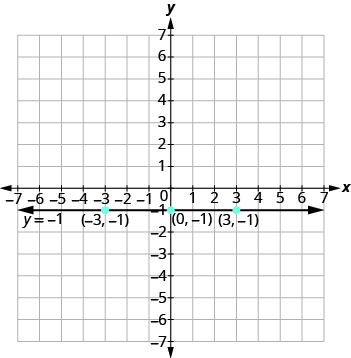
Graph the equation y = −1.
Solution
The equation y = −1 has only variable, y. The value of y is constant. All the ordered pairs in the table have the same y -coordinate, −1 . We choose 0, 3, and −3 as values for x.
| x = -3 | ||
|---|---|---|
| x | y | (x, y) |
| -3 | -1 | (-3, -1) |
| 0 | -1 | (0, -1) |
| 3 | -1 | (3, -1) |
The graph is a horizontal line passing through the y -axis at –1 as shown.
Graph the equation: y = −4.
- Answer
-
Graph the equation: y = 3.
- Answer
-
The equations for vertical and horizontal lines look very similar to equations like y = 4x. What is the difference between the equations y = 4x and y = 4?
The equation y = 4x has both x and y. The value of y depends on the value of x. The y-coordinate changes according to the value of x.
The equation y = 4 has only one variable. The value of y is constant. The y-coordinate is always 4. It does not depend on the value of x.
| y = 4x | ||
|---|---|---|
| x | y | (x, y) |
| 0 | 0 | (0, 0) |
| 1 | 4 | (1, 4) |
| 2 | 8 | (2, 8) |
| y=4 | ||
|---|---|---|
| x | y | (x, y) |
| 0 | 4 | (0, 4) |
| 1 | 4 | (1, 4) |
| 2 | 4 | (2, 4) |
The graph shows both equations.
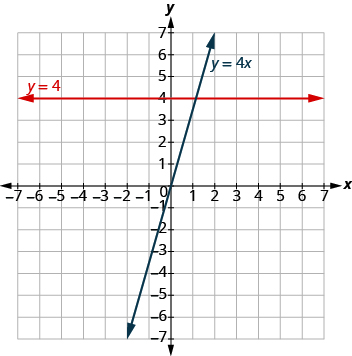
Notice that the equation y = 4x gives a slanted line whereas y = 4 gives a horizontal line.
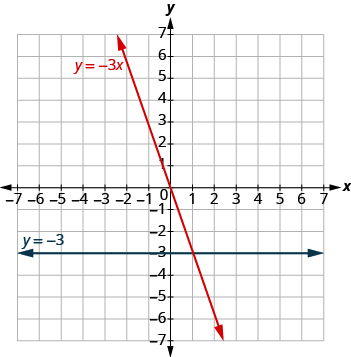
Graph y = −3x and y = −3 in the same rectangular coordinate system.
Solution
Find three solutions for each equation. Notice that the first equation has the variable x, while the second does not. Solutions for both equations are listed.
| y=−3x | ||
|---|---|---|
| x | y | (x, y) |
| 0 | 0 | (0, 0) |
| 1 | -3 | (1, -3) |
| 2 | -6 | (2, -6) |
| y = -3 | ||
|---|---|---|
| x | y | (x, y) |
| 0 | -3 | (0, -3) |
| 1 | -3 | (1, -3) |
| 2 | -3 | (2, -3) |
The graph shows both equations.
Graph the equations in the same rectangular coordinate system: y = −4x and y = −4.
- Answer
-
Graph the equations in the same rectangular coordinate system: y = 3 and y = 3x.
- Answer
-
Use a Table of Values
Graph a Linear Equation Involving Fractions
Graph Horizontal and Vertical Lines
Practice Makes Perfect
Recognize the Relation Between the Solutions of an Equation and its Graph
For each ordered pair, decide (a) is the ordered pair a solution to the equation? (b) is the point on the line?
- y = x + 2
- (0, 2)
- (1, 2)
- (− 1, 1)
- (− 3, 1)
- y = x − 4
- (0, − 4)
- (3, − 1)
- (2, 2)
- (1, − 5)
- y = 12x − 3
- (0, − 3)
- (2, − 2)
- (− 2, − 4)
- (4, 1)
- y = 13x + 2
- (0, 2)
- (3, 3)
- (− 3, 2)
- (− 6, 0)
Graph a Linear Equation by Plotting Points
In the following exercises, graph by plotting points.
- y = 3x − 1
- y = 2x + 3
- y = −2x + 2
- y = −3x + 1
- y = x + 2
- y = x − 3
- y = − x − 3
- y = − x − 2
- y = 2x
- y = 3x
- y = −4x
- y = −2x
- y = 12x + 2
- y = 13x − 1
- y = 43x − 5
- y = 32x − 3
- y = −25x + 1
- y = −45x − 1
- y = −32x + 2
- y = −53x + 4
- x + y = 6
- x + y = 4
- x + y = −3
- x + y = −2
- x − y = 2
- x − y = 1
- x − y = −1
- x − y = −3
- −x + y = 4
- −x + y = 3
- −x − y = 5
- −x − y = 1
- 3x + y = 7
- 5x + y = 6
- 2x + y = −3
- 4x + y = −5
- 2x + 3y = 12
- 3x − 4y = 12
- 13x + y = 2
- 12x + y = 3
Graph Vertical and Horizontal lines
In the following exercises, graph the vertical and horizontal lines.
- x = 4
- x = 3
- x = −2
- x = −5
- y = 3
- y = 1
- y = −5
- y = −2
- x = 73
- x = 54
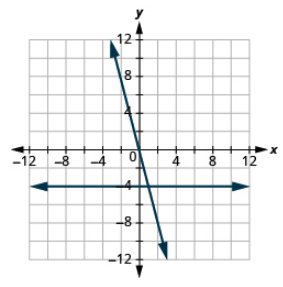
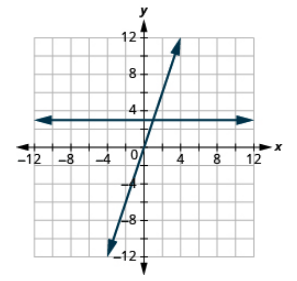
In the following exercises, graph each pair of equations in the same rectangular coordinate system.
- y = −12x and y = −12
- y = −13x and y = −13
- y = 2x and y = 2
- y = 5x and y = 5
Mixed Practice
In the following exercises, graph each equation.
- y = 4x
- y = 2x
- y = −12x + 3
- y = 14x − 2
- y = − x
- y = x
- x − y = 3
- x + y = − 5
- 4x + y = 2
- 2x + y = 6
- y = −1
- y = 5
- 2x + 6y = 12
- 5x + 2y = 10
- x = 3
- x = −4
Everyday Math
- Motor home cost The Robinsons rented a motor home for one week to go on vacation. It cost them $594 plus $0.32 per mile to rent the motor home, so the linear equation y = 594 + 0.32x gives the cost, y, for driving x miles. Calculate the rental cost for driving 400, 800, and 1,200 miles, and then graph the line.
- Weekly earning At the art gallery where he works, Salvador gets paid $200 per week plus 15% of the sales he makes, so the equation y = 200 + 0.15x gives the amount y he earns for selling x dollars of artwork. Calculate the amount Salvador earns for selling $900, $1,600, and $2,000, and then graph the line.
Writing Exercises
- Explain how you would choose three x-values to make a table to graph the line y = 15x − 2.
- What is the difference between the equations of a vertical and a horizontal line?
Self Check
(a) After completing the exercises, use this checklist to evaluate your mastery of the objectives of this section.
(b) After reviewing this checklist, what will you do to become confident for all objectives?
Contributors and Attributions
Lynn Marecek (Santa Ana College) and MaryAnne Anthony-Smith (Formerly of Santa Ana College). This content is licensed under Creative Commons Attribution License v4.0 "Download for free at http://cnx.org/contents/fd53eae1-fa2...49835c3c@5.191."