
3.2: Solving Nonlinear Inequalities


- Last updated
- Apr 27, 2023
- Save as PDF

( \newcommand{\kernel}{\mathrm{null}\,}\)
- Determine if a number is a solution to a nonlinear inequality with one variable.
- Understand the geometric relationship between solutions to nonlinear inequalities and their graphs and use this relationship to solve nonlinear inequalities.
- Solve non-linear inequalities algebraically using sign charts.
Try these questions prior to beginning this section to help determine if you are set up for success:
- Solve, graph, and state solution in interval notation: 5−6y<−1
- Simplify the polynomial expression, write in descending order, and identify the degree and leading coefficient: 11x2(x3+2)−8+3x7−4x+5x2
- Factor the given expression completely:
- 3a2−48
- y2−5y−6
- 2x3+6x2−x−3
- Simplify the expression: 4−8m−12m212m2−12
- Answer
-
- (1,∞)

Figure 3.2.1 If you missed this problem or feel you could use more practice, review [2.1: Real Numbers, Linear Inequalities, and Interval Notation]
- 3x7+11x5+27x2−4x+5. The degree of the polynomial is 7 and the leading coefficient is 3.
If you missed this problem or feel you could use more practice, review [2.3: Polynomial Expressions, 2.6: Multiplying Polynomial Expressions, and other sections discussing polynomial expressions as needed]
-
- 3(a+4)(a−4)
- (y−6)(y+1)
- (2x2−1)(x+3)
If you missed this problem or feel you could use more practice, review [2.12: General Strategy for Factoring Polynomials and other sections discussing factoring as needed]
- −3m−13(m−1)
If you missed this problem or feel you could use more practice, review [2.13: Simplifying, Multiplying, and Dividing Rational Expressions]
Precalculus is a course that focuses on the concept of functions. Functions are the basis of programming languages that are used in the programs that run the technology we interact with in our daily lives. We use functions to help describe the world around us. They help us describe how we expect things to behave and they help us to make predictions. As we start our journey into studying of functions, we will be begin with nonlinear inequalities.
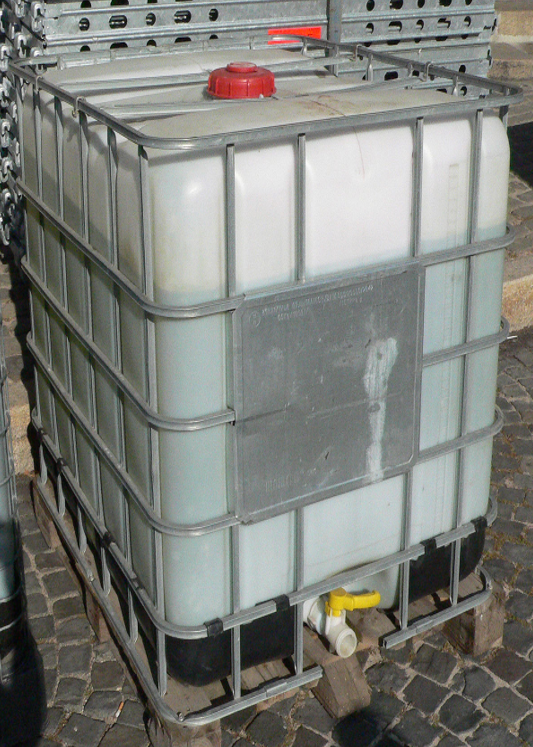
Inequalities are very useful as they give us a way to define constraints in real-life situations. Consider a container that is being designed to collect rain water for future drinking use. The container is designed to hold a positive quantity of water which would be described by the volume the container can hold. It would not make sense for the volume to be less than zero since the minimum amount of water the container can hold is no water. Since the volume cannot be negative, we can describe this with an inequality, volume≥0. The size and shape of the container would describe the exact inequality for this situation.
Nonlinear inequalities contain expressions that are nonlinear. Based on things you have had experience with in algebra courses, variables raised to powers and variables in denominators within an inequality would indicate that an inequality is nonlinear.
Some examples of nonlinear inequalities: m2−8m>9 , x−4(3x−2)(x+5)≤0
A solution to an inequality is any real number that will produce a true statement when substituted in for the variable.
Are −3, −2, and −1 solutions to x2−x−6≤0?
Solution
Substitute the given value in for x and simplify.
x2−x−6≤0x2−x−6≤0x2−x−6≤0(−3)2−(−3)−6≤0(−2)2−(−2)−6≤0(−1)2−(−1)−6≤09+3−6≤04+2−6≤01+1−6≤06≤0✗0≤0✓−4≤0✓
Answer:
−2 and −1 are solutions and −3 is not.
Solving Nonlinear Inequalities Using Graphs
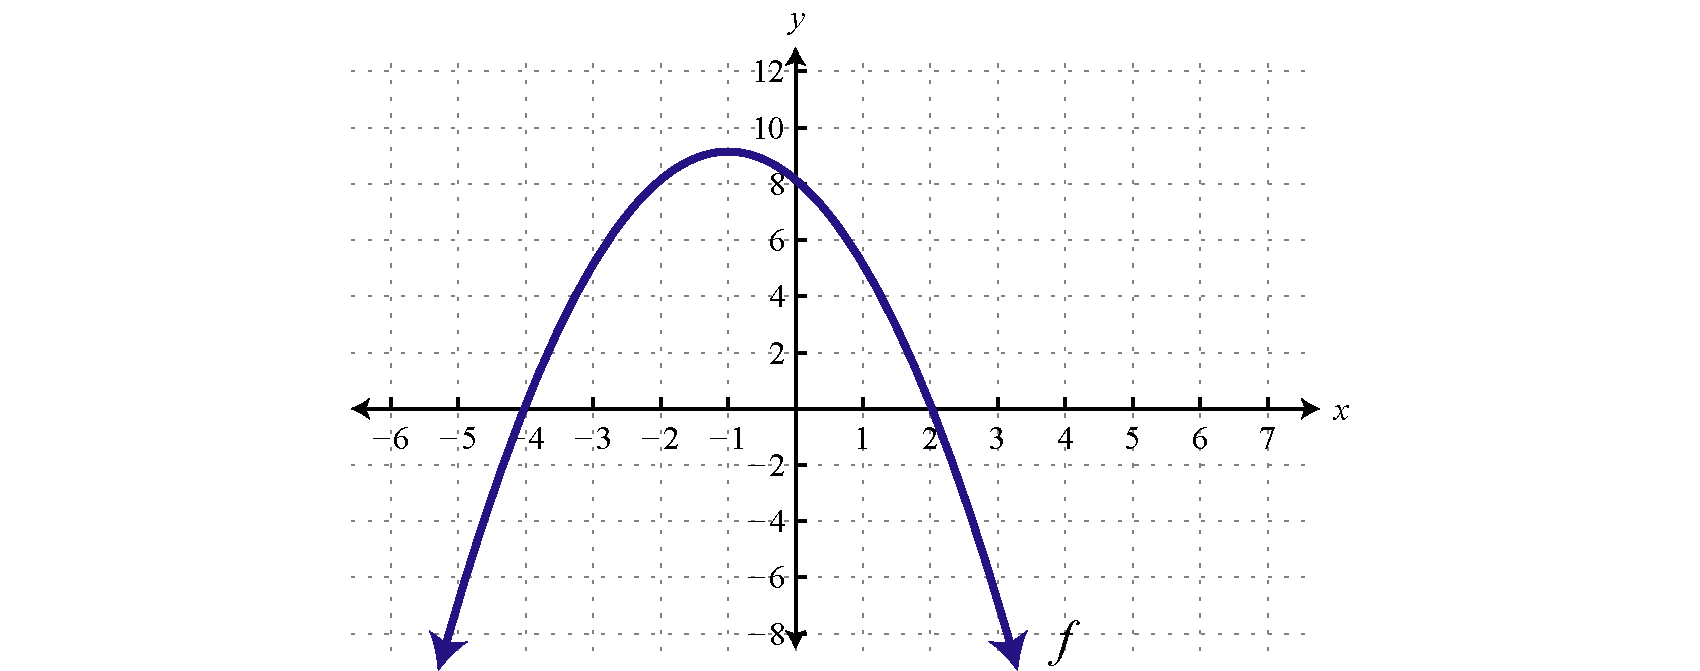
Graphing the function defined by y=x2−x−6 found in the previous example we have,
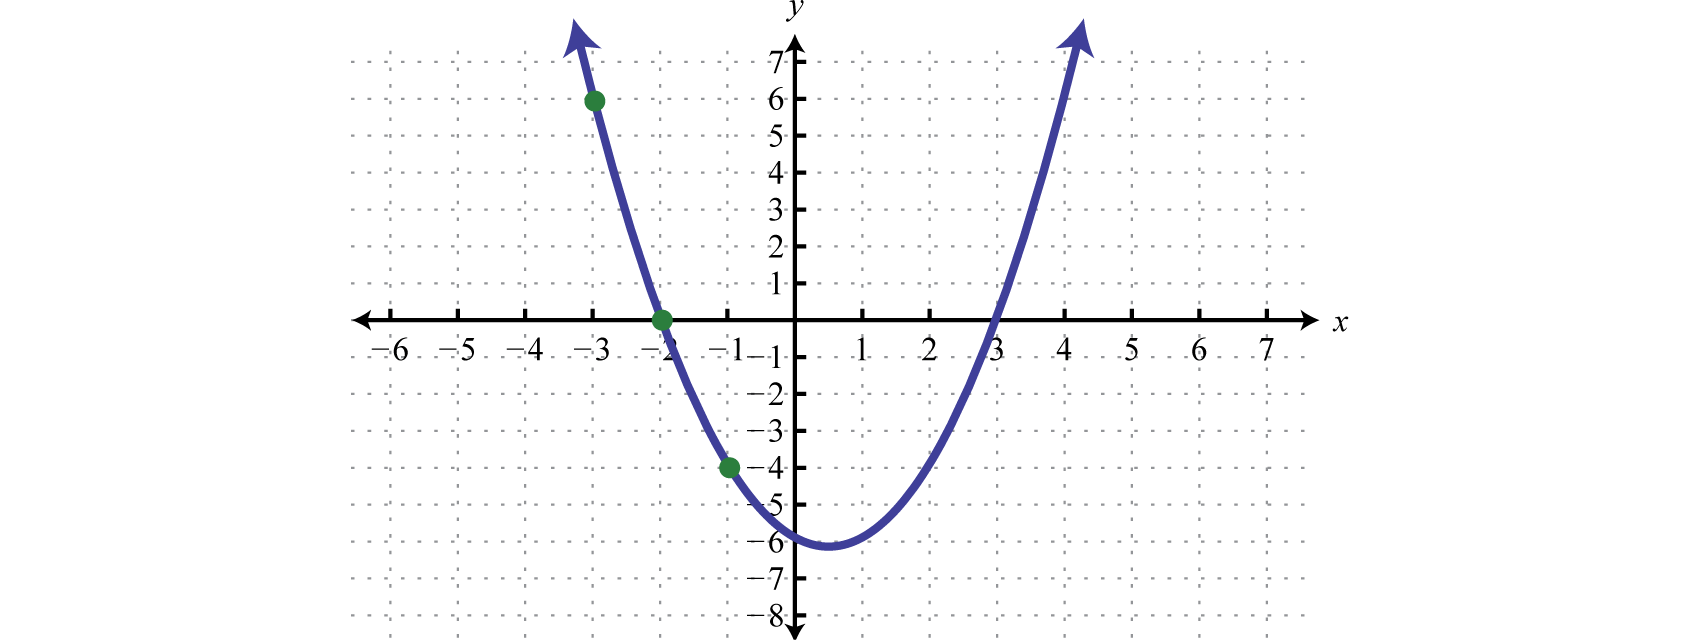
Notice that the x-intercepts are at (−2,0) and (3,0). Remember that to find the x-intercepts of a function, set y=0. Finding them algebraically,
0=x2−x−60=(x+2)(x−3)x+2=0 orx−3=0x=−2 or x=3
The values -2 and 3 are called critical numbers. These values bound the regions where the function is positive (above the x-axis) or negative (below the x-axis).
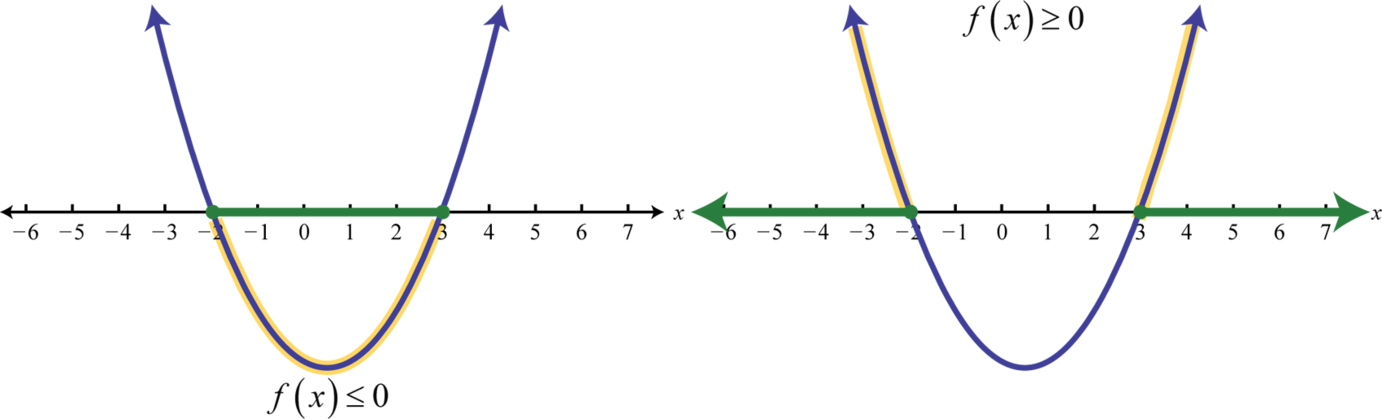
We can see that the function is below the x-axis between -2 and 3. Therefore x2−x−6≤0 has solutions where −2≤x≤3, using interval notation [−2,3]. Furthermore, x2−x−6≥0 has solutions where x≤−2 or x≥3, using interval notation (−∞,−2]∪[−3,∞).
Given the graph of f(x) determine the solutions to f(x)>0:
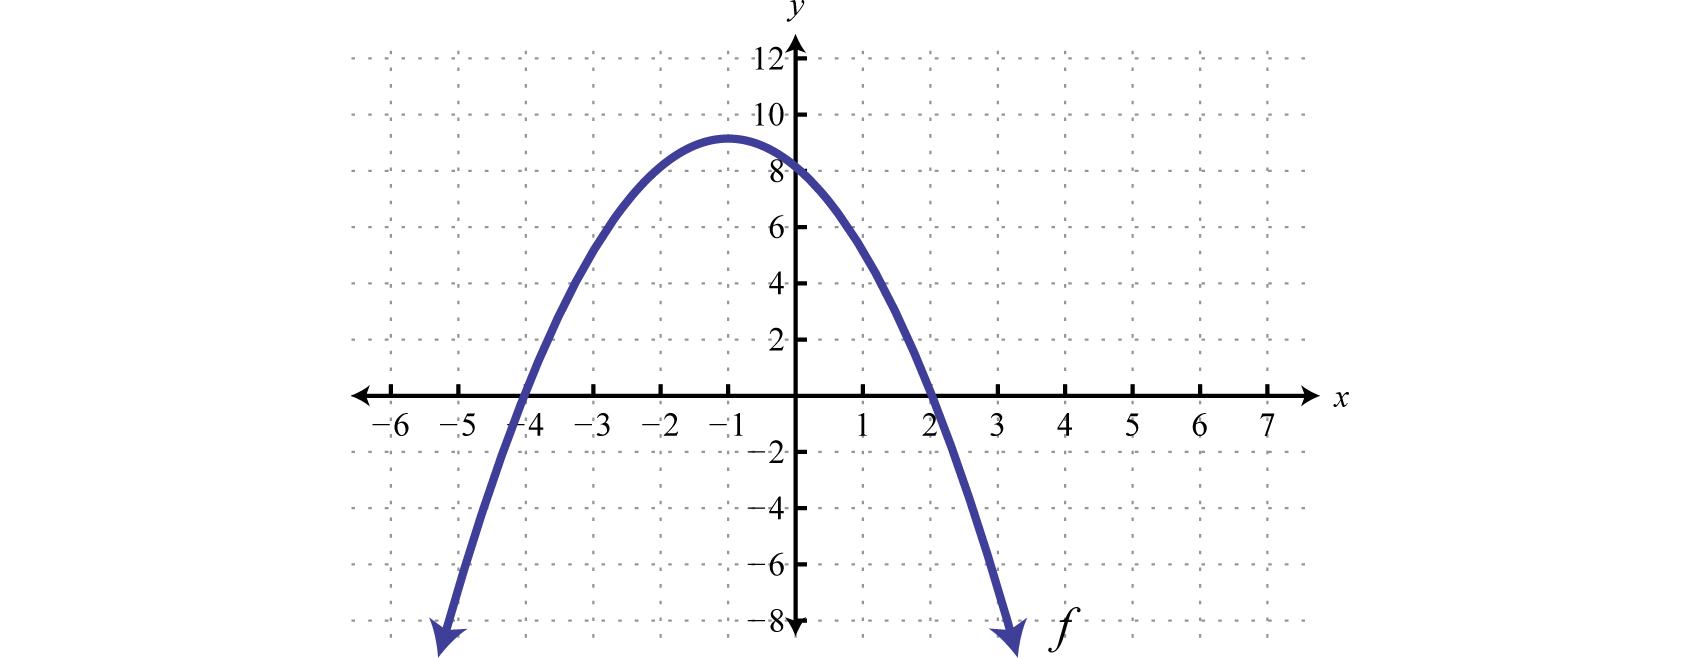
Because of the strict inequality, the solution set is shaded with an open dot on each of the boundaries. This indicates that these critical numbers are not actually included in the solution set. This solution set can be expressed two ways,
{x|−4<x<2}SetNotation(−4,2)IntervalNotation
In this textbook, we will continue to present answers in interval notation.
Answer:
(−4,2)
Use the graph of f to determine the solutions to f(x)≤0. State answer in interval notation.
- Answer
-
(−∞,−4]∪[2,∞)
Solving Polynomial Inequalities Using Sign Charts
A polynomial inequality is a mathematical statement that relates a polynomial expression as either less than or greater than another.
Some examples of polynomial inequalities: (3x+1)(x−2)<0,t3+30≥7t2+7t
We have seen how to solve an inequality graphically. To solve inequalities without graphing, we make use of a sign chart which models a function using a number line that represents the x-axis and signs (+ or −) to indicate where the function is positive or negative. For example,
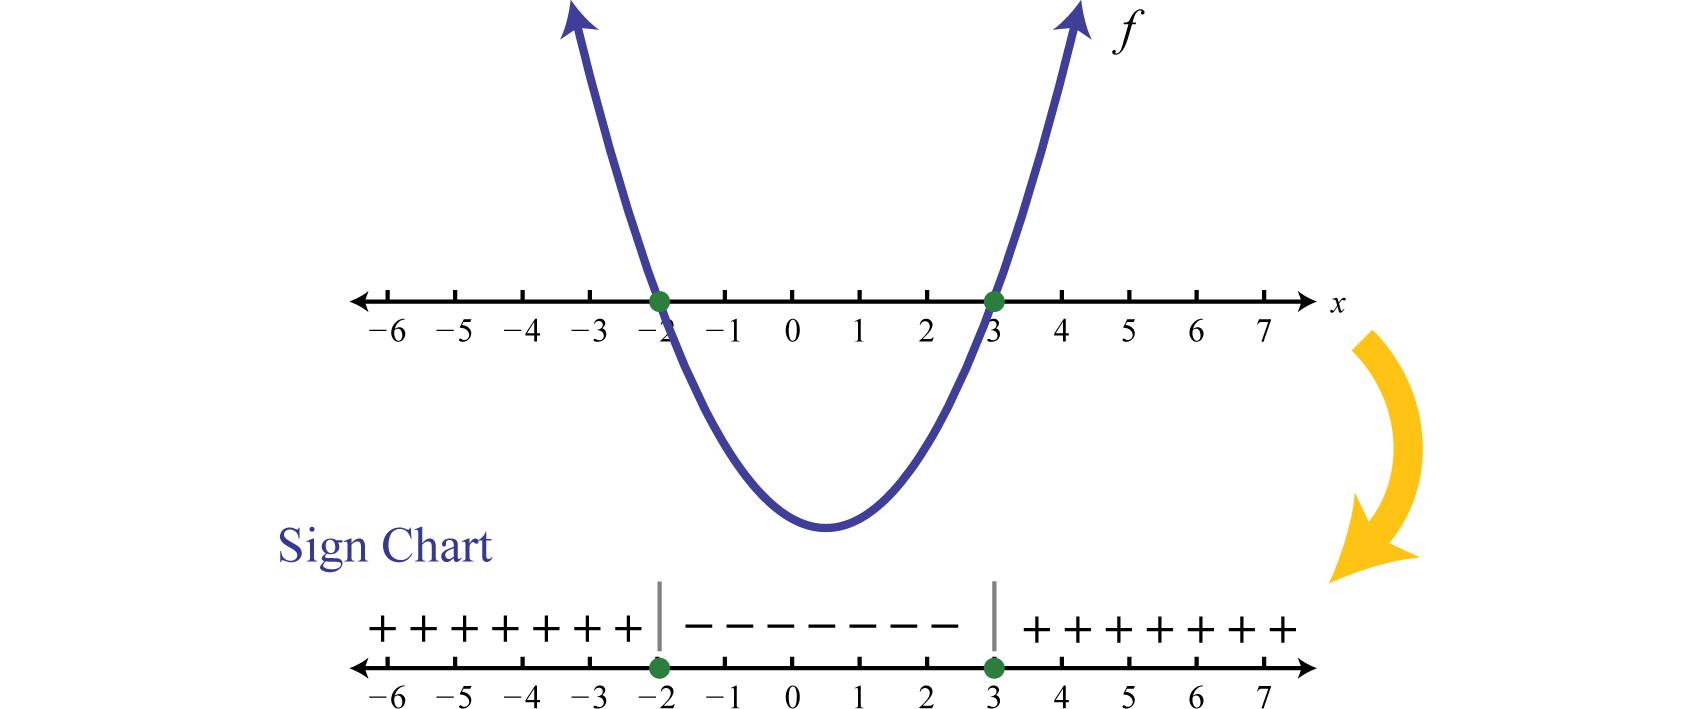
The plus signs indicate that the function is positive on the region. The negative signs indicate that the function is negative on the region. The boundaries are the critical numbers, −2 and 3 in this case. Sign charts are useful when a detailed picture of the graph is not needed and are used extensively in higher level mathematics. The steps for solving a polynomial inequality with one variable are outlined in the following example.
Solve: −x2+6x+7≥0.
Solution
It is important to note that this quadratic polynomial inequality is in standard form, with zero on one side of the inequality. Zero must be on one side of the inequality to be able to find the critical numbers in the next step.
Step 1: Determine the critical numbers. To find them, set the function equal to zero and solve.
−x2+6x+7=0
−(x2−6x−7)=0
−(x+1)(x−7)=0
x+1=0 or x−7=0x=−1x=7
The critical numbers are −1 and 7.
Step 2: Create a sign chart by putting the critical numbers on a number line. Since the critical numbers bound the regions where the function is positive or negative, we need to test a single value in each region. In this case, the critical numbers partition the number line into three regions. We choose test values x=−3,x=0, and x=10.

Test values may vary. In fact, we need only determine the sign (+ or −) of the result when evaluating f(x)=−x2+6x+7=−(x+1)(x−7). Here we evaluate using the factored form.
f(−3)=−(−3+1)(−3−7)=−(−2)(−10)=−Negativef(0)=−(0+1)(0−7)=−(1)(−7)=+Positivef(10)=−(10+1)(10−7)=−(11)(3)=−Negative
Since the result of evaluating for −3 was negative, we place negative signs above the first region. The result of evaluating for 0 was positive, so we place positive signs above the middle region. Finally, the result of evaluating for 10 was negative, so we place negative signs above the last region, and the sign chart is complete.

Step 3: Use the sign chart to answer the question. In this case, we are asked to determine where f(x)≥0, or where the function is positive or zero. From the sign chart we see this occurs when x-values are inclusively between −1 and 7.

Using interval notation, the answer is expressed as [−1,7].
The graph is not required; however, for the sake of completeness it is provided below.
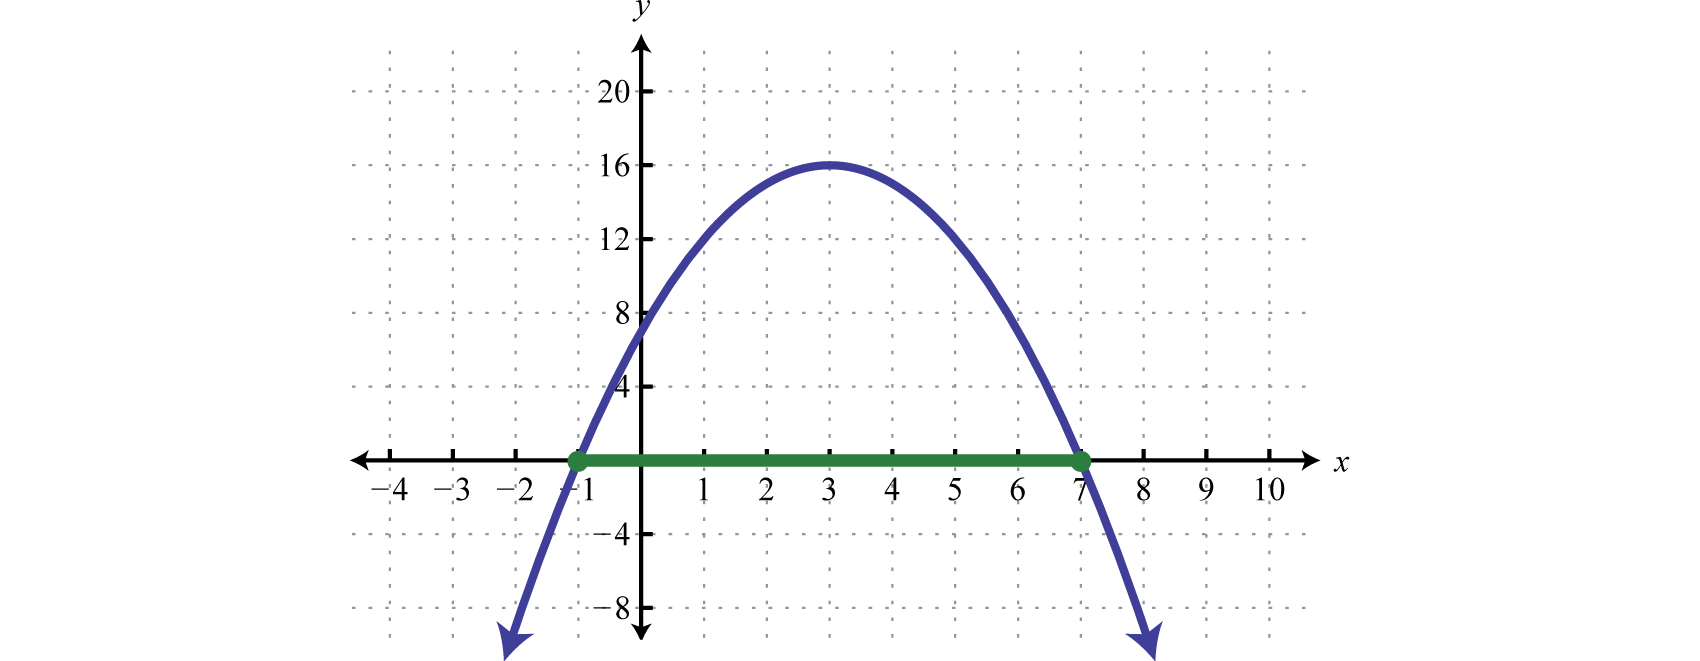
Indeed the function is greater than or equal to zero, above or on the x-axis, for x-values in the specified interval.
Answer:
[−1,7]
Before looking at another example it is important to note that there are multiple ways to set up sign charts. Some like to set up sign charts and evaluate each factor individually. Below is an example of a sign chart set up this way:
| (- ∞, -1) | (-1,7) | (7, ∞) | |
|---|---|---|---|
| -1 | - | - | - |
| (x+1) | - | + | + |
| (x-7) | - | - | + |
| -(x+1)(x-7) | - | + | - |
Since -1 is a constant factor that is negative, we fill in negative signs everywhere for this factor. Notice that the factor x+1 changes sign, from negative to positive, at the critical number -1. This factor gave this critical value. Similarly, this is also true for the factor x-7 and critical value of 7.
Solve: 2x2−7x+3>0.
Solution
Begin by finding the critical numbers, in this case, the roots of f(x)=2x2−7x+3.
2x2−7x+3=0(2x−1)(x−3)=0
2x−1=0 or x−3=02x=1x=3x=12
The critical numbers are 12 and 3. Because of the strict inequality > we will use open dots.

Next choose a test value in each region and determine the sign after evaluating f(x)=2x2−7x+3=(2x−1)(x−3). Here we choose test values −1,2, and 5.
f(−1)=(2(−1)−1)(−1−3)=(−)(−)=+f(2)=(2(2)−1)(2−3)=(+)(−)=−f(5)=(2(5)−1)(5−3)=(+)(+)=+
And we can complete the sign chart.

The question asks us to find the x-values that produce positive results (greater than zero). Therefore, shade in the regions with a + over them. This is the solution set.

Answer:
(−∞,12)∪(3,∞)
Sometimes the quadratic function does not factor. In this case we can make use of the quadratic formula.
Solve: x2−2x−11≤0
Solution
Find the critical numbers.
x2−2x−11=0
Identify a,b, and c for use in the quadratic formula. Here a=1,b=−2, and c=−11. Substitute the appropriate values into the quadratic formula and then simplify.
x=−b±√b2−4ac2a=−(−2)±√(−2)2−4(1)(−11)2(1)=2±√482=2±4√32=1±2√3
Therefore the critical numbers are 1−2√3≈−2.5 and 1+2√3≈4.5. Use a closed dot on the number to indicate that these values will be included in the solution set.

Here we will use test values −5,0, and 7.
f(−5)=(−5)2−2(−5)−11=25+10−11=+f(0)=(0)2−2(0)−11=0+0−11=−f(7)=(7)2−2(7)−11=49−14−11=+
After completing the sign chart shade in the values where the function is negative as indicated by the question (f(x)≤0).

Answer:
[1−2√3,1+2√3]
Solve: 9−x2>0.
- Answer
-
(−3,3)
It may be the case that there are no critical numbers.
Solve: x2−2x+3>0.
Solution
To find the critical numbers solve,
Substitute a=1,b=−2, and c=3 into the quadratic formula and then simplify.
Because the solutions are not real, we conclude there are no real roots; hence there are no critical numbers. When this is the case, the graph has no x-intercepts and is completely above or below the x-axis. We can test any value to create a sign chart. Here we choose x=0.
f(0)=(0)2−2(0)+3=+
Because the test value produced a positive result the sign chart looks as follows:

We are looking for the values where f(x)>0; the sign chart implies that any real number for x will satisfy this condition.

Answer:
(−∞,∞)
The function in the previous example is graphed below.
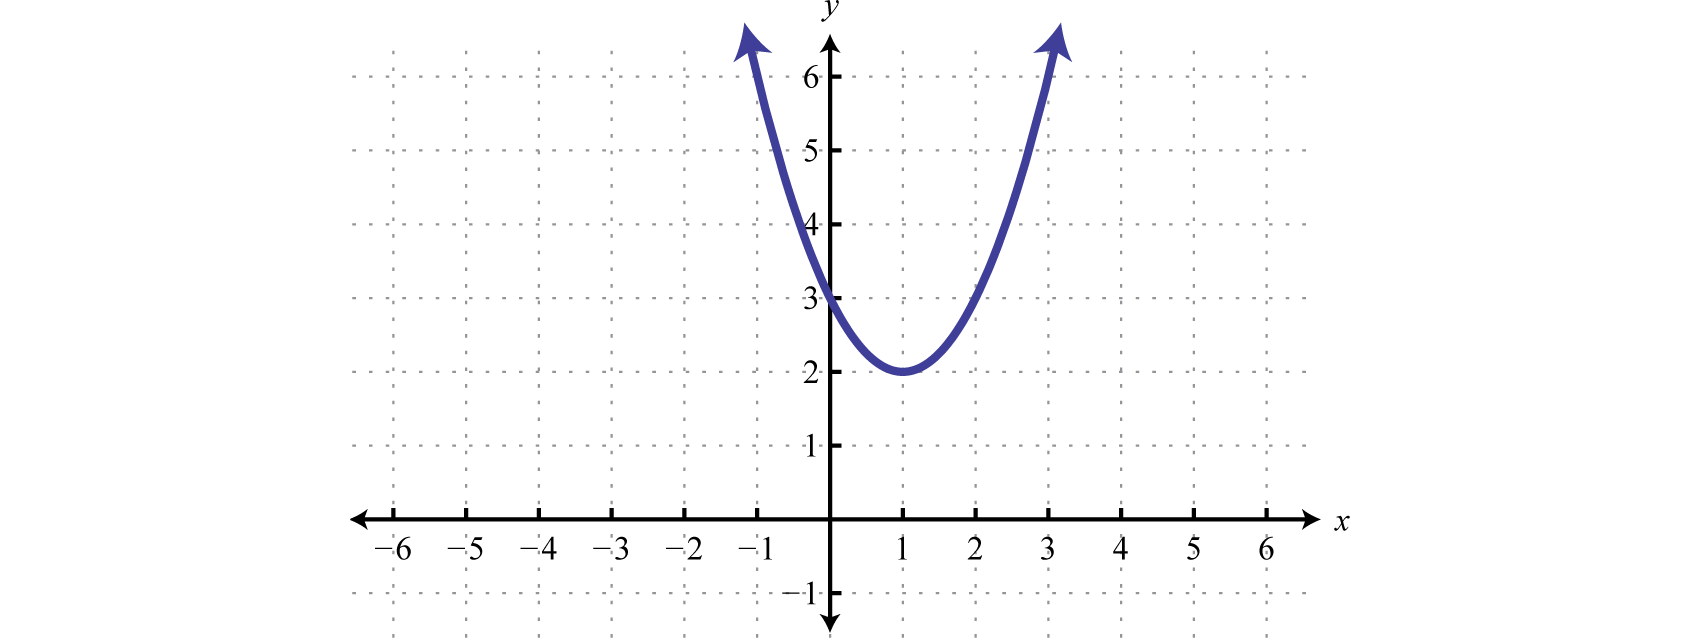
We can see that it has no x-intercepts and is always above the x-axis (positive). If the question was to solve x2−2x+3<0, then the answer would have been no solution. The function is never negative.
Solve: 9x2−12x+4≤0
- Answer
-
One solution, 23.
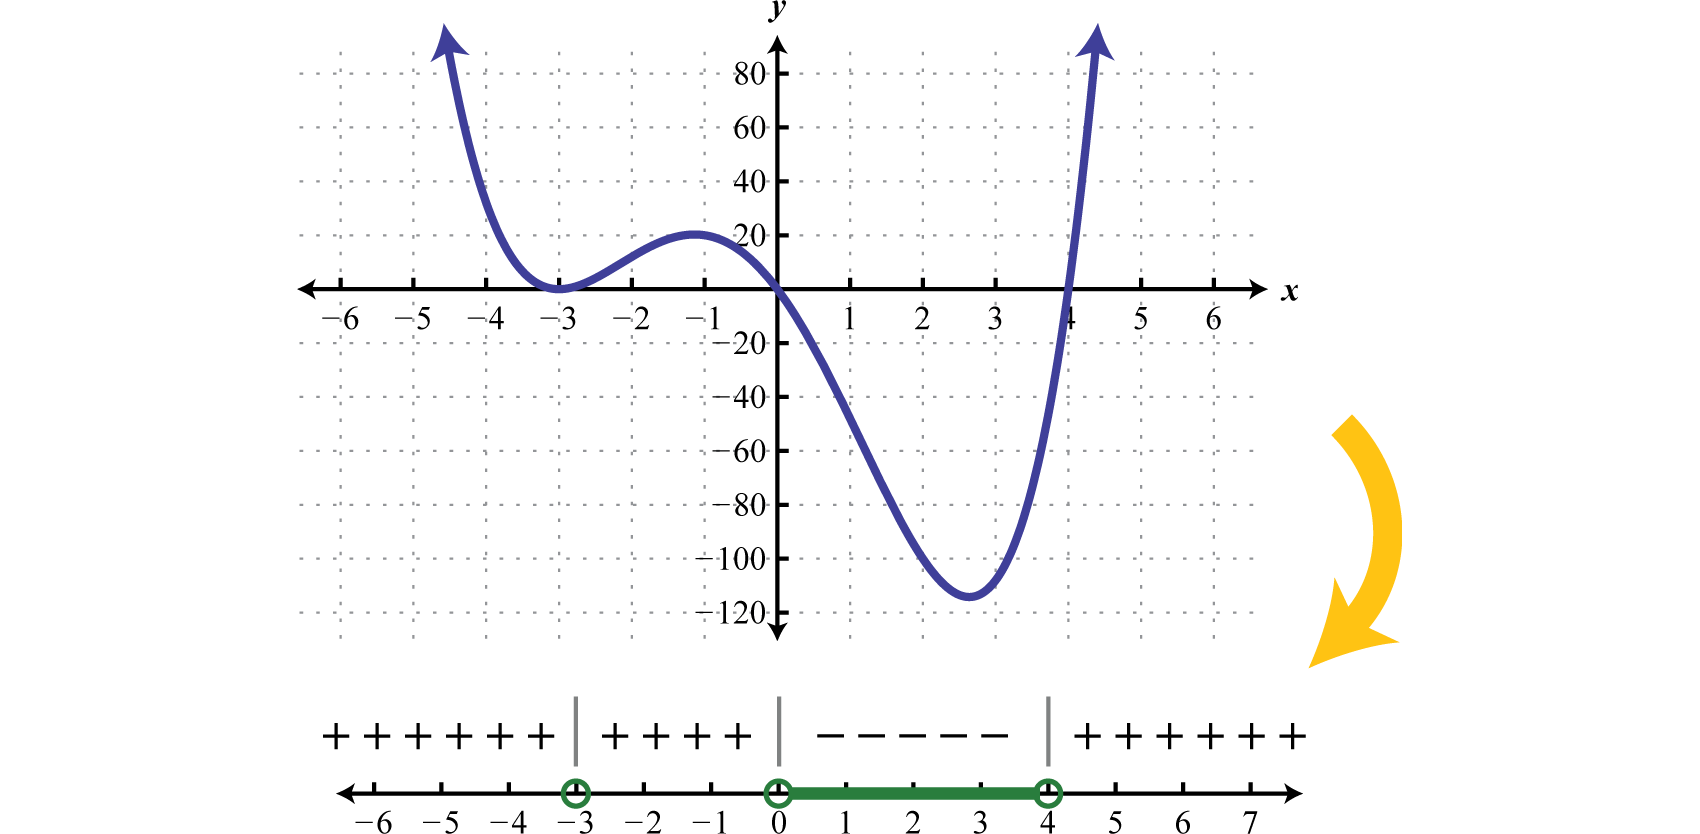
Solve x(x+3)2(x−4)<0.
Solution
Begin by finding the critical numbers. Because f(x)=x(x+3)2(x−4) is given in its factored form and zero is on one side of the inequality, the critcal numbers are apparent. Here the critical values are: 0,−3, and 4. Because of the strict inequality, plot them using open dots on a number line.

In this case, the critical numbers partition the number line into four regions. Test values in each region to determine if f is positive or negative. Here we choose test values −5,−1,2, and 6. Remember that we are only concerned with the sign (+ or −) of the result.
f(−5)=(−5)(−5+3)2(−5−4)=(−)(−)2(−)=+Positivef(−1)=(−1)(−1+3)2(−1−4)=(−)(+)2(−)=+Positivef(2)=(2)(2+3)2(2−4)=(+)(+)2(−)=−Negativef(6)=(6)(6+3)2(6−4)=(+)(+)2(+)=+Positive
After testing values we can complete a sign chart.

The question asks us to find the values where f(x)<0, or where the function is negative. From the sign chart we can see that the function is negative for x-values in between 0 and 4.

Answer:
(0,4)
Although we have not discussed the graphs of polynomial functions yet, the graph of this function is provided below. Compare the graph to its corresponding sign chart.
Certainly it may not be the case that the polynomial is factored nor that it has zero on one side of the inequality. To model a function using a sign chart, all of the terms should be on one side and zero on the other. The general steps for solving a polynomial inequality are listed in the following example.
Solve: 2x4>3x3+9x2.
Solution
Step 1: Obtain zero on one side of the inequality. In this case, subtract to obtain a polynomial on the left side in standard from.
2x4>3x3+9x22x4−3x3−9x2>0
Step 2: Find the critical numbers. Here we can find the zeros by factoring.
2x4−3x3−9x2=0
x2(2x2−3x−9)=0
x2(2x+3)(x−3)=0
There are three solutions, hence, three critical numbers −32,0, and 3. The strict inequality indicates that we should use open dots.

Step 3: Create a sign chart. In this case use f(x)=x2(2x+3)(x−3) and test values −2,−1,1, and 4 to determine the sign of the function in each interval.
f(−2)=(−2)2(2(−2)+3)(−2−3)=(−)2(−)(−)=+f(−1)=(−1)2(2(−1)+3)(−1−3)=(−)2(+)(−)=−f(1)=(1)2(2(1)+3)(1−3)=(+)2(+)(−)=−f(4)=(4)2(2(4)+3)(4−3)=(+)2(+)(+)=+
With this information we can complete the sign chart.

Step 4: Use the sign chart to answer the question. Here the solution consists of all values for which f(x)>0. Shade in the values that produce positive results and then express this set in interval notation.

Answer:
(−∞,−32)∪(3,∞)
Solve: x3+x2≤4(x+1).
Solution
Begin by rewriting the inequality in standard form, with zero on one side.
x3+x2≤4(x+1)x3+x2≤4x+4x3+x2−4x−4≤0
Next find the critical numbers of f(x)=x3+x2−4x−4:
x3+x2−4x−4=0Factorbygrouping.x2(x+1)−4(x+1)=0(x+1)(x2−4)=0(x+1)(x+2)(x−2)=0
The critical numbers are −2,−1, and 2. Because of the inclusive inequality (≤) we will plot them using closed dots.

Use test values, −3, −32, 0, and 3 to create a sign chart.
f(−3)=(−3+1)(−3+2)(−3−2)=(−)(−)(−)=−f(−32)=(−32+1)(−32+2)(−32−2)=(−)(+)(−)=+f(0)=(0+1)(0+2)(0−2)=(+)(+)(−)=−f(3)=(3+1)(3+2)(3−2)=(+)(+)(+)=+
And we have

Use the sign chart to shade in the values that have negative results (f(x)≤0).

Answer
(−∞,−2]∪[−1,2]
Solve −3x4+12x3−9x2>0.
- Answer
-
(1,3)
Solving Rational Inequalities Using Sign Charts
A rational inequality is a mathematical statement that relates a rational expression as either less than or greater than another. Because rational functions have restrictions to the domain, which we will discuss more in the next section, we must take care when solving rational inequalities. In addition to the zeros, we will include the restrictions to the domain of the function which are values that make the denominator zero in the set of critical numbers.
Solve: (x−4)(x+2)(x−1)≥0
Solution
The zeros of a rational function occur when the numerator is zero, provided they are unique to the numerator, and the values that produce zero in the denominator are the restrictions. In this case,
Roots (Numerator) Restriction(Denominator)x−4=0 or x+2=0x−1=0x=4x=−2x=1
Therefore the critical numbers are −2,1, and 4. Because of the inclusive inequality (≥) use a closed dot for the roots −2,4 and always use an open dot for restrictions 1. Restrictions are never included in the solution set.

Use test values x=−4,0,2,6.
f(−4)=(−4−4)(−4+2)(−4−1)=(−)(−)(−)=−f(0)=(0−4)(0+2)(0−1)=(−)(+)(−)=+f(2)=(2−4)(2+2)(2−1)=(−)(+)(+)=−f(6)=(6−4)(6+2)(6−1)=(+)(+)(+)=+
And then complete the sign chart.

The question asks us to find the values for which f(x)≥0, in other words, positive or zero. Shade in the appropriate regions and present the solution set in interval notation.

Answer
[−2,1)∪[4,∞)
Although we have not learned about the graphs of rational functions yet, the graph of this function is provided below. Compare the graph to its corresponding sign chart above.
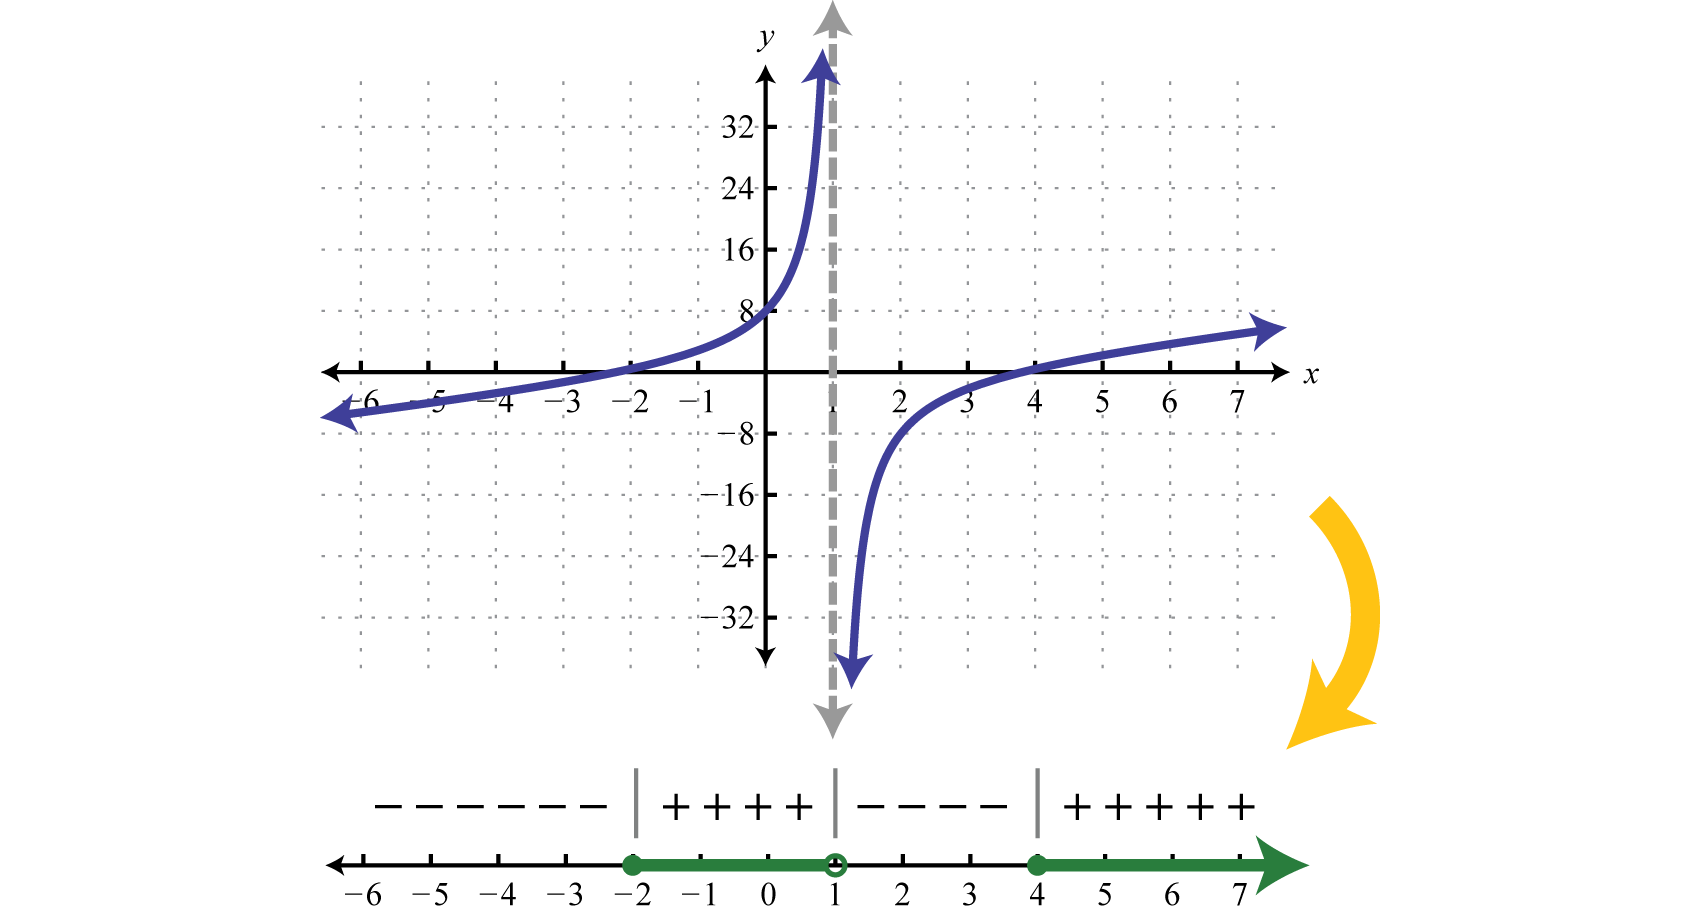
Notice that the restriction x=1 corresponds to a place where the function values get very large and also very small. This is called a vertical asymptote which bounds regions where the function changes from positive to negative. While not included in the solution set because it makes the denominator zero, this value is a critical number. Before creating a sign chart we must ensure the inequality has a zero on one side. The general steps for solving a rational inequality are outlined in the following example.
Solve 7x+3<2.
Solution
Step 1: Begin by obtaining zero on the right side.
7x+3<27x+3−2<0
Step 2: Determine the critical numbers. The critical numbers are the zeros and restrictions. Begin by simplifying to a single algebraic fraction.
7x+3−21<07−2(x+3)x+3<07−2x−6x+3<0−2x+1x+3<0
Next find the critical numbers. Set the numerator and denominator equal to zero and solve.
RootRestriction−2x+1=0−2x=−1x+3=0x=12x=−3
In this case, the strict inequality indicates that we should use an open dot for the root.

Step 3: Create a sign chart. Choose test values −4,0, and 1.
f(−4)=−2(−4)+1−4+3=+−=−f(0)=−2(0)+10+3=++=+f(1)=−2(1)+11+3=−+=−
And we have

Step 4: Use the sign chart to answer the question. In this example we are looking for the values for which the function is negative, f(x)<0. Shade the appropriate values and then present your answer using interval notation.

Answer:
(−∞,−3)∪(12,∞)
Solve: 1x2−4≤12−x.
Solution
Begin by obtaining zero on the right side.
1x2−4≤12−x1x2−4−12−x≤0
Next simplify the left side to a single algebraic fraction.
1x2−4−12−x≤01(x+2)(x−2)−1−(x−2)≤01(x+2)(x−2)+1(x+2)(x−2)(x+2)≤01+x+2(x+2)(x−2)≤0x+3(x+2)(x−2)≤0
The critical numbers are −3,−2, and 2. Note that ±2 are restrictions and thus we will use open dots when plotting them on a number line. Because of the inclusive inequality we will use a closed dot at the root −3.

Choose test values -4, -2\dfrac{1}{2} = -\dfrac{5}{2}, 0, and 3.
\begin{aligned}f(\color{OliveGreen}{-4}\color{black}{)}&= \dfrac{\color{OliveGreen}{-4}\color{black}{+}3}{(\color{OliveGreen}{-4}\color{black}{+}2)(\color{OliveGreen}{-4}\color{black}{-}2)}&=\dfrac{(-)}{(-)(-)}=- \\ f(\color{OliveGreen}{-\dfrac{5}{2}}\color{black}{)} &= \dfrac{\color{OliveGreen}{-\dfrac{5}{2}}\color{black}{+}3}{(\color{OliveGreen}{-\dfrac{5}{2}}\color{black}{+}2)(\color{OliveGreen}{-\dfrac{5}{2}}\color{black}{-}2)}&=\dfrac{(+)}{(-)(-)}=+\\ f(\color{OliveGreen}{0}\color{black}{)}&=\dfrac{\color{OliveGreen}{0}\color{black}{+}3}{(\color{OliveGreen}{0}\color{black}{+}2)(\color{OliveGreen}{0}\color{black}{-}2)}&=\dfrac{(+)}{(+)(-)}=- \\ f(\color{OliveGreen}{3}\color{black}{)}&=\dfrac{\color{OliveGreen}{3}\color{black}{+}3}{(\color{OliveGreen}{3}\color{black}{+}2)(\color{OliveGreen}{3}\color{black}{-}2)} &=\dfrac{(+)}{(+)(+)}=+\end{aligned}
Construct a sign chart.
Answer the question; in this case, find x where f(x) \leq 0.

Answer
(-\infty,-3] \cup(-2,2)
Solve: \dfrac{2 x^{2}}{2 x^{2}+7 x-4} \geq \dfrac{x}{x+4}.
- Answer
-
(-4,0] \cup\left(\dfrac{1}{2}, \infty\right)