7.6: Pie Charts
- Page ID
- 47273
\( \newcommand{\vecs}[1]{\overset { \scriptstyle \rightharpoonup} {\mathbf{#1}} } \)
\( \newcommand{\vecd}[1]{\overset{-\!-\!\rightharpoonup}{\vphantom{a}\smash {#1}}} \)
\( \newcommand{\dsum}{\displaystyle\sum\limits} \)
\( \newcommand{\dint}{\displaystyle\int\limits} \)
\( \newcommand{\dlim}{\displaystyle\lim\limits} \)
\( \newcommand{\id}{\mathrm{id}}\) \( \newcommand{\Span}{\mathrm{span}}\)
( \newcommand{\kernel}{\mathrm{null}\,}\) \( \newcommand{\range}{\mathrm{range}\,}\)
\( \newcommand{\RealPart}{\mathrm{Re}}\) \( \newcommand{\ImaginaryPart}{\mathrm{Im}}\)
\( \newcommand{\Argument}{\mathrm{Arg}}\) \( \newcommand{\norm}[1]{\| #1 \|}\)
\( \newcommand{\inner}[2]{\langle #1, #2 \rangle}\)
\( \newcommand{\Span}{\mathrm{span}}\)
\( \newcommand{\id}{\mathrm{id}}\)
\( \newcommand{\Span}{\mathrm{span}}\)
\( \newcommand{\kernel}{\mathrm{null}\,}\)
\( \newcommand{\range}{\mathrm{range}\,}\)
\( \newcommand{\RealPart}{\mathrm{Re}}\)
\( \newcommand{\ImaginaryPart}{\mathrm{Im}}\)
\( \newcommand{\Argument}{\mathrm{Arg}}\)
\( \newcommand{\norm}[1]{\| #1 \|}\)
\( \newcommand{\inner}[2]{\langle #1, #2 \rangle}\)
\( \newcommand{\Span}{\mathrm{span}}\) \( \newcommand{\AA}{\unicode[.8,0]{x212B}}\)
\( \newcommand{\vectorA}[1]{\vec{#1}} % arrow\)
\( \newcommand{\vectorAt}[1]{\vec{\text{#1}}} % arrow\)
\( \newcommand{\vectorB}[1]{\overset { \scriptstyle \rightharpoonup} {\mathbf{#1}} } \)
\( \newcommand{\vectorC}[1]{\textbf{#1}} \)
\( \newcommand{\vectorD}[1]{\overrightarrow{#1}} \)
\( \newcommand{\vectorDt}[1]{\overrightarrow{\text{#1}}} \)
\( \newcommand{\vectE}[1]{\overset{-\!-\!\rightharpoonup}{\vphantom{a}\smash{\mathbf {#1}}}} \)
\( \newcommand{\vecs}[1]{\overset { \scriptstyle \rightharpoonup} {\mathbf{#1}} } \)
\(\newcommand{\longvect}{\overrightarrow}\)
\( \newcommand{\vecd}[1]{\overset{-\!-\!\rightharpoonup}{\vphantom{a}\smash {#1}}} \)
\(\newcommand{\avec}{\mathbf a}\) \(\newcommand{\bvec}{\mathbf b}\) \(\newcommand{\cvec}{\mathbf c}\) \(\newcommand{\dvec}{\mathbf d}\) \(\newcommand{\dtil}{\widetilde{\mathbf d}}\) \(\newcommand{\evec}{\mathbf e}\) \(\newcommand{\fvec}{\mathbf f}\) \(\newcommand{\nvec}{\mathbf n}\) \(\newcommand{\pvec}{\mathbf p}\) \(\newcommand{\qvec}{\mathbf q}\) \(\newcommand{\svec}{\mathbf s}\) \(\newcommand{\tvec}{\mathbf t}\) \(\newcommand{\uvec}{\mathbf u}\) \(\newcommand{\vvec}{\mathbf v}\) \(\newcommand{\wvec}{\mathbf w}\) \(\newcommand{\xvec}{\mathbf x}\) \(\newcommand{\yvec}{\mathbf y}\) \(\newcommand{\zvec}{\mathbf z}\) \(\newcommand{\rvec}{\mathbf r}\) \(\newcommand{\mvec}{\mathbf m}\) \(\newcommand{\zerovec}{\mathbf 0}\) \(\newcommand{\onevec}{\mathbf 1}\) \(\newcommand{\real}{\mathbb R}\) \(\newcommand{\twovec}[2]{\left[\begin{array}{r}#1 \\ #2 \end{array}\right]}\) \(\newcommand{\ctwovec}[2]{\left[\begin{array}{c}#1 \\ #2 \end{array}\right]}\) \(\newcommand{\threevec}[3]{\left[\begin{array}{r}#1 \\ #2 \\ #3 \end{array}\right]}\) \(\newcommand{\cthreevec}[3]{\left[\begin{array}{c}#1 \\ #2 \\ #3 \end{array}\right]}\) \(\newcommand{\fourvec}[4]{\left[\begin{array}{r}#1 \\ #2 \\ #3 \\ #4 \end{array}\right]}\) \(\newcommand{\cfourvec}[4]{\left[\begin{array}{c}#1 \\ #2 \\ #3 \\ #4 \end{array}\right]}\) \(\newcommand{\fivevec}[5]{\left[\begin{array}{r}#1 \\ #2 \\ #3 \\ #4 \\ #5 \\ \end{array}\right]}\) \(\newcommand{\cfivevec}[5]{\left[\begin{array}{c}#1 \\ #2 \\ #3 \\ #4 \\ #5 \\ \end{array}\right]}\) \(\newcommand{\mattwo}[4]{\left[\begin{array}{rr}#1 \amp #2 \\ #3 \amp #4 \\ \end{array}\right]}\) \(\newcommand{\laspan}[1]{\text{Span}\{#1\}}\) \(\newcommand{\bcal}{\cal B}\) \(\newcommand{\ccal}{\cal C}\) \(\newcommand{\scal}{\cal S}\) \(\newcommand{\wcal}{\cal W}\) \(\newcommand{\ecal}{\cal E}\) \(\newcommand{\coords}[2]{\left\{#1\right\}_{#2}}\) \(\newcommand{\gray}[1]{\color{gray}{#1}}\) \(\newcommand{\lgray}[1]{\color{lightgray}{#1}}\) \(\newcommand{\rank}{\operatorname{rank}}\) \(\newcommand{\row}{\text{Row}}\) \(\newcommand{\col}{\text{Col}}\) \(\renewcommand{\row}{\text{Row}}\) \(\newcommand{\nul}{\text{Nul}}\) \(\newcommand{\var}{\text{Var}}\) \(\newcommand{\corr}{\text{corr}}\) \(\newcommand{\len}[1]{\left|#1\right|}\) \(\newcommand{\bbar}{\overline{\bvec}}\) \(\newcommand{\bhat}{\widehat{\bvec}}\) \(\newcommand{\bperp}{\bvec^\perp}\) \(\newcommand{\xhat}{\widehat{\xvec}}\) \(\newcommand{\vhat}{\widehat{\vvec}}\) \(\newcommand{\uhat}{\widehat{\uvec}}\) \(\newcommand{\what}{\widehat{\wvec}}\) \(\newcommand{\Sighat}{\widehat{\Sigma}}\) \(\newcommand{\lt}{<}\) \(\newcommand{\gt}{>}\) \(\newcommand{\amp}{&}\) \(\definecolor{fillinmathshade}{gray}{0.9}\)In this section we turn our attention to pie charts, but before we do, we need to establish some fundamentals regarding measurement of angles.
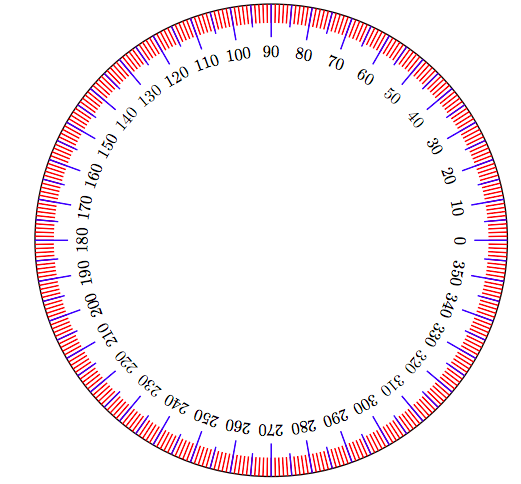
If you take a circle and divide it into 360 equal increments, then each increment is called one degree (1◦). See Figure 7.2.
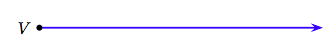
A ray is a line that starts at a point and then extends indefinitely in one direction. The starting point of the ray is called its vertex.
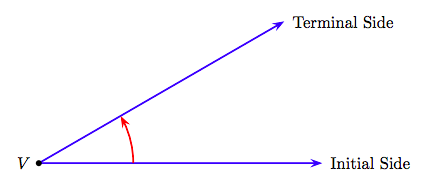
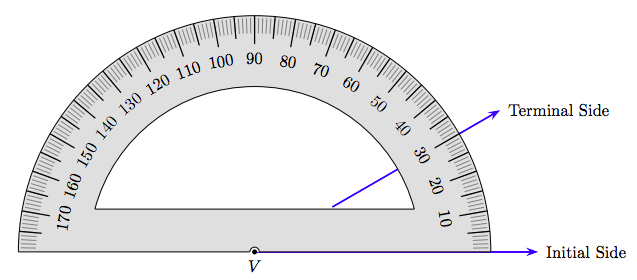
If two rays have a common vertex, they form what is called an angle. In Figure 7.4 we’ve labeled the first ray as the “Initial Side” of the angle, and the second as the “Terminal Side” of the angle.
We can find the degree measure of the angle by using a device called a protractor. Align the notch in the center of the base of the protractor with the vertex of the angle, then align the base of the protractor with the initial side of the angle. The terminal side of the angle will intersect the protractor edge where we can read the degree measure of the angle (see Figure 7.5). In Figure 7.5, note that the terminal side of the angle passes through the tick mark at the number 30, indicating that the degree measure of this angle is 30◦.
Pie Charts
Now that we can measure angles, we can turn our attention to constructing pie charts.
A pie chart is a circular chart that is divided into sectors, each sector representing a particular quantity. The area of each sector is a percentage of the area of the whole circle and is determined by calculating the quantity it represents as a percentage of the whole.
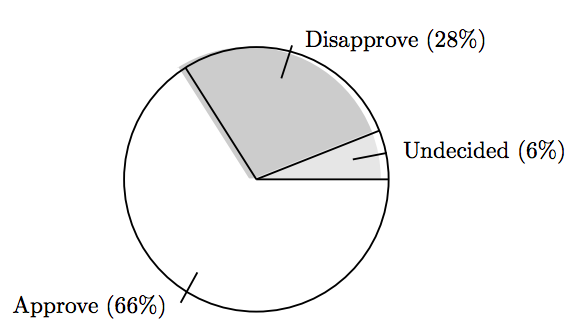
In a recent Gallup poll, 66% of those polled approved of the President’s job performance, 28% disapproved, and 6% were undecided. Create a pie chart that displays these percentages.
Solution
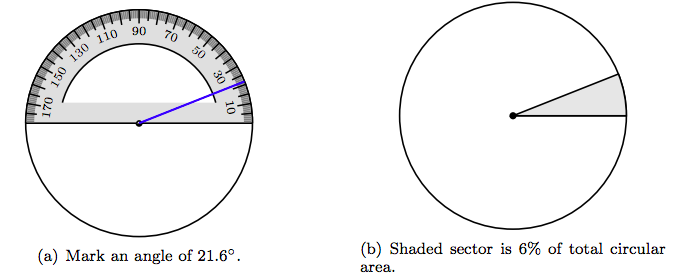
Let’s begin with 6% undecided. We want to create a sector that is 6% of the area of the whole circle. There are 360 degrees in a full circle, so 6% of this number is
\[ \begin{aligned} 6 \% \cdot 360^{ \circ} & = 0.06 \cdot 360^{ \circ} \\ ~ & = 21.6^{ \circ}. \end{aligned}\nonumber \]
Start with a circle, set the baseline notch of the protractor on the center of the circle, then mark an angle of 21.6◦, as seen in Figure 7.6(a). Shade the resulting region as shown in Figure 7.6(b), called a sector, which represents 6% of the total area of the circle.
Next, 28% disapproved of the President’s job performance. Thus,
\[ \begin{aligned} 28 \% \cdot 360^{ \circ} & = 0.28 \cdot 360^{ \circ} \\ ~ & = 100.8^{ \circ}. \end{aligned}\nonumber \]
Therefore, a sector with a central angle of 100.8◦ will represent 28% job disapproval.
Place the notch on the baseline of your protractor on the center of the circle, then align the baseline of the protractor with the terminal side of the first angle, as shown in Figure 7.7(a). Mark a central angle of 100.8◦, as shown in Figure 7.7(a). Shade the resulting second sector with a darker shade of gray, as shown in Figure 7.7(b). This sector contains 28% of the total area of the circle and represents the portion of the polling sample that disapproved of the president’s job performance.
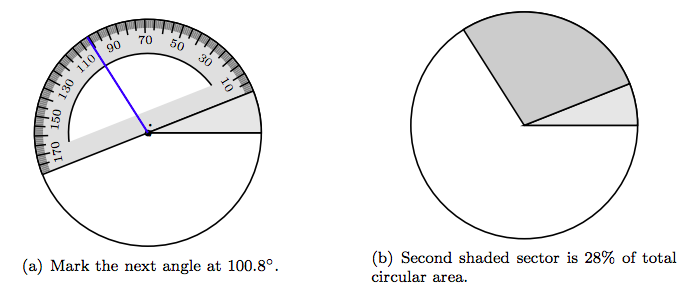
Finally, as we’ve shaded the sectors representing 6% and 28% of the polling data in Figure 7.7(b), the remaining sector in Figure 7.7(b), shaded in white, represents the 66% of the polling sample who approved of the president’s job performance (and 66% of the area of the whole circle).
Once you have computed and plotted the correct central angles for each of the sectors, you will want to label your pie chart. One possible annotation method is shown in Figure 7.8.
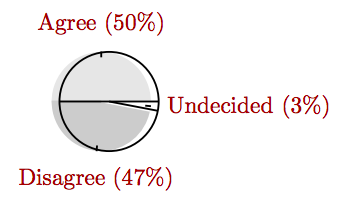
In a recent Gallup poll, 50% of the American public say it is the federal government’s responsibility to make sure all Americans have health care, 47% disagree, and 3% were undecided. Create a pie chart that displays these percentages.
- Answer
-
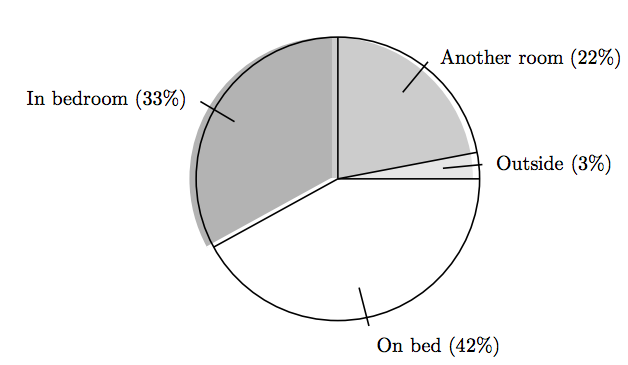
One thousand people were polled with the question “Where does your dog sleep during the night?” The responses are shown in the following table.
\[ \begin{array}{l|c} \text{Location } & \text{ Number} \\ \hline \text{Outside } & 30 \\ \text{Another Room } & 220 \\ \text{On the Bedroom Floor } & 330 \\ \text{On the Bed } & 420 \\ \hline \text{Totals } & 1000 \end{array}\nonumber \]
Create a pie chart showing the distribution of these responses.
Solution
The first step is to express the number in each location as a percentage of the totals. For example,
\[ \begin{array}{c c c c c} \colorbox{cyan}{Outside} & \text{ is } & \colorbox{cyan}{what percent} & \text{ of } & \colorbox{cyan}{total} \\ 30 & = & p & \cdot & 1000 \end{array}\nonumber \]
Solving for p,
\[ \begin{aligned} \frac{1000p}{1000} = \frac{30}{1000} ~ & \textcolor{red}{ \text{ Divide both sides by 1000.}} \\ p = 0.03 ~ & \textcolor{red}{ \text{ Divide: 30/1000 = 0.03.}} \end{aligned}\nonumber \]
Thus, p = 3%. In similar fashion, divide the number in each location by 1000 to find the following percents.
\[ \begin{array}{l|c} \text{Location } & \text{ Number } & \text{ Percent} \\ \hline \text{Outside } & 30 & 3 \% \\ \text{Another Room } & 220 & 22 \% \\ \text{On the Bedroom Floor } & 330 & 33 \% \\ \text{On the Bed } & 420 & 42 \% \\ \hline \text{Totals } & 1000 & 100 \% \end{array}\nonumber \]
Note that the individual percents must total 100%.
Let’s begin with the fact that 3% of the dog owners have their dogs sleep outside. To find the portion of the full circle that represents 3%, we take 3% of 360◦.
\[ \begin{aligned} 3 \% \cdot 360^{ \circ} & = 0.03 \cdot 360^{ \circ} \\ ~ & = 10.8^{ \circ} \end{aligned}\nonumber \]
Start with a circle, set the baseline notch of the protractor on the center of the circle, then mark an angle of 10.8◦, as seen in Figure 7.9(a).
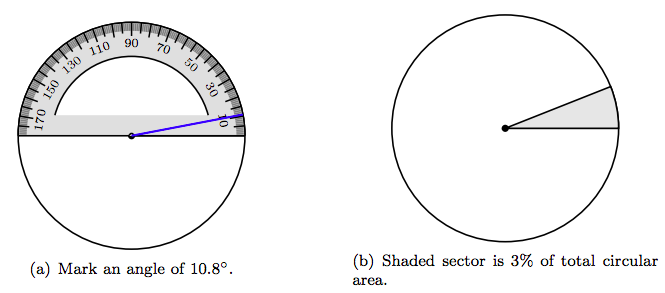
Shade the resulting sector as shown in Figure 7.9(b), which represents 3% of the total area of the circle.
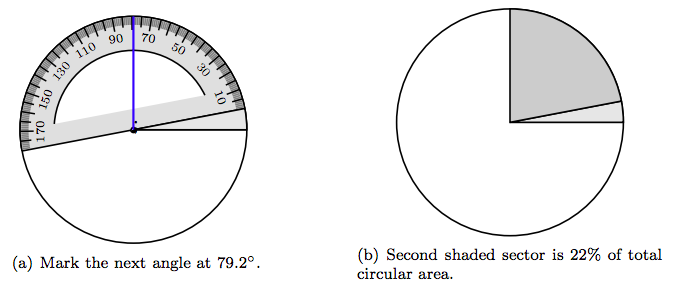
Next, 22% have their dog sleep in another room.
\[ \begin{aligned} 22 \% \cdot 360^{ \circ} & = 0.22 \cdot 360^{ \circ} \\ ~ & = 79.2^{ \circ}. \end{aligned}\nonumber \]
Therefore, a sector with a central angle of 79.2◦ will represent the fact that 22% of the dog owners have their dog sleep in another room.
Place the notch on the baseline of your protractor on the center of the circle, then align the baseline of the protractor with the terminal side of the first angle, as shown in Figure 7.10(a). Mark a central angle of 79.2◦, as shown in Figure 7.7(a). Shade the resulting second sector with a darker shade of gray, as shown in Figure 7.10(b). This sector contains 22% of the total area of the circle and represents the portion of the polling sample whose dog sleeps in another room.
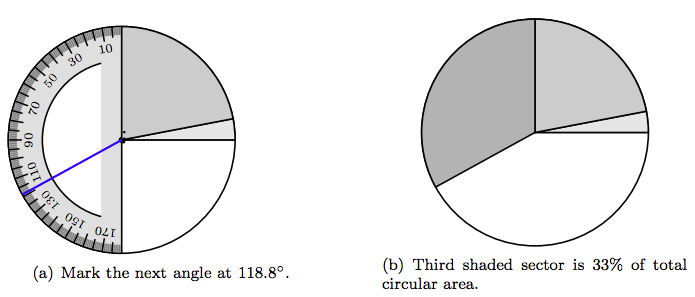
Next, 33% allow their dog sleep on the bedroom floor.
\[ \begin{aligned} 33 \% \cdot 360^{ \circ} & = 0.33 \cdot 360^{ \circ} \\ ~ & = 118.8^{ \circ}. \end{aligned}\nonumber \]
Therefore, a sector with a central angle of 118.8◦ will represent the fact that 33% of the dog owners allow their dog to sleep on the bedroom floor.
Place the notch on the baseline of your protractor on the center of the circle, then align the baseline of the protractor with the terminal side of the second sector, as shown in Figure 7.11(a). Mark a central angle of 118.8◦, as shown in Figure 7.11(a). Shade the resulting second sector with a darker shade of gray, as shown in Figure 7.11(b). This sector contains 33% of the total area of the circle and represents the portion of the polling sample whose dog sleeps on the bedroom floor.
Because the first three sectors, shaded in various levels of gray, represent 3%, 22%, and 33% of the total circular area, respectively, the remaining sector (shaded in white) automatically represents
\[100 \% − (3 \% + 22 \% + 33 \%) = 42 \%\nonumber \]
of the total circular area. This region represents the percent of dog owners who allow their dogs to sleep on the bed. The final result, with annotations, is shown in Figure 7.1
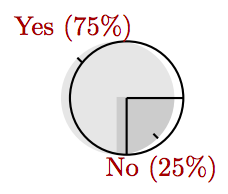
Two hundred people were asked whether they vote “Yes” or “No” on Proposition 8. There were 150 “Yes” votes and 50 “No” votes. Create a pie chart showing the distribution of these responses.
- Answer
-
Exercises
1. In an election for class president, Raven received 21% of the votes, Anita received 27%, Jamal received 24% of the votes, and 28% of the votes were received by other candidates. If a pie chart is created for this data, what will be the degree measure of the central angle of the sector representing Raven’s share of the vote? Round your answer to the nearest degree.
2. In an election for class president, Fernando received 26% of the votes, Luisa received 26%, Ali received 26% of the votes, and 22% of the votes were received by other candidates. If a pie chart is created for this data, what will be the degree measure of the central angle of the sector representing Fernando’s share of the vote? Round your answer to the nearest degree.
3. In an election for class president, Akbar received 23% of the votes, Ali received 27%, Juanita received 30% of the votes, and 20% of the votes were received by other candidates. If a pie chart is created for this data, what will be the degree measure of the central angle of the sector representing Akbar’s share of the vote? Round your answer to the nearest degree.
4. In an election for class president, Kamili received 21% of the votes, Bernardo received 22%, Fernando received 30% of the votes, and 27% of the votes were received by other candidates. If a pie chart is created for this data, what will be the degree measure of the central angle of the sector representing Kamili’s share of the vote? Round your answer to the nearest degree.
5. In an election for class president, Jamal received 30% of the votes, Luisa received 20%, Kamili received 28% of the votes, and 22% of the votes were received by other candidates. If a pie chart is created for this data, what will be the degree measure of the central angle of the sector representing Jamal’s share of the vote? Round your answer to the nearest degree.
6. In an election for class president, Juanita received 30% of the votes, Ali received 24%, Estevan received 24% of the votes, and 22% of the votes were received by other candidates. If a pie chart is created for this data, what will be the degree measure of the central angle of the sector representing Juanita’s share of the vote? Round your answer to the nearest degree.
7. In an election for class president, Chin received 5 votes, Mabel received 13 votes, and Juanita received the remaining 32 votes cast. If a pie chart is created for this voting data, what will be the degree measure of the central angle of the sector representing Chin’s share of the vote? Round your answer to the nearest degree.
8. In an election for class president, Anita received 11 votes, Jose received 9 votes, and Bernardo received the remaining 30 votes cast. If a pie chart is created for this voting data, what will be the degree measure of the central angle of the sector representing Anita’s share of the vote? Round your answer to the nearest degree.
9. In an election for class president, Kamili received 14 votes, Jamal received 9 votes, and Jose received the remaining 27 votes cast. If a pie chart is created for this voting data, what will be the degree measure of the central angle of the sector representing Kamili’s share of the vote? Round your answer to the nearest degree.
10. In an election for class president, Jun received 13 votes, Abdul received 15 votes, and Raven received the remaining 22 votes cast. If a pie chart is created for this voting data, what will be the degree measure of the central angle of the sector representing Jun’s share of the vote? Round your answer to the nearest degree.
11. In an election for class president, Hue received 13 votes, Ali received 6 votes, and Henry received the remaining 31 votes cast. If a pie chart is created for this voting data, what will be the degree measure of the central angle of the sector representing Hue’s share of the vote? Round your answer to the nearest degree.
12. In an election for class president, Mercy received 9 votes, Bernardo received 7 votes, and Hans received the remaining 34 votes cast. If a pie chart is created for this voting data, what will be the degree measure of the central angle of the sector representing Mercy’s share of the vote? Round your answer to the nearest degree.
13. In an election for class president, the vote distribution among three candidates is shown in the following pie chart.
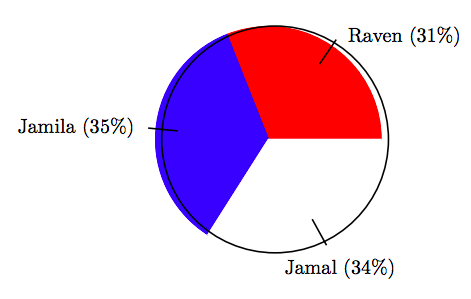
If there were a total of 95 votes cast in the election, find the number of votes that Raven received, correct to the nearest vote.
14. In an election for class president, the vote distribution among three candidates is shown in the following pie chart.
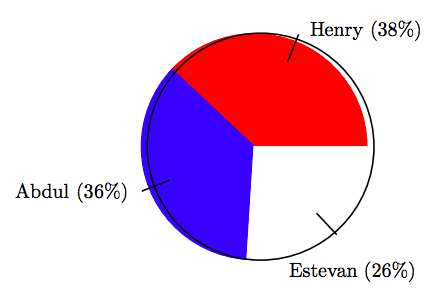
If there were a total of 79 votes cast in the election, find the number of votes that Henry received, correct to the nearest vote.
15. In an election for class president, the vote distribution among three candidates is shown in the following pie chart.
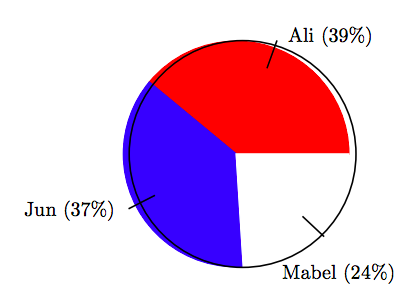
If there were a total of 58 votes cast in the election, find the number of votes that Ali received, correct to the nearest vote.
16. In an election for class president, the vote distribution among three candidates is shown in the following pie chart.
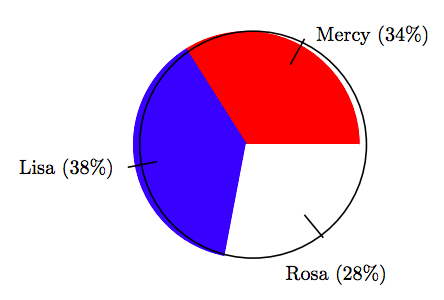
If there were a total of 65 votes cast in the election, find the number of votes that Mercy received, correct to the nearest vote.
17. In an election for class president, the vote distribution among three candidates is shown in the following pie chart.
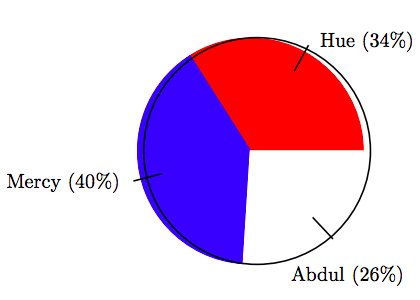
If there were a total of 95 votes cast in the election, find the number of votes that Hue received, correct to the nearest vote.
18. In an election for class president, the vote distribution among three candidates is shown in the following pie chart.
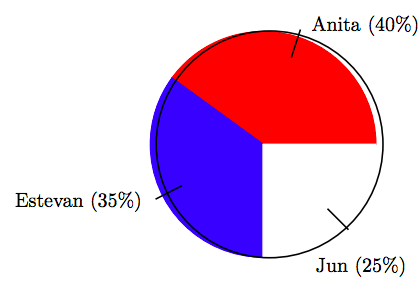
If there were a total of 75 votes cast in the election, find the number of votes that Anita received, correct to the nearest vote.
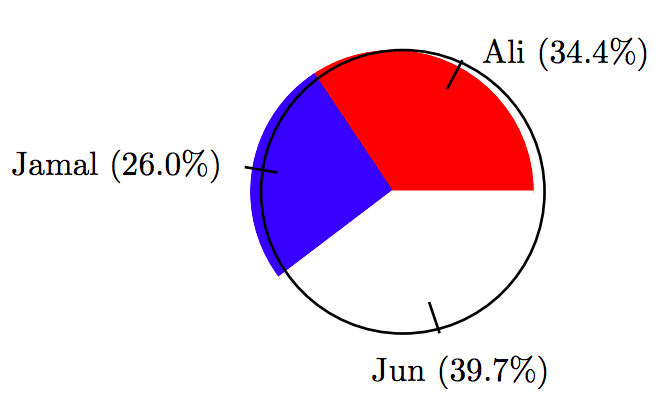
19. In an election for class president, the vote distribution among three candidates is shown in the following table.
\[ \begin{array}{c|c|c|c} \text{Candidate } & \text{ Votes } \\ \hline \text{Ali } & 45 \\ \text{Jamal } & 34 \\ \text{Jun } & 52 \\ \hline \end{array}\nonumber \]
Use a protractor to help create a pie chart showing the distribution of votes.
20. In an election for class president, the vote distribution among three candidates is shown in the following table.
\[ \begin{array}{c|c|c|c} \text{Candidate } & \text{ Votes } \\ \hline \text{Aisha } & 39 \\ \text{Akbar } & 31 \\ \text{Fernando } & 36 \\ \hline \end{array}\nonumber \]
Use a protractor to help create a pie chart showing the distribution of votes.
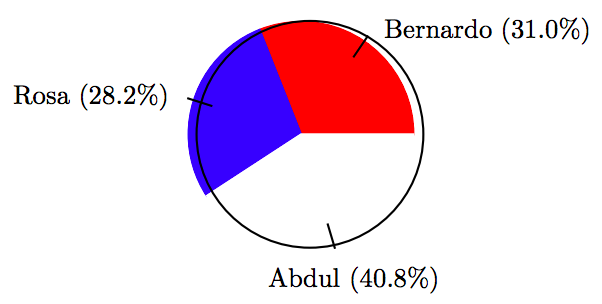
21. In an election for class president, the vote distribution among three candidates is shown in the following table.
\[ \begin{array}{c|c|c|c} \text{Candidate } & \text{ Votes } \\ \hline \text{Bernardo } & 44 \\ \text{Rosa } & 40 \\ \text{Abdul } & 58 \\ \hline \end{array}\nonumber \]
Use a protractor to help create a pie chart showing the distribution of votes.
22. In an election for class president, the vote distribution among three candidates is shown in the following table.
\[ \begin{array}{c|c|c|c} \text{Candidate } & \text{ Votes } \\ \hline \text{Estevan } & 46 \\ \text{Ali } & 58 \\ \text{Henry } & 49 \\ \hline \end{array}\nonumber \]
Use a protractor to help create a pie chart showing the distribution of votes.
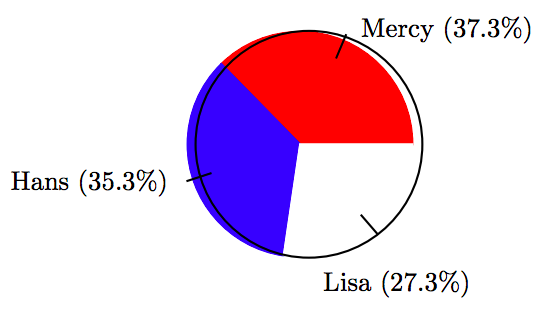
23. In an election for class president, the vote distribution among three candidates is shown in the following table.
\[ \begin{array}{c|c|c|c} \text{Candidate } & \text{ Votes } \\ \hline \text{Mercy } & 56 \\ \text{Hans } & 53 \\ \text{Lisa } & 41 \\ \hline \end{array}\nonumber \]
Use a protractor to help create a pie chart showing the distribution of votes.
24. In an election for class president, the vote distribution among three candidates is shown in the following table.
\[ \begin{array}{c|c|c|c} \text{Candidate } & \text{ Votes } \\ \hline \text{Estevan } & 60 \\ \text{Hue } & 33 \\ \text{Aisha } & 31 \\ \hline \end{array}\nonumber \]
Use a protractor to help create a pie chart showing the distribution of votes.
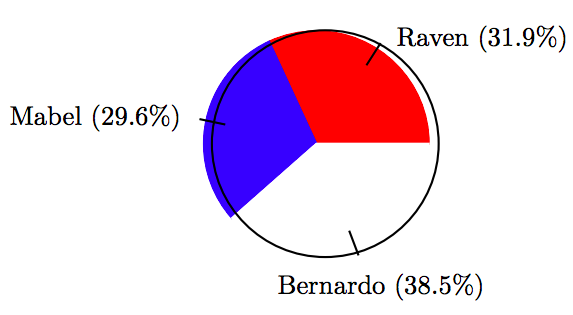
25. In an election for class president, the vote distribution among three candidates is shown in the following table.
\[ \begin{array}{c|c|c|c} \text{Candidate } & \text{ Votes } \\ \hline \text{Raven } & 43 \\ \text{Mabel } & 40 \\ \text{Bernardo } & 52 \\ \hline \end{array}\nonumber \]
Use a protractor to help create a pie chart showing the distribution of votes.
26. In an election for class president, the vote distribution among three candidates is shown in the following table.
\[ \begin{array}{c|c|c|c} \text{Candidate } & \text{ Votes } \\ \hline \text{Hue } & 48 \\ \text{Lisa } & 48 \\ \text{Akbar } & 47 \end{array}\nonumber \]
Use a protractor to help create a pie chart showing the distribution of votes.
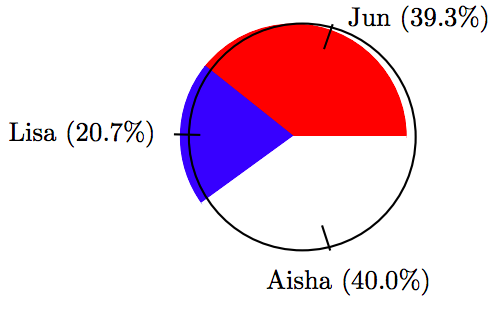
27. In an election for class president, the vote distribution among three candidates is shown in the following table.
\[ \begin{array}{c|c|c|c} \text{Candidate } & \text{ Votes } \\ \hline \text{Jun } & 57 \\ \text{Lisa } & 30 \\ \text{Aisha } & 58 \\ \hline \end{array}\nonumber \]
Use a protractor to help create a pie chart showing the distribution of votes.
28. In an election for class president, the vote distribution among three candidates is shown in the following table.
\[ \begin{array}{c|c|c|c} \text{Candidate } & \text{ Votes } \\ \hline \text{Bernardo } & 54 \\ \text{Mabel } & 38 \\ \text{Henry } & 49 \\ \hline \end{array}\nonumber \]
Use a protractor to help create a pie chart showing the distribution of votes.
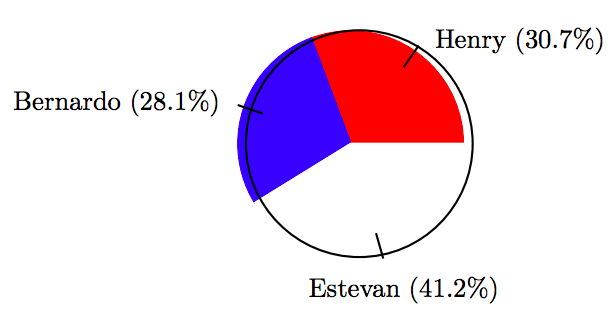
29. In an election for class president, the vote distribution among three candidates is shown in the following table.
\[ \begin{array}{c|c|c|c} \text{Candidate } & \text{ Votes } \\ \hline \text{Henry } & 35 \\ \text{Bernardo } & 32 \\ \text{Estevan } & 47 \\ \hline \end{array}\nonumber \]
Use a protractor to help create a pie chart showing the distribution of votes.
30. In an election for class president, the vote distribution among three candidates is shown in the following table.
\[ \begin{array}{c|c|c|c} \text{Candidate } & \text{ Votes } \\ \hline \text{Bernardo } & 38 \\ \text{Fernando } & 49 \\ \text{Aisha } & 44 \\ \hline \end{array}\nonumber \]
Use a protractor to help create a pie chart showing the distribution of votes.
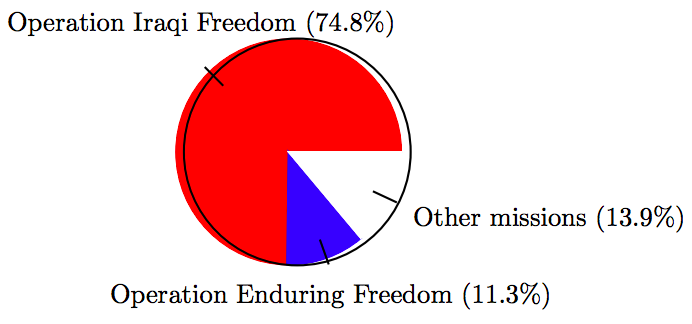
31. Guard deployment. The table shows the number of guard troop services since Sept. 11, 2001 (as of Dec. 2008; some troops have activated multiple times). Associated Press-Times-Standard 02/18/10 Guard troops wait for promised pay.
\[ \begin{array}{c|c|c|c} \text{Mission } & \text{ Troops } \\ \hline \text{Operation Iraqi Freedom } & 193,598 \\ \text{Operation Enduring Freedom } & 29,212 \\ \text{Other missions } & 35,849 \\ \hline \end{array}\nonumber \]
Use a protractor to help create a pie chart showing the distribution of National Guard troops.
Answers
1. 76◦
3. 83◦
5. 108◦
7. 36◦
9. 101◦
11. 94◦
13. 29 votes
15. 23 votes
17. 32 votes
19.
\[ \begin{array}{c|c|c|c} \text{Candidate } & \text{ Votes } & \text{ Percent } & \text{ Degrees } \\ \hline \text{Ali } & 45 & 34.4 \% & 123.84^{ \circ} \\ \text{Jamal } & 34 & 26.0 \% & 93.6^{ \circ} \\ \text{Jun } & 52 & 39.7 \% & 142.92 \\ \hline \end{array}\nonumber \]
21.
\[ \begin{array}{c|c|c|c} \text{Candidate } & \text{ Votes } & \text{ Percent } & \text{ Degrees } \\ \hline \text{Bernardo } & 44 & 31.0 \% & 111.6^{ \circ} \\ \text{Rosa } & 40 & 28.2 \% & 101.52^{ \circ} \\ \text{Abdul } & 58 & 40.8 \% & 146.88^{ \circ} \\ \hline \end{array}\nonumber \]
23.
\[ \begin{array}{c|c|c|c} \text{Candidate } & \text{ Votes } & \text{ Percent } & \text{ Degrees } \\ \hline \text{Mercy } & 56 & 37.3 \% & 134.28^{ \circ} \\ \text{Hans } & 53 & 35.3 \% & 127.08^{ \circ} \\ \text{Lisa } & 41 & 27.3 \% & 98.28^{ \circ} \\ \hline \end{array}\nonumber \]
25.
\[ \begin{array}{c|c|c|c} \text{Candidate } & \text{ Votes } & \text{ Percent } & \text{ Degrees } \\ \hline \text{Raven } & 43 & 31.9 \% & 114.84^{ \circ} \\ \text{Mabel } & 40 & 29.6 \% & 106.56^{ \circ} \\ \text{Bernardo } & 52 & 38.5 \% & 138.6^{ \circ} \\ \hline \end{array}\nonumber \]
27.
\[ \begin{array}{c|c|c|c} \text{Candidate } & \text{ Votes } & \text{ Percent } & \text{ Degrees } \\ \hline \text{Jun } & 57 & 39.3 \% & 141.48^{ \circ} \\ \text{Lisa } & 30 & 20.7 \% & 74.52^{ \circ} \\ \text{Aisha } & 58 & 40.0 \% & 144^{ \circ} \\ \hline \end{array}\nonumber \]
29.
\[ \begin{array}{c|c|c|c} \text{Candidate } & \text{ Votes } & \text{ Percent } & \text{ Degrees } \\ \hline \text{Henry } & 35 & 30.7 \% & 110.52^{ \circ} \\ \text{Bernardo } & 32 & 28.1 \% & 101.16^{ \circ} \\ \text{Estevan } & 47 & 41.2 \% & 148.32^{ \circ} \\ \hline \end{array}\nonumber \]
31.
\[ \begin{array}{c|c|c|c} \text{Mission } & \text{ Troops } & \text{ Percent } & \text{ Degrees } \\ \hline \text{Operation Iraqi Freedom } & 193,598 & 74.8 \% & 269.28^{ \circ} \\ \text{Operation Enduring Freedom } & 29,212 & 11.3 \% & 40.68^{ \circ} \\ \text{Other missions } & 35,849 & 13.9 \% & 50.04^{ \circ} \\ \hline \end{array}\nonumber \]