
16.E: Review Exercises 1
- Page ID
- 46419
\( \newcommand{\vecs}[1]{\overset { \scriptstyle \rightharpoonup} {\mathbf{#1}} } \)
\( \newcommand{\vecd}[1]{\overset{-\!-\!\rightharpoonup}{\vphantom{a}\smash {#1}}} \)
\( \newcommand{\dsum}{\displaystyle\sum\limits} \)
\( \newcommand{\dint}{\displaystyle\int\limits} \)
\( \newcommand{\dlim}{\displaystyle\lim\limits} \)
\( \newcommand{\id}{\mathrm{id}}\) \( \newcommand{\Span}{\mathrm{span}}\)
( \newcommand{\kernel}{\mathrm{null}\,}\) \( \newcommand{\range}{\mathrm{range}\,}\)
\( \newcommand{\RealPart}{\mathrm{Re}}\) \( \newcommand{\ImaginaryPart}{\mathrm{Im}}\)
\( \newcommand{\Argument}{\mathrm{Arg}}\) \( \newcommand{\norm}[1]{\| #1 \|}\)
\( \newcommand{\inner}[2]{\langle #1, #2 \rangle}\)
\( \newcommand{\Span}{\mathrm{span}}\)
\( \newcommand{\id}{\mathrm{id}}\)
\( \newcommand{\Span}{\mathrm{span}}\)
\( \newcommand{\kernel}{\mathrm{null}\,}\)
\( \newcommand{\range}{\mathrm{range}\,}\)
\( \newcommand{\RealPart}{\mathrm{Re}}\)
\( \newcommand{\ImaginaryPart}{\mathrm{Im}}\)
\( \newcommand{\Argument}{\mathrm{Arg}}\)
\( \newcommand{\norm}[1]{\| #1 \|}\)
\( \newcommand{\inner}[2]{\langle #1, #2 \rangle}\)
\( \newcommand{\Span}{\mathrm{span}}\) \( \newcommand{\AA}{\unicode[.8,0]{x212B}}\)
\( \newcommand{\vectorA}[1]{\vec{#1}} % arrow\)
\( \newcommand{\vectorAt}[1]{\vec{\text{#1}}} % arrow\)
\( \newcommand{\vectorB}[1]{\overset { \scriptstyle \rightharpoonup} {\mathbf{#1}} } \)
\( \newcommand{\vectorC}[1]{\textbf{#1}} \)
\( \newcommand{\vectorD}[1]{\overrightarrow{#1}} \)
\( \newcommand{\vectorDt}[1]{\overrightarrow{\text{#1}}} \)
\( \newcommand{\vectE}[1]{\overset{-\!-\!\rightharpoonup}{\vphantom{a}\smash{\mathbf {#1}}}} \)
\( \newcommand{\vecs}[1]{\overset { \scriptstyle \rightharpoonup} {\mathbf{#1}} } \)
\(\newcommand{\longvect}{\overrightarrow}\)
\( \newcommand{\vecd}[1]{\overset{-\!-\!\rightharpoonup}{\vphantom{a}\smash {#1}}} \)
\(\newcommand{\avec}{\mathbf a}\) \(\newcommand{\bvec}{\mathbf b}\) \(\newcommand{\cvec}{\mathbf c}\) \(\newcommand{\dvec}{\mathbf d}\) \(\newcommand{\dtil}{\widetilde{\mathbf d}}\) \(\newcommand{\evec}{\mathbf e}\) \(\newcommand{\fvec}{\mathbf f}\) \(\newcommand{\nvec}{\mathbf n}\) \(\newcommand{\pvec}{\mathbf p}\) \(\newcommand{\qvec}{\mathbf q}\) \(\newcommand{\svec}{\mathbf s}\) \(\newcommand{\tvec}{\mathbf t}\) \(\newcommand{\uvec}{\mathbf u}\) \(\newcommand{\vvec}{\mathbf v}\) \(\newcommand{\wvec}{\mathbf w}\) \(\newcommand{\xvec}{\mathbf x}\) \(\newcommand{\yvec}{\mathbf y}\) \(\newcommand{\zvec}{\mathbf z}\) \(\newcommand{\rvec}{\mathbf r}\) \(\newcommand{\mvec}{\mathbf m}\) \(\newcommand{\zerovec}{\mathbf 0}\) \(\newcommand{\onevec}{\mathbf 1}\) \(\newcommand{\real}{\mathbb R}\) \(\newcommand{\twovec}[2]{\left[\begin{array}{r}#1 \\ #2 \end{array}\right]}\) \(\newcommand{\ctwovec}[2]{\left[\begin{array}{c}#1 \\ #2 \end{array}\right]}\) \(\newcommand{\threevec}[3]{\left[\begin{array}{r}#1 \\ #2 \\ #3 \end{array}\right]}\) \(\newcommand{\cthreevec}[3]{\left[\begin{array}{c}#1 \\ #2 \\ #3 \end{array}\right]}\) \(\newcommand{\fourvec}[4]{\left[\begin{array}{r}#1 \\ #2 \\ #3 \\ #4 \end{array}\right]}\) \(\newcommand{\cfourvec}[4]{\left[\begin{array}{c}#1 \\ #2 \\ #3 \\ #4 \end{array}\right]}\) \(\newcommand{\fivevec}[5]{\left[\begin{array}{r}#1 \\ #2 \\ #3 \\ #4 \\ #5 \\ \end{array}\right]}\) \(\newcommand{\cfivevec}[5]{\left[\begin{array}{c}#1 \\ #2 \\ #3 \\ #4 \\ #5 \\ \end{array}\right]}\) \(\newcommand{\mattwo}[4]{\left[\begin{array}{rr}#1 \amp #2 \\ #3 \amp #4 \\ \end{array}\right]}\) \(\newcommand{\laspan}[1]{\text{Span}\{#1\}}\) \(\newcommand{\bcal}{\cal B}\) \(\newcommand{\ccal}{\cal C}\) \(\newcommand{\scal}{\cal S}\) \(\newcommand{\wcal}{\cal W}\) \(\newcommand{\ecal}{\cal E}\) \(\newcommand{\coords}[2]{\left\{#1\right\}_{#2}}\) \(\newcommand{\gray}[1]{\color{gray}{#1}}\) \(\newcommand{\lgray}[1]{\color{lightgray}{#1}}\) \(\newcommand{\rank}{\operatorname{rank}}\) \(\newcommand{\row}{\text{Row}}\) \(\newcommand{\col}{\text{Col}}\) \(\renewcommand{\row}{\text{Row}}\) \(\newcommand{\nul}{\text{Nul}}\) \(\newcommand{\var}{\text{Var}}\) \(\newcommand{\corr}{\text{corr}}\) \(\newcommand{\len}[1]{\left|#1\right|}\) \(\newcommand{\bbar}{\overline{\bvec}}\) \(\newcommand{\bhat}{\widehat{\bvec}}\) \(\newcommand{\bperp}{\bvec^\perp}\) \(\newcommand{\xhat}{\widehat{\xvec}}\) \(\newcommand{\vhat}{\widehat{\vvec}}\) \(\newcommand{\uhat}{\widehat{\uvec}}\) \(\newcommand{\what}{\widehat{\wvec}}\) \(\newcommand{\Sighat}{\widehat{\Sigma}}\) \(\newcommand{\lt}{<}\) \(\newcommand{\gt}{>}\) \(\newcommand{\amp}{&}\) \(\definecolor{fillinmathshade}{gray}{0.9}\)Chapter Review Exercises
Graph Linear Equations in Two Variables
Plot Points in a Rectangular Coordinate System
In the following exercises, plot each point in a rectangular coordinate system.
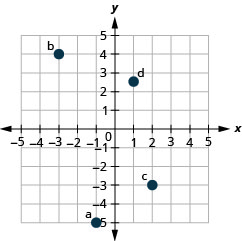
1. ⓐ \((−1,−5)\)
ⓑ \((−3,4)\)
ⓒ \((2,−3)\)
ⓓ \((1,\frac{5}{2})\)
- Answer
-
2. ⓐ \((−2,0)\)
ⓑ \((0,−4)\)
ⓒ \((0,5)\)
ⓓ \((3,0)\)
In the following exercises, determine which ordered pairs are solutions to the given equations.
3. \(5x+y=10\);
ⓐ \((5,1)\)
ⓑ \((2,0)\)
ⓒ \((4,−10)\)
- Answer
-
ⓑ, ⓒ
4. \(y=6x−2\);
ⓐ \((1,4)\)
ⓑ \((13,0)\)
ⓒ \((6,−2)\)
Graph a Linear Equation by Plotting Points
In the following exercises, graph by plotting points.
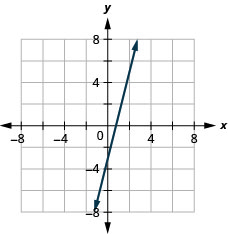
5. \(y=4x−3\)
- Answer
-
6. \(y=−3x\)
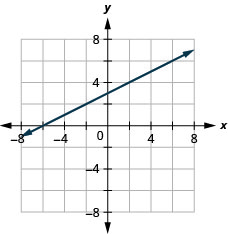
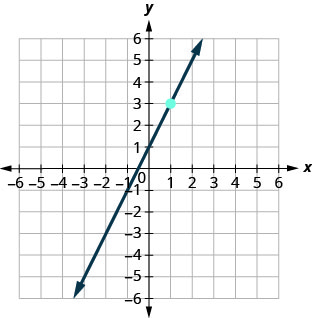
7. \(y=\frac{1}{2}x+3\)
- Answer
-
8. \(y=−\frac{4}{5}|x−1\)
9. \(x−y=6\)
- Answer
-
10. \(2x+y=7\)
11. \(3x−2y=6\)
- Answer
-
Graph Vertical and Horizontal lines
In the following exercises, graph each equation.
12. \(y=−2\)
13. \(x=3\)
- Answer
-
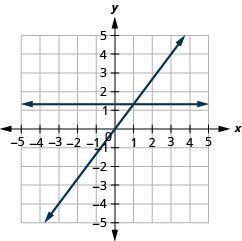
In the following exercises, graph each pair of equations in the same rectangular coordinate system.
14. \(y=−2x\) and \(y=−2\)
15. \(y=\frac{4}{3}x\) and \(y=\frac{4}{3}\)
- Answer
-
Find x- and y-Intercepts
In the following exercises, find the x- and y-intercepts.
16.

17.
- Answer
-
\((0,3)(3,0)\)
In the following exercises, find the intercepts of each equation.
18. \(x−y=−1\)
19. \(x+2y=6\)
- Answer
-
\((6,0),\space (0,3)\)
20. \(2x+3y=12\)
21. \(y=\frac{3}{4}x−12\)
- Answer
-
\((16,0),\space (0,−12)\)
22. \(y=3x\)
Graph a Line Using the Intercepts
In the following exercises, graph using the intercepts.
23. \(−x+3y=3\)
- Answer
-
24. \(x−y=4\)
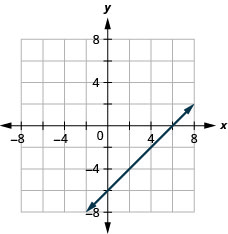
25. \(2x−y=5\)
- Answer
-
26. \(2x−4y=8\)
27. \(y=4x\)
- Answer
-
Slope of a Line
Find the Slope of a Line
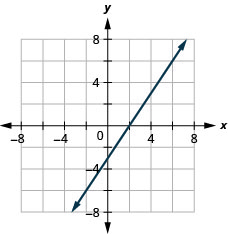
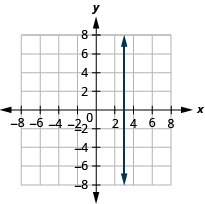
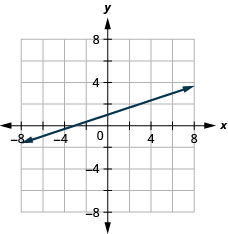
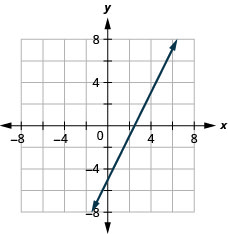
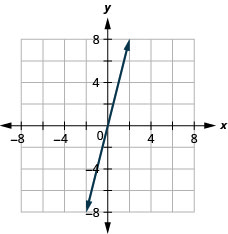
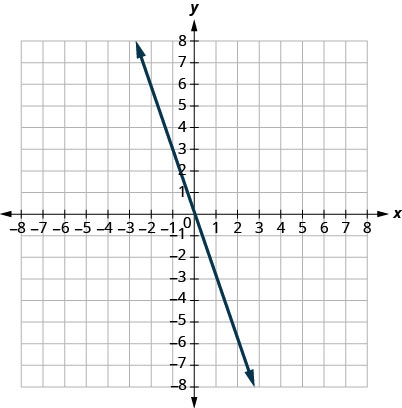
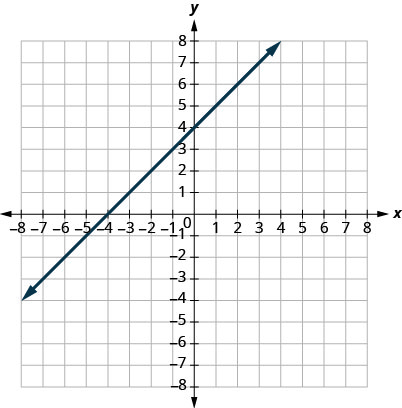
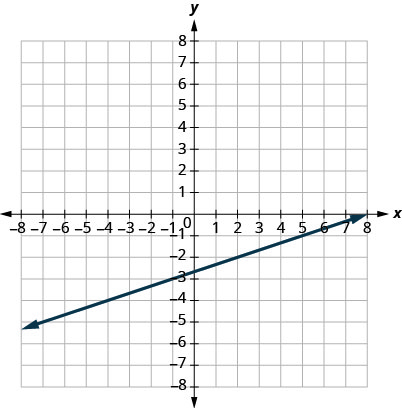
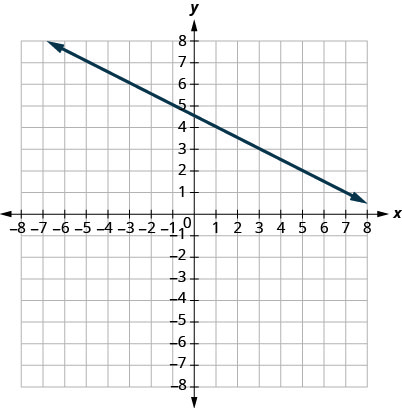
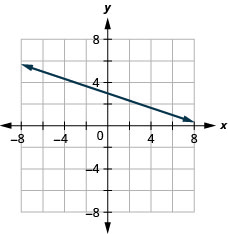
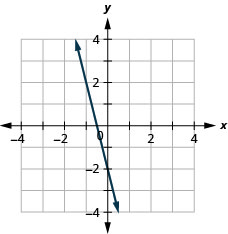
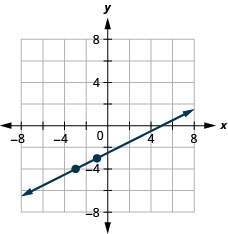
In the following exercises, find the slope of each line shown.
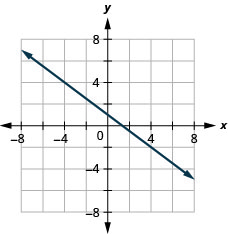
28.
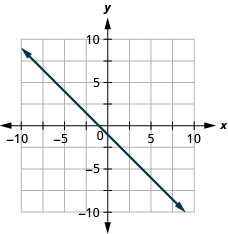
29.
- Answer
-
1
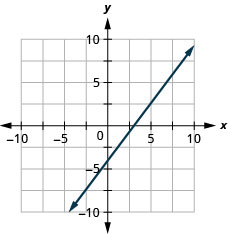
30.
31.
- Answer
-
\(−12\)
In the following exercises, find the slope of each line.
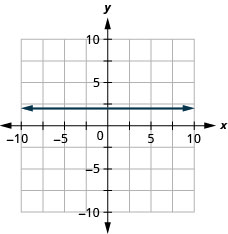
32. \(y=2\)
33. \(x=5\)
- Answer
-
undefined
34. \(x=−3\)
35. \(y=−1\)
- Answer
-
0
Use the Slope Formula to find the Slope of a Line between Two Points
In the following exercises, use the slope formula to find the slope of the line between each pair of points.
36. \((−1,−1),(0,5)\)
37. \((3.5),(4,−1)\)
- Answer
-
\(−6\)
38. \((−5,−2),(3,2)\)
39. \((2,1),(4,6)\)
- Answer
-
\(52\)
Graph a Line Given a Point and the Slope
In the following exercises, graph each line with the given point and slope.
40. \((2,−2);\space m=52\)
41. \((−3,4);\space m=−13\)
- Answer
-
42. \(x\)-intercept \(−4; m=3\)
43. \(y\)-intercept \(1; m=−34\)
- Answer
-
Graph a Line Using Its Slope and Intercept
In the following exercises, identify the slope and \(y\)-intercept of each line.
44. \(y=−4x+9\)
45. \(y=53x−6\)
- Answer
-
\(m=53;\space (0,−6)\)
46. \(5x+y=10\)
47. \(4x−5y=8\)
- Answer
-
\(m=\frac{4}{5};\space (0,−\frac{8}{5})\)
In the following exercises, graph the line of each equation using its slope and y-intercept.
48. \(y=2x+3\)
49. \(y=−x−1\)
- Answer
-
50. \(y=−25x+3\)
51. \(4x−3y=12\)
- Answer
-
In the following exercises, determine the most convenient method to graph each line.
52. \(x=5\)
53. \(y=−3\)
- Answer
-
horizontal line
54. \(2x+y=5\)
55. \(x−y=2\)
- Answer
-
intercepts
56. \(y=22x+2\)
57. \(y=34x−1\)
- Answer
-
plotting points
Graph and Interpret Applications of Slope-Intercept
58. Katherine is a private chef. The equation \(C=6.5m+42\) models the relation between her weekly cost, C, in dollars and the number of meals, m, that she serves.
ⓐ Find Katherine’s cost for a week when she serves no meals.
ⓑ Find the cost for a week when she serves 14 meals.
ⓒ Interpret the slope and C-intercept of the equation.
ⓓ Graph the equation.
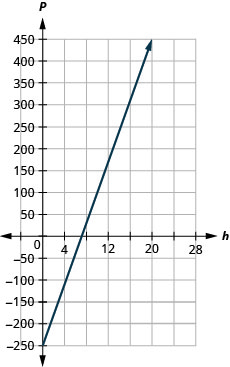
59. Marjorie teaches piano. The equation \(P=35h−250\) models the relation between her weekly profit, P, in dollars and the number of student lessons, s, that she teaches.
ⓐ Find Marjorie’s profit for a week when she teaches no student lessons.
ⓑ Find the profit for a week when she teaches 20 student lessons.
ⓒ Interpret the slope and P-intercept of the equation.
ⓓ Graph the equation.
- Answer
-
ⓐ \(−$250\)
ⓑ \($450\)
ⓒ The slope, 35, means that Marjorie’s weekly profit, P, increases by $35 for each additional student lesson she teaches.
The P-intercept means that when the number of lessons is 0, Marjorie loses $250.
ⓓ
Use Slopes to Identify Parallel and Perpendicular Lines
In the following exercises, use slopes and \(y\)-intercepts to determine if the lines are parallel, perpendicular, or neither.
60. \(4x−3y=−1;\quad y=43x−3\)
61. \(y=5x−1;\quad 10x+2y=0\)
- Answer
-
neither
62. \(3x−2y=5;\quad 2x+3y=6\)
63. \(2x−y=8;\quad x−2y=4\)
- Answer
-
not parallel
Find the Equation of a Line
Find an Equation of the Line Given the Slope and y-Intercept
In the following exercises, find the equation of a line with given slope and y-intercept. Write the equation in slope–intercept form.
64. Slope \(\frac{1}{3}\) and \(y\)-intercept \((0,−6)\)
65. Slope \(−5\) and \(y\)-intercept \((0,−3)\)
- Answer
-
\(y=−5x−3\)
66. Slope \(0\) and \(y\)-intercept \((0,4)\)
67. Slope \(−2\) and \(y\)-intercept \((0,0)\)
- Answer
-
\(y=−2x\)
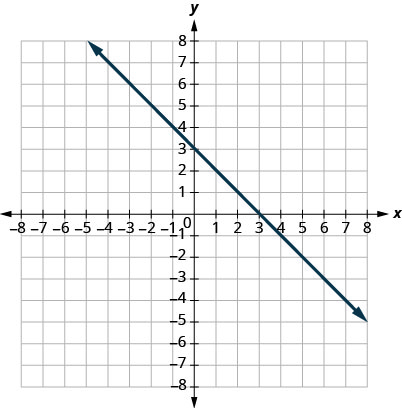
In the following exercises, find the equation of the line shown in each graph. Write the equation in slope–intercept form.
68.
69.
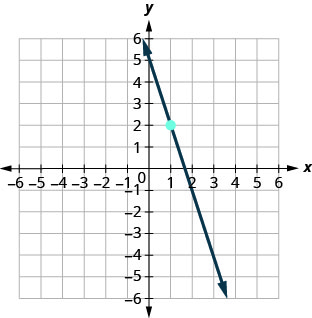
- Answer
-
\(y=−3x+5\)
70.
71.

- Answer
-
\(y=−4\)
Find an Equation of the Line Given the Slope and a Point
In the following exercises, find the equation of a line with given slope and containing the given point. Write the equation in slope–intercept form.
72. \(m=−\frac{1}{4}\), point \((−8,3)\)
73. \(m=\frac{3}{5}\), point \((10,6)\)
- Answer
-
\(y=\frac{3}{5}x\)
74. Horizontal line containing \((−2,7)\)
75. \(m=−2\), point \((−1,−3)\)
- Answer
-
\(y=−2x−5\)
Find an Equation of the Line Given Two Points
In the following exercises, find the equation of a line containing the given points. Write the equation in slope–intercept form.
76. \((2,10)\) and \((−2,−2)\)
77. \((7,1)\) and \((5,0)\)
- Answer
-
\(y=\frac{1}{2}x−\frac{5}{2}\)
78. \((3,8)\) and \((3,−4)\)
79. \((5,2)\) and \((−1,2)\)
- Answer
-
\(y=2\)
Find an Equation of a Line Parallel to a Given Line
In the following exercises, find an equation of a line parallel to the given line and contains the given point. Write the equation in slope–intercept form.
80. line \(y=−3x+6\), point \((1,−5)\)
81. line \(2x+5y=−10\), point \((10,4)\)
- Answer
-
\(y=−\frac{2}{5}x+8\)
82. line \(x=4\), point \((−2,−1)\)
83. line \(y=−5\), point \((−4,3)\)
- Answer
-
\(y=3\)
Find an Equation of a Line Perpendicular to a Given Line
In the following exercises, find an equation of a line perpendicular to the given line and contains the given point. Write the equation in slope–intercept form.
84. line \(y=−\frac{4}{5}x+2\), point \((8,9)\)
85. line \(2x−3y=9\), point \((−4,0)\)
- Answer
-
\(y=−\frac{3}{2}x−6\)
86. line \(y=3\), point \((−1,−3)\)
87. line \(x=−5\) point \((2,1)\)
- Answer
-
\(y=1\)
Graph Linear Inequalities in Two Variables
Verify Solutions to an Inequality in Two Variables
In the following exercises, determine whether each ordered pair is a solution to the given inequality.
88. Determine whether each ordered pair is a solution to the inequality \(y<x−3\):
ⓐ \((0,1)\) ⓑ \((−2,−4)\) ⓒ \((5,2)\) ⓓ \((3,−1)\)
ⓔ \((−1,−5)\)
89. Determine whether each ordered pair is a solution to the inequality \(x+y>4\):
ⓐ \((6,1)\) ⓑ \((−3,6)\) ⓒ \((3,2)\) ⓓ \((−5,10)\) ⓔ \((0,0)\)
- Answer
-
ⓐ yes ⓑ no ⓒ yes ⓓ yes; ⓔ nom
Recognize the Relation Between the Solutions of an Inequality and its Graph
In the following exercises, write the inequality shown by the shaded region.
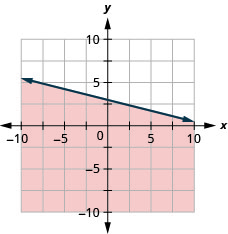
90. Write the inequality shown by the graph with the boundary line \(y=−x+2.\)
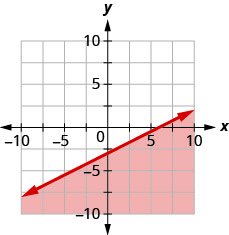
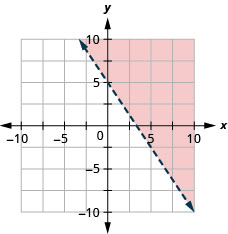
91. Write the inequality shown by the graph with the boundary line \(y=\frac{2}{3}x−3\).
- Answer
-
\(y>\frac{2}{3}x−3\)
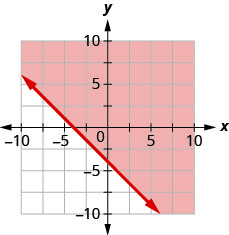
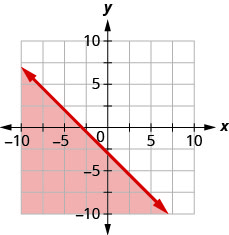
92. Write the inequality shown by the shaded region in the graph with the boundary line \(x+y=−4\).
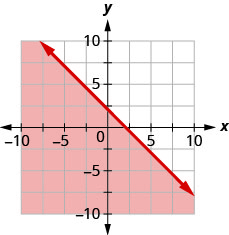
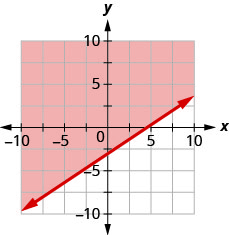
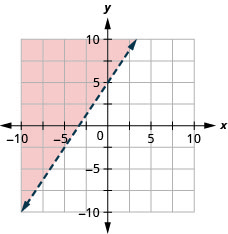
93. Write the inequality shown by the shaded region in the graph with the boundary line \(x−2y=6\).
- Answer
-
\(x−2y\geq 6\)
Graph Linear Inequalities in Two Variables
In the following exercises, graph each linear inequality.
94. Graph the linear inequality \(y>\frac{2}{5}x−4\).
95. Graph the linear inequality \(y\leq −\frac{1}{4}x+3\).
- Answer
-
96. Graph the linear inequality \(x−y\leq 5\).
97. Graph the linear inequality \(3x+2y>10.\)
- Answer
-
98. Graph the linear inequality \(y\leq −3x\).
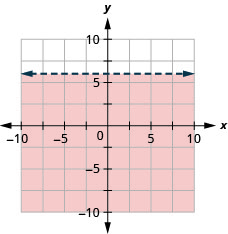
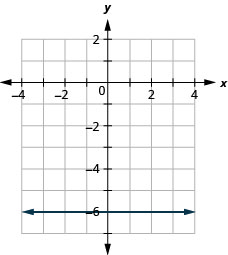
99. Graph the linear inequality \(y<6.\)
- Answer
-
Solve Applications using Linear Inequalities in Two Variables
100. Shanthie needs to earn at least $500 a week during her summer break to pay for college. She works two jobs. One as a swimming instructor that pays $10 an hour and the other as an intern in a law office for $25 hour. How many hours does Shanthie need to work at each job to earn at least $500 per week?
ⓐ Let x be the number of hours she works teaching swimming and let y be the number of hours she works as an intern. Write an inequality that would model this situation.
ⓑ Graph the inequality.
ⓒ Find three ordered pairs \((x,y)\) that would be solutions to the inequality. Then, explain what that means for Shanthie.
101. Atsushi he needs to exercise enough to burn \(600\) calories each day. He prefers to either run or bike and burns \(20\) calories per minute while running and \(15\) calories a minute while biking.
ⓐ If x is the number of minutes that Atsushi runs and y is the number minutes he bikes, find the inequality that models the situation.
ⓑ Graph the inequality.
ⓒ List three solutions to the inequality. What options do the solutions provide Atsushi?
- Answer
-
ⓐ \(20x+15y\geq 60020x+15y\geq 600\)
ⓑ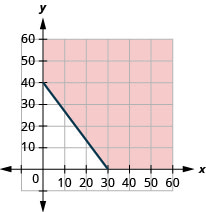
ⓒ Answers will vary.
Relations and Functions
Find the Domain and Range of a Relation
In the following exercises, for each relation, ⓐ find the domain of the relation ⓑ find the range of the relation.
102. \({\{(5,−2),\,(5,−4),\,(7,−6),\,(8,−8),\,(9,−10)}\}\)
103. \({\{(−3,7),\,(−2,3),\,(−1,9), \,(0,−3),\,(−1,8)}\}\)
- Answer
-
ⓐ \(D: {−3, −2, −1, 0}\)
ⓑ \(R: {7, 3, 9, −3, 8}\)
In the following exercise, use the mapping of the relation to ⓐ list the ordered pairs of the relation ⓑ find the domain of the relation ⓒ find the range of the relation.
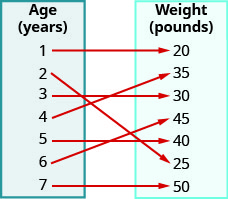
104. The mapping below shows the average weight of a child according to age.
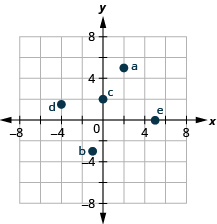
In the following exercise, use the graph of the relation to ⓐ list the ordered pairs of the relation ⓑ find the domain of the relation ⓒ find the range of the relation.
105.
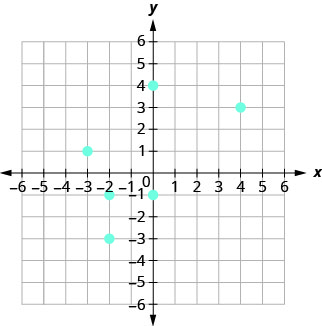
- Answer
-
ⓐ \((4, 3), \,(−2, −3), \,(−2, −1), \,(−3, 1), \,(0, −1), \,(0, 4)\)
ⓑ \(D: {−3, −2, 0, 4}\)
ⓒ \(R: {−3, −1, 1, 3, 4}\)
Determine if a Relation is a Function
In the following exercises, use the set of ordered pairs to ⓐ determine whether the relation is a function ⓑ find the domain of the relation ⓒ find the range of the relation.
106. \({\{(9,−5),\,(4,−3),\,(1,−1),\,(0,0),\,(1,1),\,(4,3),\,(9,5)}\}\)
107. \({\{(−3,27),\,(−2,8),\,(−1,1),\,(0,0),\,(1,1),\,(2,8),\,(3,27)}\}\)
- Answer
-
ⓐ yes ⓑ \({−3, −2, −1, 0, 1, 2, 3}\)
ⓒ \({0, 1, 8, 27}\)
In the following exercises, use the mapping to ⓐ determine whether the relation is a function ⓑ find the domain of the function ⓒfind the range of the function.
108.
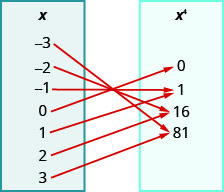
109.
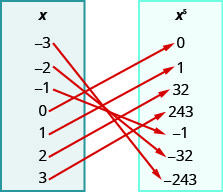
- Answer
-
ⓐ \({−3, −2, −1, 0, 1, 2, 3}\)
ⓑ \({−3, −2, −1, 0, 1, 2, 3}\)
ⓒ \({−243, −32, −1, 0, 1, 32, 243}\)
In the following exercises, determine whether each equation is a function.
110. \(2x+y=−3\)
111. \(y=x^2\)
- Answer
-
yes
112. \(y=3x−5\)
113. \(y=x^3\)
- Answer
-
yes
114. \(2x+y2=4\)
Find the Value of a Function
In the following exercises, evaluate the function:
ⓐ \(f(−2)\) ⓑ \(f(3)\) ⓒ \(f(a)\).
115. \(f(x)=3x−4\)
- Answer
-
ⓐ \(f(−2)=−10\) ⓑ \(f(3)=5\) ⓒ \(f(a)=3a−4\)
116. \(f(x)=−2x+5\)
117. \(f(x)=x^2−5x+6\)
- Answer
-
ⓐ \(f(−2)=20\) ⓑ \(f(3)=0\) ⓒ \(f(a)=a^2−5a+6\)
118. \(f(x)=3x^2−2x+1\)
In the following exercises, evaluate the function.
119. \(g(x)=3x2−5x;\space g(2)\)
- Answer
-
\(2\)
120. \(F(x)=2x2−3x+1;\space F(−1)\)
121. \(h(t)=4|t−1|+2;\space h(t)=4\)
- Answer
-
\(18\)
122. \(f(x)=x+2x−1;\space f(3)\)
Graphs of Functions
Use the Vertical line Test
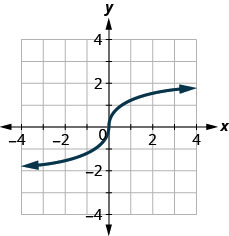
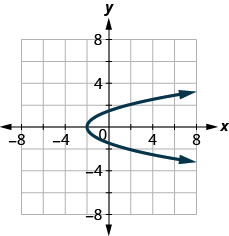
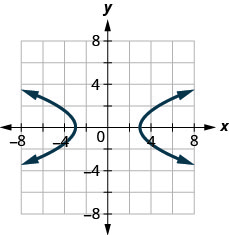
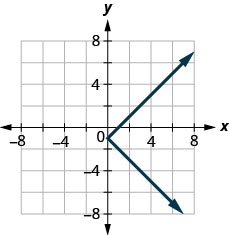
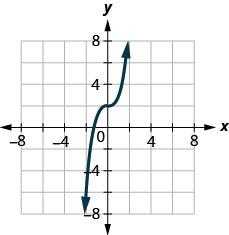
In the following exercises, determine whether each graph is the graph of a function.
123.
- Answer
-
yes
124.
125.
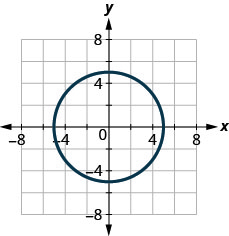
- Answer
-
no
126.
127.
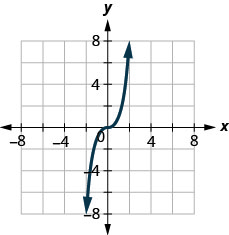
- Answer
-
yes
128.
129.
- Answer
-
no
Identify Graphs of Basic Functions
In the following exercises, ⓐ graph each function ⓑ state its domain and range. Write the domain and range in interval notation.
130. \(f(x)=5x+1\)
131. \(f(x)=−4x−2\)
- Answer
-
ⓐ
ⓑ \(D: (-\inf ,\inf ), R: (-\inf ,\inf )\)
132. \(f(x)=\frac{2}{3}x−1\)
133. \(f(x)=−6\)
- Answer
-
ⓐ
ⓑ \(D: (-\inf ,\inf ), R: (-\inf ,\inf )\)
134. \(f(x)=2x\)
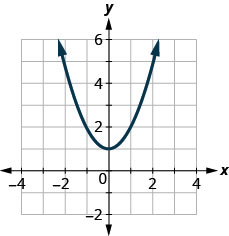
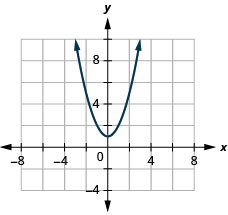
135. \(f(x)=3x^2\)
- Answer
-
ⓐ
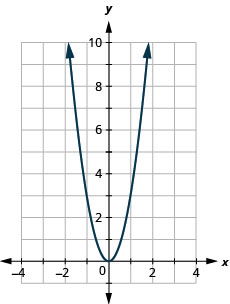
ⓑ \(D: (-\inf ,\inf ), R: (-\inf ,0]\)
136. \(f(x)=−12x^2\)
137. \(f(x)=x^2+2\)
- Answer
-
ⓐ
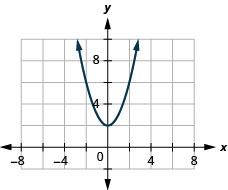
ⓑ \(D: (-\inf ,\inf ), R: (-\inf ,\inf )\)
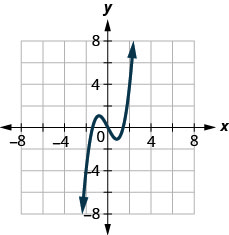
138. \(f(x)=x^3−2\)
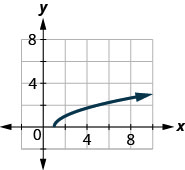
139. \(f(x)=\sqrt{x+2}\)
- Answer
-
ⓐ
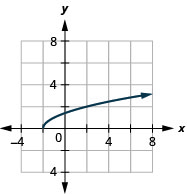
ⓑ \(D: [−2,−2, \inf ), \space R: [0,\inf )\)
140. \(f(x)=−|x|\)
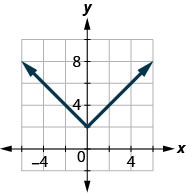
141. \(f(x)=|x|+1\)
- Answer
-
ⓐ
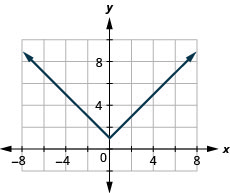
ⓑ \(D: (-\inf ,\inf ), \space R: [1,\inf )\)
Read Information from a Graph of a Function
In the following exercises, use the graph of the function to find its domain and range. Write the domain and range in interval notation
142.
143.
- Answer
-
\(D: (-\inf ,\inf ), R: [2,\inf )\)
144.
In the following exercises, use the graph of the function to find the indicated values.
145.
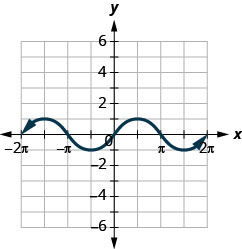
ⓐ Find \(f(0)\).
ⓑ Find \(f(12\pi )\).
ⓒ Find \(f(−32\pi )\).
ⓓ Find the values for \(x\) when \(f(x)=0\).
ⓔ Find the \(x\)-intercepts.
ⓕ Find the \(y\)-intercept(s).
ⓖ Find the domain. Write it in interval notation.
ⓗ Find the range. Write it in interval notation.
- Answer
-
ⓐ \(f(x)=0\) ⓑ \(f(\pi /2)=1\)
ⓒ \(f(−3\pi /2)=1\) ⓓ \(f(x)=0\) for \(x=−2\pi ,−\pi ,0,\pi ,2\pi\)
ⓔ \((−2\pi ,0), (−\pi ,0), (0,0), (\pi ,0), (2\pi ,0)\) ⓕ \((0,0)\)
ⓖ \([−2\pi ,2\pi ]\) ⓗ \([−1,1]\)
146.
ⓐ Find \(f(0)\).
ⓑ Find the values for \(x\) when \(f(x)=0\).
ⓒ Find the \(x\)-intercepts.
ⓓ Find the \(y\)-intercept(s).
ⓔ Find the domain. Write it in interval notation.
ⓕ Find the range. Write it in interval notation.
Practice Test
1. Plot each point in a rectangular coordinate system.
ⓐ \((2,5)\)
ⓑ \((−1,−3)\)
ⓒ \((0,2)\)
ⓓ \((−4,32)\)
ⓔ \((5,0)\)
- Answer
-
2. Which of the given ordered pairs are solutions to the equation \(3x−y=6\)?
ⓐ \((3,3)\) ⓑ \((2,0)\) ⓒ \((4,−6)\)
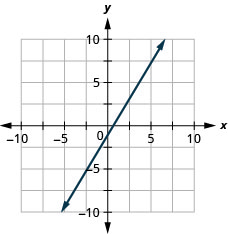
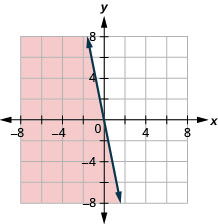
3. Find the slope of each line shown.
ⓐ
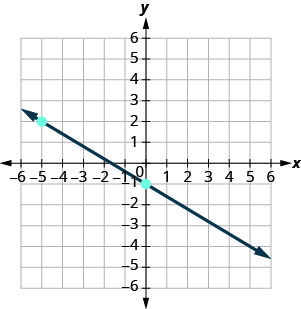
ⓑ
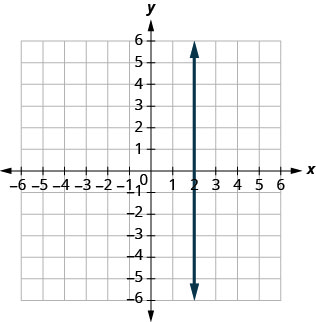
- Answer
-
ⓐ \(−\frac{3}{5}\) ⓑ undefined
4. Find the slope of the line between the points \((5,2)\) and \((−1,−4)\).
5. Graph the line with slope \(\frac{1}{2}\) containing the point \((−3,−4)\).
- Answer
-
6. Find the intercepts of \(4x+2y=−8\) and graph.
Graph the line for each of the following equations.
7. \(y=\frac{5}{3}x−1\)
- Answer
-
8. \(y=−x\)
9. \(y=2\)
- Answer
-
Find the equation of each line. Write the equation in slope-intercept form.
10. slope \(−\frac{3}{4}\) and \(y\)-intercept \((0,−2)\)
11. \(m=2\), point \((−3,−1)\)
- Answer
-
\(y=2x+5\)
12. containing \((10,1)\) and \((6,−1)\)
13. perpendicular to the line \(y=\frac{5}{4}x+2\), containing the point \((−10,3)\)
- Answer
-
\(y=−\frac{4}{5}x−5\)
14. Write the inequality shown by the graph with the boundary line \(y=−x−3\).
Graph each linear inequality.
15. \(y>\frac{3}{2}x+5\)
- Answer
-
16. \(x−y\geq −4\)
17. \(y\leq −5x\)
- Answer
-
18. Hiro works two part time jobs in order to earn enough money to meet her obligations of at least $450 a week. Her job at the mall pays $10 an hour and her administrative assistant job on campus pays $15 an hour. How many hours does Hiro need to work at each job to earn at least $450?
ⓐ Let x be the number of hours she works at the mall and let y be the number of hours she works as administrative assistant. Write an inequality that would model this situation.
ⓑ Graph the inequality .
ⓒ Find three ordered pairs \((x,y)\) that would be solutions to the inequality. Then explain what that means for Hiro.
19. Use the set of ordered pairs to ⓐ determine whether the relation is a function, ⓑ find the domain of the relation, and ⓒfind the range of the relation.
\({\{(−3,27),(−2,8),(−1,1),(0,0),
(1,1),(2,8),(3,27)}\}\)
- Answer
-
ⓐ yes ⓑ \({\{−3,−2,−1,0,1,2,3}\}\) ⓒ \({\{0, 1, 8, 27}\}\)
20. Evaluate the function: ⓐ \(f(−1)\) ⓑ \(f(2)\) ⓒ \(f(c)\).
\(f(x)=4x^2−2x−3\)
21. For \(h(y)=3|y−1|−3\), evaluate \(h(−4)\).
- Answer
-
\(12\)
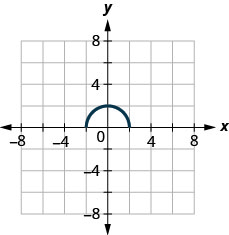
22. Determine whether the graph is the graph of a function. Explain your answer.
In the following exercises, ⓐ graph each function ⓑ state its domain and range.
Write the domain and range in interval notation.
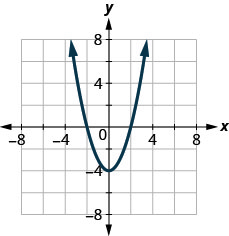
23. \(f(x)=x^2+1\)
- Answer
-
ⓐ
ⓑ \(D: (-\inf ,\inf ), R: [1,\inf )\)
24. \(f(x)=\sqrt{x+1}\)
ⓑ Find the \(y\)-intercepts.
ⓒ Find \(f(−1)\).
ⓓ Find \(f(1)\).
ⓔ Find the domain. Write it in interval notation.
ⓕ Find the range. Write it in interval notation.
- Answer
-
ⓐ \(x=−2,2\) ⓑ \(y=−4\)
ⓒ \(f(−1)=−3\) ⓓ \(f(1)=−3\)
ⓔ \(D: (-\inf ,\inf )\) ⓕ \(R: [−4, \inf)\)