
3.5: Graphing Systems of Linear Inequalities
( \newcommand{\kernel}{\mathrm{null}\,}\)
By the end of this section, you will be able to:
- Determine whether an ordered pair is a solution of a system of linear inequalities
- Solve a system of linear inequalities by graphing
- Solve applications of systems of inequalities
Before you get started, take this readiness quiz.
Determine whether an ordered pair is a solution of a system of linear inequalities
The definition of a system of linear inequalities is very similar to the definition of a system of linear equations.
Two or more linear inequalities grouped together form a system of linear inequalities.
A system of linear inequalities looks like a system of linear equations, but it has inequalities instead of equations. A system of two linear inequalities is shown here.
To solve a system of linear inequalities, we will find values of the variables that are solutions to both inequalities. We solve the system by using the graphs of each inequality and show the solution as a graph. We will find the region on the plane that contains all ordered pairs
Solutions of a system of linear inequalities are the values of the variables that make all the inequalities true.
The solution of a system of linear inequalities is shown as a shaded region in the
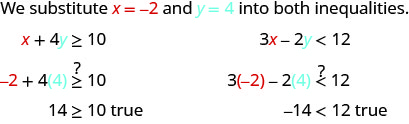
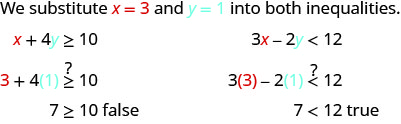
To determine if an ordered pair is a solution to a system of two inequalities, we substitute the values of the variables into each inequality. If the ordered pair makes both inequalities true, it is a solution to the system.
Determine whether the ordered pair is a solution to the system
a.
Solution:
a. Is the ordered pair
The ordered pair
b. Is the ordered pair
The ordered pair
Determine whether the ordered pair is a solution to the system:
a.
- Answer
-
a. no
b. yes
Determine whether the ordered pair is a solution to the system:
a.
- Answer
-
a. yes
b. no
Solve a System of Linear Inequalities by Graphing
The solution to a single linear inequality is the region on one side of the boundary line that contains all the points that make the inequality true. The solution to a system of two linear inequalities is a region that contains the solutions to both inequalities. To find this region, we will graph each inequality separately and then locate the region where they are both true. The solution is always shown as a graph.
Solve the system by graphing:
Solution:

Solve the system by graphing:
- Answer
-
The solution is the grey region.
Solve the system by graphing:
- Answer
-
The solution is the grey region.
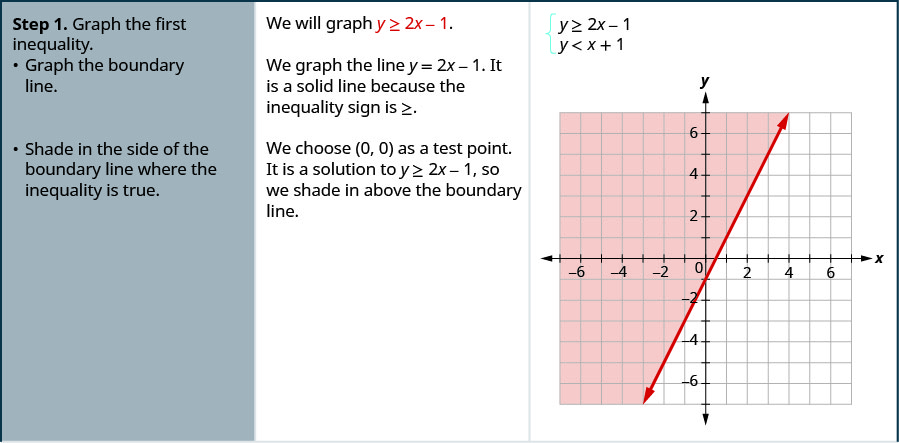
- Graph the first inequality.
- Graph the boundary line.
- Shade in the side of the boundary line where the inequality is true.
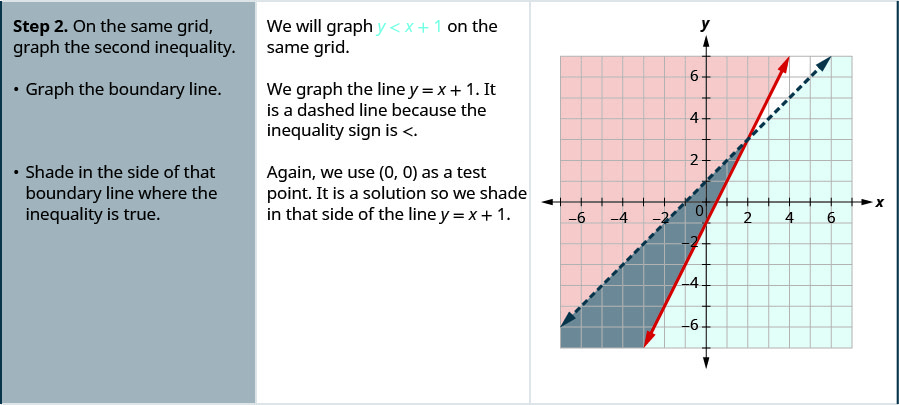
- On the same grid, graph the second inequality.
- Graph the boundary line.
- Shade in the side of that boundary line where the inequality is true.
- The solution is the region where the shading overlaps.
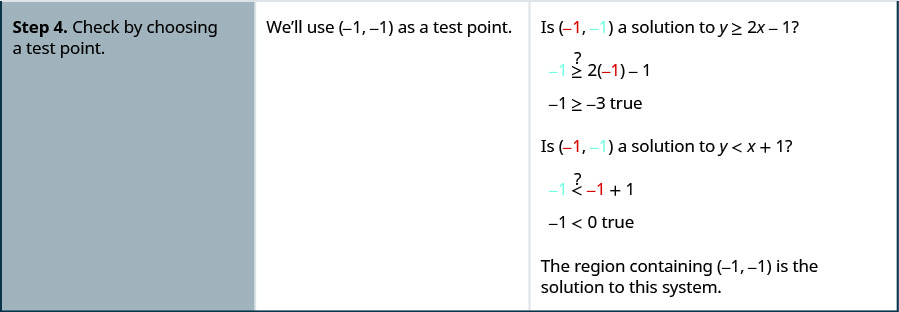
- Check by choosing a test point.
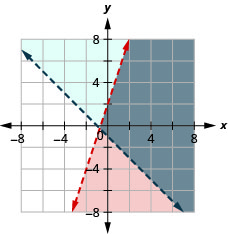
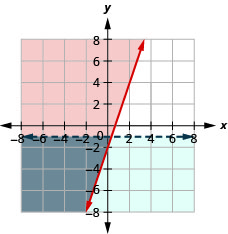
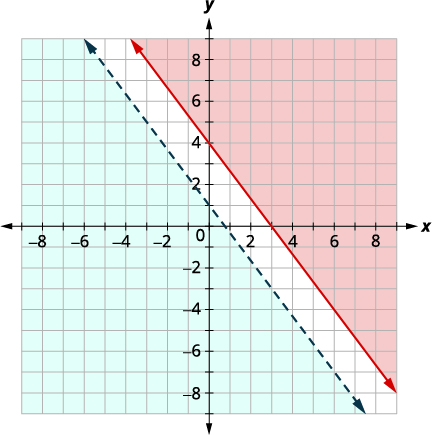
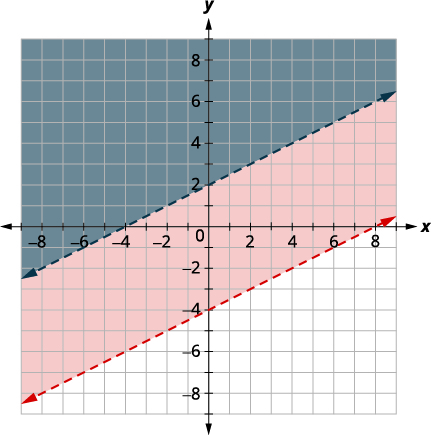
Solve the system by graphing:
Solution:
| Graph and testing a point. The intercepts are boundary line will be dashed. Test (red) the side that does not contain |
 |
| Graph using the slope The boundary line will be dashed Test shade (blue) the side that contains Choose a test point in the solution and verify that it is a solution to both inequalties. |
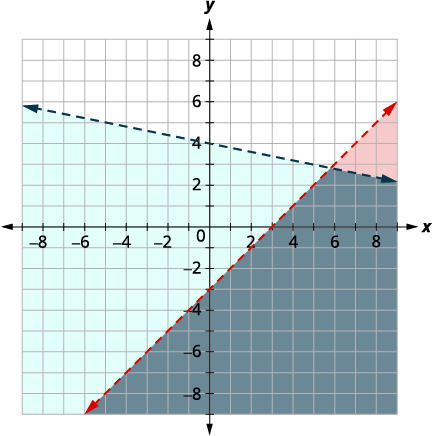 |
The point of intersection of the two lines is not included as both boundary lines were dashed. The solution is the area shaded twice—which appears as the darkest shaded region.
Solve the system by graphing:
- Answer
-
The solution is the grey region.
Solve the system by graphing:
- Answer
-
The solution is the grey region.
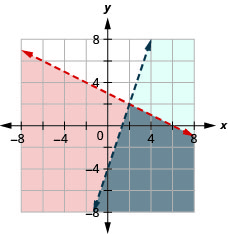
Solve the system by graphing:
Solution:
| Graph and testing a point. The intercepts are boundary line will be dashed. Test (red) the side that contains |
 |
| Graph recognizing that it is a horizontal line through be dashed. Test true so shade (blue) the side that contains |
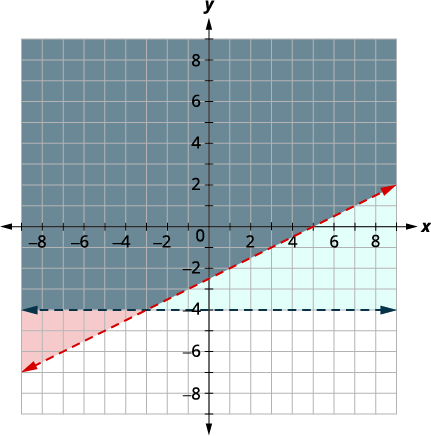 |
The point
The solution is the area shaded twice—which appears as the darkest shaded region.
Solve the system by graphing:
- Answer
-
The solution is the grey region.
Solve the system by graphing:
- Answer
-
The solution is the grey region.
Systems of linear inequalities where the boundary lines are parallel might have no solution. We’ll see this in the next example.
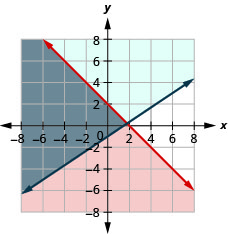
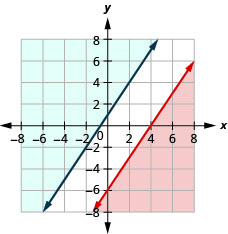
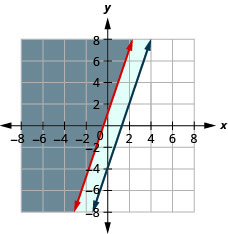
Solve the system by graphing:
Solution:
| Graph and testing a point. The intercepts are and Test shade (red) the side that does not contain |
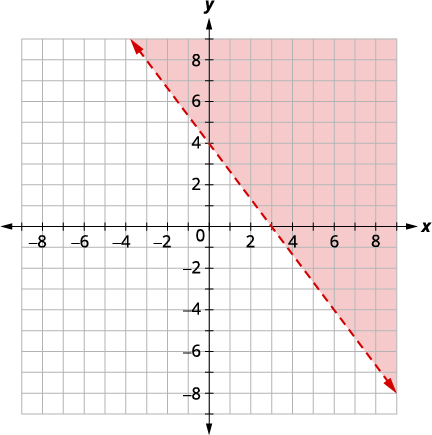 |
| Graph using the slope Test shade (blue) the side that contains |
 |
There is no point in both shaded regions, so the system has no solution.
Solve the system by graphing:
- Answer
-
No solution.
Solve the system by graphing:
- Answer
-
No solution.
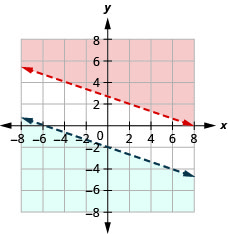
Some systems of linear inequalities where the boundary lines are parallel will have a solution. We’ll see this in the next example.
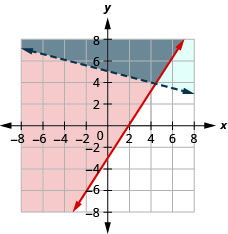
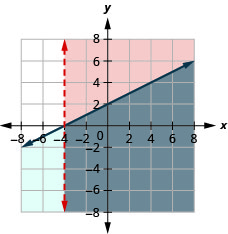
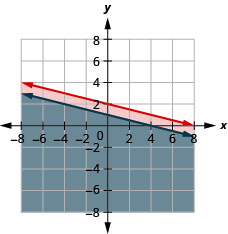
Solve the system by graphing:
Solution:
| Graph using the slope Test shade (red) the side that contains |
 |
| Graph and testing a point. The intercepts are and Choose a test point in the solution and verify that it is a solution to both inequalties. Test shade (blue) the side that does not contain |
 |
No point on the boundary lines is included in the solution as both lines are dashed.
The solution is the region that is shaded twice which is also the solution to
Solve the system by graphing:
- Answer
-
The solution is the grey region.
Solve the system by graphing:
- Answer
-
The solution is the grey region.
Solve Applications of Systems of Inequalities
The first thing we’ll need to do to solve applications of systems of inequalities is to translate each condition into an inequality. Then we graph the system, as we did above, to see the region that contains the solutions. Many situations will be realistic only if both variables are positive, so we add inequalities to the system as additional requirements.
Christy sells her photographs at a booth at a street fair. At the start of the day, she wants to have at least 25 photos to display at her booth. Each small photo she displays costs her $4 and each large photo costs her $10. She doesn’t want to spend more than $200 on photos to display.
a. Write a system of inequalities to model this situation.
b. Graph the system.
c. Could she display 10 small and 20 large photos?
d. Could she display 20 large and 10 small photos?
Solution:
a.
To find the system of equations translate the information.
We have our system of equations.
b.
Since
| To graph Choose To graph Choose |
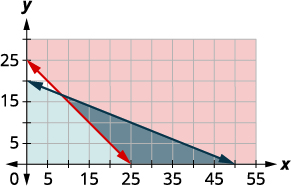 |
The solution of the system is the region of the graph that is shaded the darkest. The boundary line sections that border the darkly-shaded section are included in the solution as are the points on the
c. To determine if 10 small and 20 large photos would work, we look at the graph to see if the point
It is not, Christy would not display 10 small and 20 large photos.
d. To determine if 20 small and 10 large photos would work, we look at the graph to see if the point
It is, so Christy could choose to display 20 small and 10 large photos.
Notice that we could also test the possible solutions by substituting the values into each inequality.
A trailer can carry a maximum weight of 160 pounds and a maximum volume of 15 cubic feet. A microwave oven weighs 30 pounds and has 2 cubic feet of volume, while a printer weighs 20 pounds and has 3 cubic feet of space.
a. Write a system of inequalities to model this situation.
b. Graph the system.
c. Could 4 microwaves and 2 printers be carried on this trailer?
d. Could 7 microwaves and 3 printers be carried on this trailer?
- Answer
-
a.
b.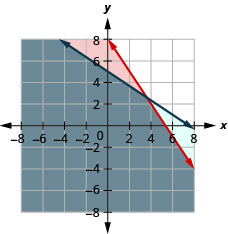
c. yes
d. no
Mary needs to purchase supplies of answer sheets and pencils for a standardized test to be given to the juniors at her high school. The number of the answer sheets needed is at least 5 more than the number of pencils. The pencils cost $2 and the answer sheets cost $1. Mary’s budget for these supplies allows for a maximum cost of $400.
a. Write a system of inequalities to model this situation.
b. Graph the system.
c. Could Mary purchase 100 pencils and 100 answer sheets?
d. Could Mary purchase 150 pencils and 150 answer sheets?
- Answer
-
a.
b.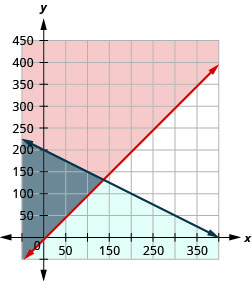
c. no
d. no
When we use variables other than
Omar needs to eat at least 800 calories before going to his team practice. All he wants is hamburgers and cookies, and he doesn’t want to spend more than $5. At the hamburger restaurant near his college, each hamburger has 240 calories and costs $1.40. Each cookie has 160 calories and costs $0.50.
a. Write a system of inequalities to model this situation.
b. Graph the system.
c. Could he eat 3 hamburgers and 1 cookie?
d. Could he eat 2 hamburgers and 4 cookies?
Solution:
a.
To find the system of equations translate the information.
The calories from hamburgers at 240 calories each, plus the calories from cookies at 160 calories each must be more that 800.
b.
Since
| To graph Choose |
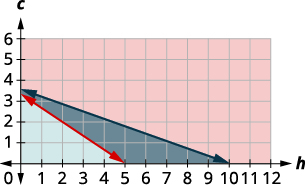 |
Graph
The solution of the system is the region of the graph that is shaded the darkest. The boundary line sections that border the darkly shaded section are included in the solution as are the points on the
c. To determine if 3 hamburgers and 2 cookies would meet Omar’s criteria, we see if the point
d. To determine if 2 hamburgers and 4 cookies would meet Omar’s criteria, we see if the point
We could also test the possible solutions by substituting the values into each inequality.
Tension needs to eat at least an extra 1,000 calories a day to prepare for running a marathon. He has only $25 to spend on the extra food he needs and will spend it on $0.75 donuts which have 360 calories each and $2 energy drinks which have 110 calories.
a. Write a system of inequalities that models this situation.
b. Graph the system.
c. Can he buy 8 donuts and 4 energy drinks and satisfy his caloric needs?
d. Can he buy 1 donut and 3 energy drinks and satisfy his caloric needs?
- Answer
-
a.
b.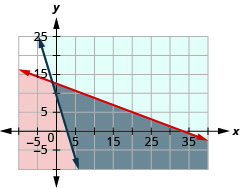
c. yes
d. no
Philip’s doctor tells him he should add at least 1,000 more calories per day to his usual diet. Philip wants to buy protein bars that cost $1.80 each and have 140 calories and juice that costs $1.25 per bottle and have 125 calories. He doesn’t want to spend more than $12.
a. Write a system of inequalities that models this situation.
b. Graph the system.
c. Can he buy 3 protein bars and 5 bottles of juice?
d. Can he buy 5 protein bars and 3 bottles of juice?
- Answer
-
a.
b.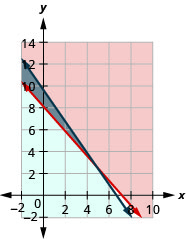
c. yes
d. no
Access these online resources for additional instruction and practice with solving systems of linear inequalities by graphing.
- Solving Systems of Linear Inequalities by Graphing
- Systems of Linear Inequalities
Key Concepts
- Solutions of a System of Linear Inequalities: Solutions of a system of linear inequalities are the values of the variables that make all the inequalities true. The solution of a system of linear inequalities is shown as a shaded region in the
-coordinate system that includes all the points whose ordered pairs make the inequalities true. - How to solve a system of linear inequalities by graphing.
- Graph the first inequality.
Graph the boundary line.
Shade in the side of the boundary line where the inequality is true. - On the same grid, graph the second inequality.
Graph the boundary line.
Shade in the side of that boundary line where the inequality is true. - The solution is the region where the shading overlaps.
- Check by choosing a test point.
- Graph the first inequality.
Glossary
- system of linear inequalities
- Two or more linear inequalities grouped together form a system of linear inequalities.