
5.5: Graphs of the Sine and Cosine Functions
- Page ID
- 120670
\( \newcommand{\vecs}[1]{\overset { \scriptstyle \rightharpoonup} {\mathbf{#1}} } \)
\( \newcommand{\vecd}[1]{\overset{-\!-\!\rightharpoonup}{\vphantom{a}\smash {#1}}} \)
\( \newcommand{\dsum}{\displaystyle\sum\limits} \)
\( \newcommand{\dint}{\displaystyle\int\limits} \)
\( \newcommand{\dlim}{\displaystyle\lim\limits} \)
\( \newcommand{\id}{\mathrm{id}}\) \( \newcommand{\Span}{\mathrm{span}}\)
( \newcommand{\kernel}{\mathrm{null}\,}\) \( \newcommand{\range}{\mathrm{range}\,}\)
\( \newcommand{\RealPart}{\mathrm{Re}}\) \( \newcommand{\ImaginaryPart}{\mathrm{Im}}\)
\( \newcommand{\Argument}{\mathrm{Arg}}\) \( \newcommand{\norm}[1]{\| #1 \|}\)
\( \newcommand{\inner}[2]{\langle #1, #2 \rangle}\)
\( \newcommand{\Span}{\mathrm{span}}\)
\( \newcommand{\id}{\mathrm{id}}\)
\( \newcommand{\Span}{\mathrm{span}}\)
\( \newcommand{\kernel}{\mathrm{null}\,}\)
\( \newcommand{\range}{\mathrm{range}\,}\)
\( \newcommand{\RealPart}{\mathrm{Re}}\)
\( \newcommand{\ImaginaryPart}{\mathrm{Im}}\)
\( \newcommand{\Argument}{\mathrm{Arg}}\)
\( \newcommand{\norm}[1]{\| #1 \|}\)
\( \newcommand{\inner}[2]{\langle #1, #2 \rangle}\)
\( \newcommand{\Span}{\mathrm{span}}\) \( \newcommand{\AA}{\unicode[.8,0]{x212B}}\)
\( \newcommand{\vectorA}[1]{\vec{#1}} % arrow\)
\( \newcommand{\vectorAt}[1]{\vec{\text{#1}}} % arrow\)
\( \newcommand{\vectorB}[1]{\overset { \scriptstyle \rightharpoonup} {\mathbf{#1}} } \)
\( \newcommand{\vectorC}[1]{\textbf{#1}} \)
\( \newcommand{\vectorD}[1]{\overrightarrow{#1}} \)
\( \newcommand{\vectorDt}[1]{\overrightarrow{\text{#1}}} \)
\( \newcommand{\vectE}[1]{\overset{-\!-\!\rightharpoonup}{\vphantom{a}\smash{\mathbf {#1}}}} \)
\( \newcommand{\vecs}[1]{\overset { \scriptstyle \rightharpoonup} {\mathbf{#1}} } \)
\(\newcommand{\longvect}{\overrightarrow}\)
\( \newcommand{\vecd}[1]{\overset{-\!-\!\rightharpoonup}{\vphantom{a}\smash {#1}}} \)
\(\newcommand{\avec}{\mathbf a}\) \(\newcommand{\bvec}{\mathbf b}\) \(\newcommand{\cvec}{\mathbf c}\) \(\newcommand{\dvec}{\mathbf d}\) \(\newcommand{\dtil}{\widetilde{\mathbf d}}\) \(\newcommand{\evec}{\mathbf e}\) \(\newcommand{\fvec}{\mathbf f}\) \(\newcommand{\nvec}{\mathbf n}\) \(\newcommand{\pvec}{\mathbf p}\) \(\newcommand{\qvec}{\mathbf q}\) \(\newcommand{\svec}{\mathbf s}\) \(\newcommand{\tvec}{\mathbf t}\) \(\newcommand{\uvec}{\mathbf u}\) \(\newcommand{\vvec}{\mathbf v}\) \(\newcommand{\wvec}{\mathbf w}\) \(\newcommand{\xvec}{\mathbf x}\) \(\newcommand{\yvec}{\mathbf y}\) \(\newcommand{\zvec}{\mathbf z}\) \(\newcommand{\rvec}{\mathbf r}\) \(\newcommand{\mvec}{\mathbf m}\) \(\newcommand{\zerovec}{\mathbf 0}\) \(\newcommand{\onevec}{\mathbf 1}\) \(\newcommand{\real}{\mathbb R}\) \(\newcommand{\twovec}[2]{\left[\begin{array}{r}#1 \\ #2 \end{array}\right]}\) \(\newcommand{\ctwovec}[2]{\left[\begin{array}{c}#1 \\ #2 \end{array}\right]}\) \(\newcommand{\threevec}[3]{\left[\begin{array}{r}#1 \\ #2 \\ #3 \end{array}\right]}\) \(\newcommand{\cthreevec}[3]{\left[\begin{array}{c}#1 \\ #2 \\ #3 \end{array}\right]}\) \(\newcommand{\fourvec}[4]{\left[\begin{array}{r}#1 \\ #2 \\ #3 \\ #4 \end{array}\right]}\) \(\newcommand{\cfourvec}[4]{\left[\begin{array}{c}#1 \\ #2 \\ #3 \\ #4 \end{array}\right]}\) \(\newcommand{\fivevec}[5]{\left[\begin{array}{r}#1 \\ #2 \\ #3 \\ #4 \\ #5 \\ \end{array}\right]}\) \(\newcommand{\cfivevec}[5]{\left[\begin{array}{c}#1 \\ #2 \\ #3 \\ #4 \\ #5 \\ \end{array}\right]}\) \(\newcommand{\mattwo}[4]{\left[\begin{array}{rr}#1 \amp #2 \\ #3 \amp #4 \\ \end{array}\right]}\) \(\newcommand{\laspan}[1]{\text{Span}\{#1\}}\) \(\newcommand{\bcal}{\cal B}\) \(\newcommand{\ccal}{\cal C}\) \(\newcommand{\scal}{\cal S}\) \(\newcommand{\wcal}{\cal W}\) \(\newcommand{\ecal}{\cal E}\) \(\newcommand{\coords}[2]{\left\{#1\right\}_{#2}}\) \(\newcommand{\gray}[1]{\color{gray}{#1}}\) \(\newcommand{\lgray}[1]{\color{lightgray}{#1}}\) \(\newcommand{\rank}{\operatorname{rank}}\) \(\newcommand{\row}{\text{Row}}\) \(\newcommand{\col}{\text{Col}}\) \(\renewcommand{\row}{\text{Row}}\) \(\newcommand{\nul}{\text{Nul}}\) \(\newcommand{\var}{\text{Var}}\) \(\newcommand{\corr}{\text{corr}}\) \(\newcommand{\len}[1]{\left|#1\right|}\) \(\newcommand{\bbar}{\overline{\bvec}}\) \(\newcommand{\bhat}{\widehat{\bvec}}\) \(\newcommand{\bperp}{\bvec^\perp}\) \(\newcommand{\xhat}{\widehat{\xvec}}\) \(\newcommand{\vhat}{\widehat{\vvec}}\) \(\newcommand{\uhat}{\widehat{\uvec}}\) \(\newcommand{\what}{\widehat{\wvec}}\) \(\newcommand{\Sighat}{\widehat{\Sigma}}\) \(\newcommand{\lt}{<}\) \(\newcommand{\gt}{>}\) \(\newcommand{\amp}{&}\) \(\definecolor{fillinmathshade}{gray}{0.9}\)Learning Objectives
- Graph variations of sinusoidal functions \(y=\sin( x )\) and \(y=\cos( x )\).
- Identify properties of a sinusoidal graph: amplitude, period, vertical shift, and phase shift.
- Construct a sinusoidal equation from a graph or a description
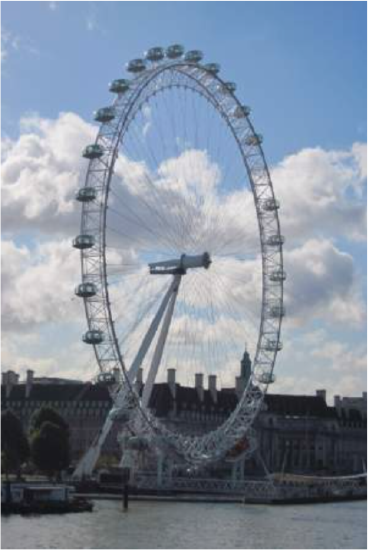
The London Eye (photo by Lippman&Rasmussen, 2010, CC-BY) is a huge Ferris wheel 135 meters (394 feet) tall in London, England, which completes one rotation every 30 minutes. When we look at the behavior of this Ferris wheel it is clear that it completes 1 cycle, or 1 revolution, and then repeats this revolution over and over again.
This is an example of a periodic function, because the Ferris wheel repeats its revolution or one cycle every 30 minutes, and so we say it has a period of 30 minutes.
In this section, we will work to sketch a graph of a rider’s height above the ground over time and express this height as a function of time.
Definition: PERIODIC FUNCTIONS
A periodic function is a function for which a specific horizontal shift, \(P > 0\), results in a function equal to the original function: \(f(x+P)=f(x)\) for all values of \(x\) in the domain of \(f\).
The period of a periodic function is the smallest positive number \(P\) such that \(f(x+P)=f(x)\) for all values of \(x\).
Graphing Sine and Cosine Functions
The graph of \(y = \sin (x) \)
One way to graph the function \(y = \sin (x)\) is to construct a table of \(x\) and \(y\) values for \(y = \sin (x)\). Table \(\PageIndex{1}\) lists some of the values for the sine function.
| \(x\) | \(0\) | \(\dfrac{\pi}{6}\) | \(\dfrac{\pi}{4}\) | \(\dfrac{\pi}{3}\) | \(\dfrac{\pi}{2}\) | \(\dfrac{2\pi}{3}\) | \(\dfrac{3\pi}{4}\) | \(\dfrac{5\pi}{6}\) | \(\pi\) |
|---|---|---|---|---|---|---|---|---|---|
| \(y = \sin (x)\) | \(0\) | \(\dfrac{1}{2}\) | \(\dfrac{\sqrt{2}}{2}\) | \(\dfrac{\sqrt{3}}{2}\) | \(1\) | \(\dfrac{\sqrt{3}}{2}\) | \(\dfrac{\sqrt{2}}{2}\) | \(\dfrac{1}{2}\) | \(0\) |
Plotting the points from the table and continuing along the \(x\)-axis gives the shape of the sine function, which is illustrated in the figure below.
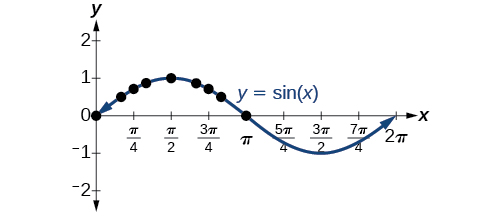
Notice that this graph starts to repeat at \(x=2\pi\), because trigonometric functions of coterminal angles (angles that differ from each other by multiples of \(2\pi\) radians or \(360^{\circ}\), have the same value. Thus, trigonometric functions are periodic functions.
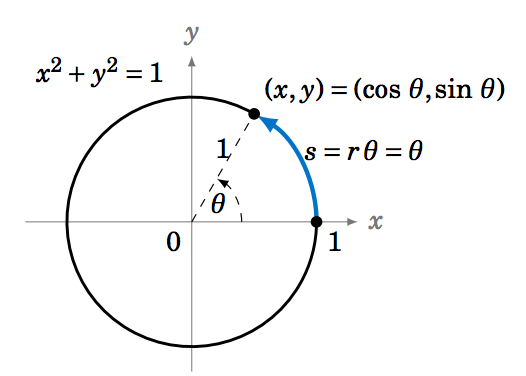
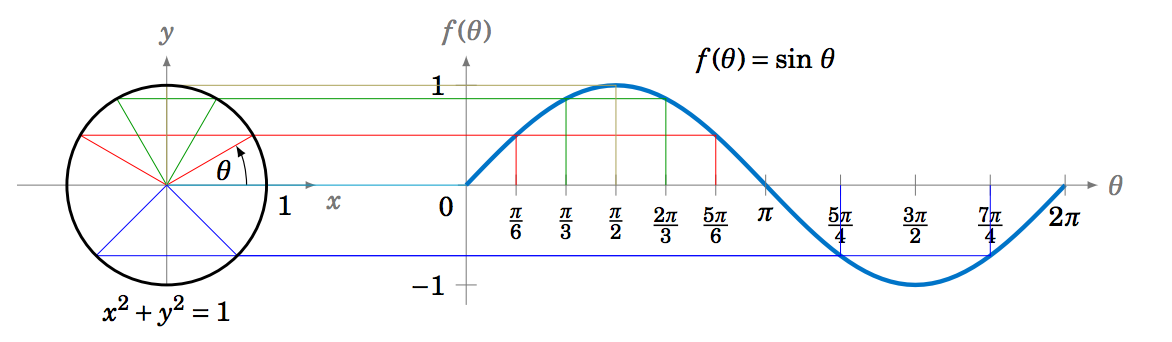
Another way to create the graph of the function \(y = \sin (x)\) uses a geometrical approach and the unit circle. The unit circle is the circle of radius \(1 \) in the \(xy\)-plane consisting of all points \((x,y) \) which satisfy the equation \(x^2 + y^2 = 1 \).
We see in Figure \(\PageIndex{3}\) that any point on the unit circle has coordinates \((x,y)=(\cos\;\theta,\sin\;\theta), \) where \(\theta \) is the angle that the line segment from the origin to \((x,y) \) makes with the positive \(x\)-axis. So as the point \((x,y) \) goes around the circle, its \(y\)-coordinate is \(\sin\;\theta \).
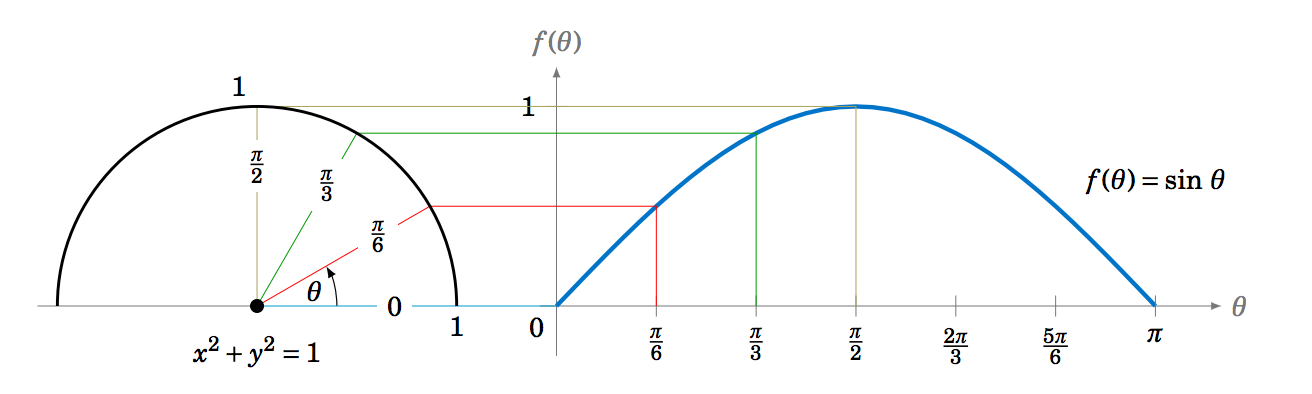
We thus get a correspondence between the \(y\)-coordinates of points on the unit circle and the values \(f(\theta)=\sin\;\theta, \) as shown by the horizontal lines from the unit circle to the graph of \(f(\theta)=\sin\;\theta \) in Figure \(\PageIndex{4}\) for the angles \(\theta = 0 \), \(\dfrac{\pi}{6} \), \(\dfrac{\pi}{3} \), \(\dfrac{\pi}{2} \). These correspond to the values of the sine function in quadrant I.
We can extend the above picture to include angles from \(0 \) to \(2\pi \) radians. Notice how the sine values are positive between \(0\) and \(\pi\), which correspond to the values of the sine function in quadrants I and II on the unit circle, and the sine values are negative between \(\pi\) and \(2\pi\), which correspond to the values of the sine function in quadrants III and IV on the unit circle. Figure \(\PageIndex{5}\) below illustrates what is sometimes called the unit circle definition of the sine function.
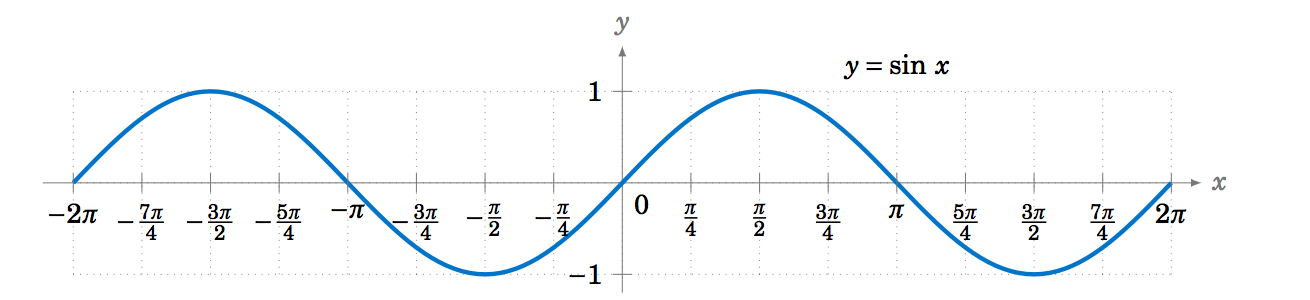
Since the trigonometric functions repeat every \(2\pi \) radians (\(360^\circ\)), we get, for example, the following graph of the function \(y=\sin\;x \) for \(x \) in the interval \([-2\pi , 2\pi]\):
The graph of \(y = \cos (x) \)
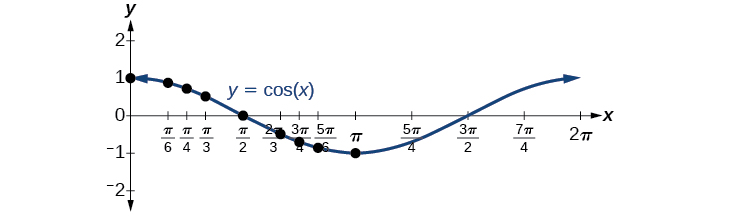
Now let’s take a similar look at the cosine function. To graph the cosine function, we could again use the unit circle idea (using the \(x\)-coordinate of a point that moves around the circle), or we can create a table of values and use them to sketch a graph. Table \(\PageIndex{2}\) below lists some of the values for the cosine function.
| \(x\) | \(0\) | \(\dfrac{\pi}{6}\) | \(\dfrac{\pi}{4}\) | \(\dfrac{\pi}{3}\) | \(\dfrac{\pi}{2}\) | \(\dfrac{2\pi}{3}\) | \(\dfrac{3\pi}{4}\) | \(\dfrac{5\pi}{6}\) | \(\pi\) |
|---|---|---|---|---|---|---|---|---|---|
| \(y = \cos (x)\) | \(1\) | \(\dfrac{\sqrt{3}}{2}\) | \(\dfrac{\sqrt{2}}{2}\) | \(\dfrac{1}{2}\) | \(0\) | \(-\dfrac{1}{2}\) | \(-\dfrac{\sqrt{2}}{2}\) | \(-\dfrac{\sqrt{3}}{2}\) | \(-1\) |
As with the sine function, we can plots points to create a graph of the cosine function as in the figure below.
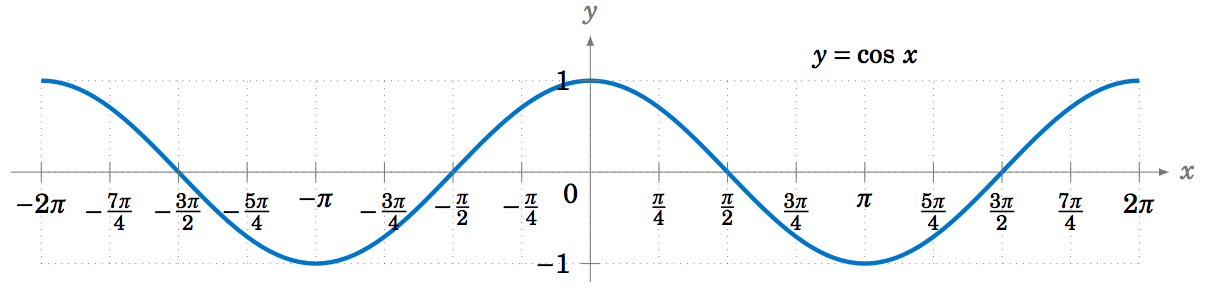
Once again, because trigonometric functions of coterminal angles have exactly the same values, the cosine function, like the sine function, is periodic, and has a period of \(2\pi\).
Characteristics of Sinusoidal Functions
A function that has the same general shape as a sine or cosine function is known as a sinusoidal function.
In both graphs, the shape of the graph begins repeating after 2\(\pi \), which means the functions are periodic with a period of \(2\pi\). Indeed, since any coterminal angles will have the same sine and cosine values, we could conclude that \(\sin (\theta +2\pi )=\sin (\theta ) \) and \(\cos (\theta +2\pi )=\cos (\theta )\)
In other words, if you were to shift either graph horizontally by 2\(\pi \), the resulting shape would be identical to the original function.
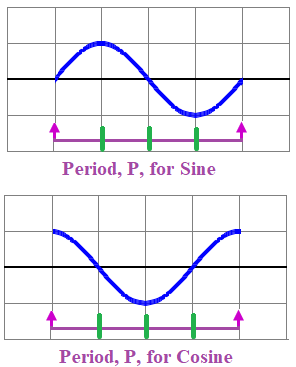
PERIOD OF SINE AND COSINE
The periods of the sine function \(y = \sin (x), \) and cosine function \(y = \cos(x), \) are both 2\(\pi \).
The diagrams below illustrate one period of the sine and cosine functions. A cycle is one complete pattern of the graph. Notice that the sine function starts in the vertical middle of a cycle whereas the cosine function starts at the vertical top of a cycle.
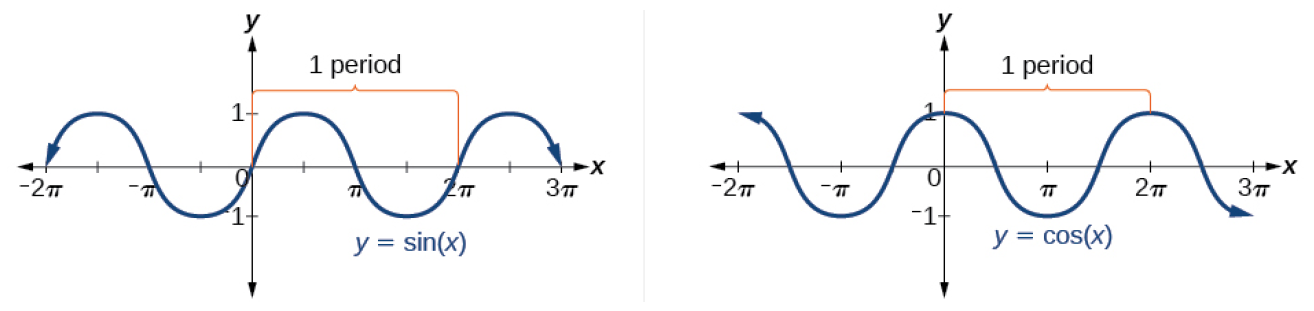
Both of these functions are defined for all real numbers, since we can evaluate the sine and cosine of any angle. It is also clear by looking at the graphs that the range of both functions must be the interval [-1, 1].
DOMAIN AND RANGE OF SINE AND COSINE
The domain of sine and cosine is all real numbers, \((-\infty ,\infty )\).
The range of sine and cosine is the interval [-1, 1].
Looking again at the sine and cosine functions on a domain centered at the \(y\)-axis helps reveal symmetries.
|
Figure \(\PageIndex{10}\): Odd symmetry of the sine function |
Figure \(\PageIndex{11}\): Even symmetry of the cosine function |
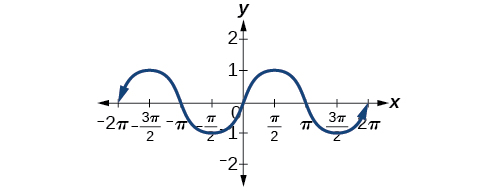
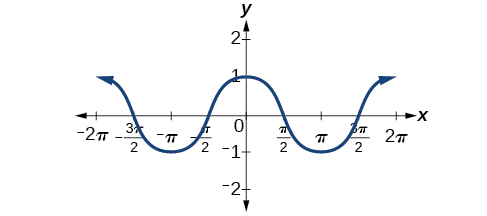
As we can see in Figure \(\PageIndex{10}\), the sine function is symmetric about the origin, the same symmetry the cubic function has, making it an odd function. Figure \(\PageIndex{11}\) shows that the cosine function is symmetric about the \(y\)-axis, the same symmetry as the quadratic function, making it an even function.
NEGATIVE ANGLE IDENTITIES
The sine is an odd function, symmetric about the origin, so \[\sin (-\theta )=-\sin (\theta ) \nonumber \]
The cosine is an even function, symmetric about the y-axis, so \[\cos (-\theta )=\cos (\theta ) \nonumber \]
The sine and cosine graphs are horizontal transformations of each other. We can prove this by using the Cofunction Identity and the Negative Angle Identity for cosine.
\[\nonumber \begin{align*}
\sin (\theta ) &=\cos \left(\dfrac{\pi }{2} -\theta \right) &&\text{ Cofunction Identity} \\ \nonumber
&= \cos \left(-\theta +\dfrac{\pi }{2} \right)=\cos \left(-\left(\theta -\dfrac{\pi }{2} \right)\right) \\ \nonumber
&=\cos \left(\theta -\dfrac{\pi }{2} \right) && \text{ Negative Angle Identity }
\end{align*}\]
Now we can clearly see that if we horizontally shift the cosine function to the right by \(\pi \)/2 we get the sine function.
CHARACTERISTICS OF SINE AND COSINE FUNCTIONS
The sine and cosine functions have several distinct characteristics:
- They are periodic functions with a period of \(2\pi\).
- The domain of each function is \((−\infty,\infty)\) and the range is \([ −1,1 ]\).
- The graph of \(y=\sin\space x\) is symmetric about the origin, because it is an odd function.
- The graph of \(y=\cos\space x\) is symmetric about they- \(y\)-axis, because it is an even function.
Investigating Sinusoidal Functions
As we can see, sine and cosine functions have a regular period and range. If we watch ocean waves or ripples on a pond, we will see that they resemble the sine or cosine functions. However, they are not necessarily identical. Some are taller or longer than others.
Sinusoidal Functions
A function that has the same general shape as a sine or cosine function is known as a sinusoidal function. The general forms of sinusoidal functions are
\[ \fbox{ \(y=A\sin(Bx−C)+D\) } \qquad \text{ and } \qquad \fbox{\(y=A\sin(Bx−C)+D\) } \label{genEqn}\]
The variables \(A\), \(B\), \(C\), and \(D\) are sometimes called parameters, and their values affect what the graph of the function looks like. We often refer to the expression inside the parentheses as the argument of the function.
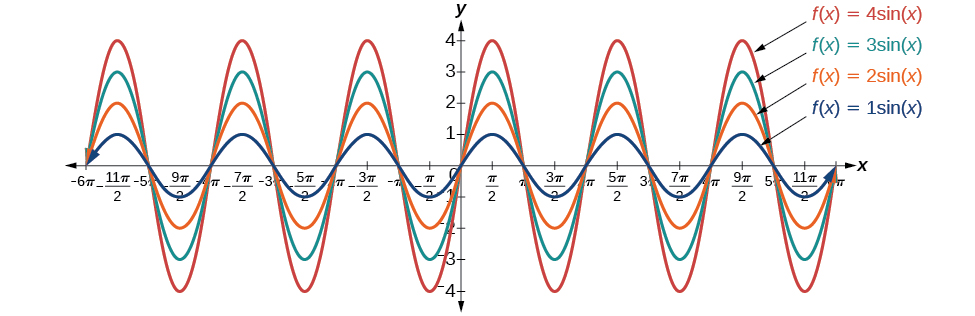
Amplitude of Sinusoidal Functions
Starting with the parameter \(A\), we will analyze how it is related to the amplitude, or greatest distance from rest.
AMPLITUDE OF SINUSOIDAL FUNCTIONS and vertical stretching
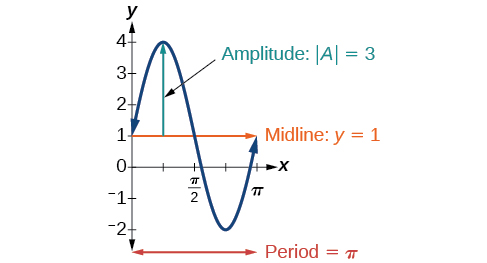
The amplitude of the sinusoidal functions \(y=A\sin(Bx−C)+D\) and \(y=A\cos(Bx−C)+D\) is \(|A|\), the absolute value of the parameter \(A\).
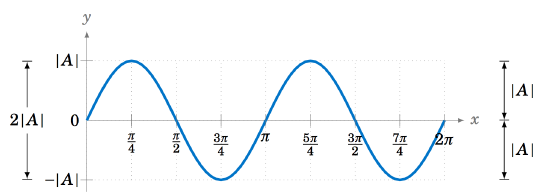
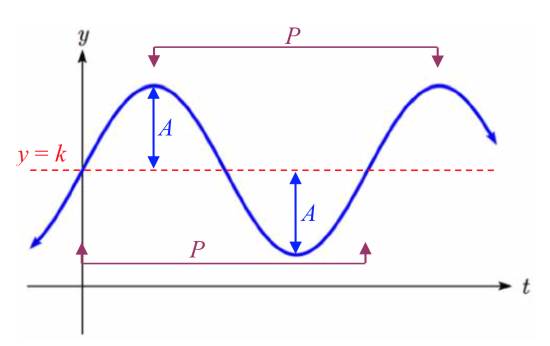
The amplitude can be directly observed on a graph of a sinusoidal function. It is half the height between the top and the bottom of the curve and can be calculated using the formula:
\(|A| = \text{amplitude} = \dfrac{1}{2}∣ \text{maximum} − \text{minimum} | \)
Amplitude can also be determined by using the fact that it is the vertical height from either the top or bottom of the curve to the horizontal line (called the midline) that divides the curve horizontally in half.
Equation parameter \(A\) represents the vertical stretch factor.
- If \(| A |>1\), the function is vertically stretched.
- If \(| A |<1\), the function is vertically compressed.
- Reflection over the \(x\)-axis occurs when \(A\) is negative\(^{*}\).
\(^{*}\)Before preparing to graph the function, if \(B\) is negative, rewrite the equation using the Negative Angle Identities so the equation under analysis has \(B >0\). (The argument \(Bx-C\) becomes \(-Bx+C\) and if the sine function is being used, the sign of \(A\) changes.)
- When parameter \(B\) is positive, then if parameter \(A\) is negative, the result is a reflection across the \(x\)-axis.
Example \(\PageIndex{1}\): Identify the Amplitude of a Sine or Cosine Function
What is the amplitude of the sinusoidal function \(f(x)=−4\sin(x)\)? Is the function stretched or compressed vertically?
across the \(x\)-axis
Solution
Let’s begin by comparing the function to the simplified form \(y=A\sin(Bx)\).
In the given function, \(A=−4\), so the amplitude is \(| A |=| −4 |=4\). The function is stretched vertically because \(|A|>1\).
The negative value of \(A\) results in a reflection across the \(x\)-axis of the sine function, as shown in the figure to the right.
![]() Try It \(\PageIndex{1a}\)
Try It \(\PageIndex{1a}\)
What is the amplitude of the sinusoidal function \(f(x)=\dfrac{1}{2}\sin(x)\)? Is the function stretched or compressed vertically?
- Answer
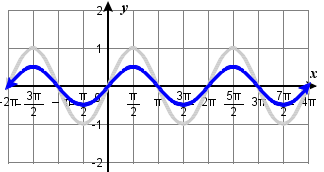 The amplitude is \(\dfrac{1}{2}\). The graph is vertically compressed.
\(f(x)\) is in dark blue in the graph below. The basic sine function is in light grey.
![]() Try It \(\PageIndex{1b}\)
Try It \(\PageIndex{1b}\)
What is the amplitude of the function \(f(x)=7\cos(x)\)? Sketch a graph of this function.
- Answer
-
![A graph of 7cos(x). Graph has amplitude of 7, period of 2pi, and range of [-7,7].](https://math.libretexts.org/@api/deki/files/94256/5.5.1b_ti_ans.png?revision=1&size=bestfit&width=323&height=170)
A graph of \(f(x)=7\cos(x)\). Amplitude is \(7\)
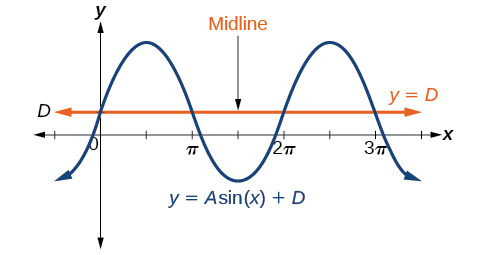
Vertical shift of Sinusoidal Functions
Definition: MIDLINE
The midline of a sinusoidal function is the center value of the function -- the \(y\)-value that the function oscillates above and below.
The midline of the basic sine and cosine functions, \(y = \sin (x)\) and \( y = \cos (x), \) is the line \(y=0\).
From our work with transformations, we know that adding a constant to a function shifts the entire graph vertically. So when using the general form of our sinusoidal equations (Equation \ref{genEqn}), the parameter \(D\) indicates the vertical shift of the graph up or down from \(y = 0\). For example, in Figure \(\PageIndex{14}\), the function \(y=\sin(x)+D\) has its midline at \(y=D\) and the entire basic graph \(y = \sin(x)\) has been shifted up \(D\) units.
VERTICAL SHIFT OF SINUSOIDAL FUNCTIONS
The vertical shift of the sinusoidal functions \(y=A\sin(Bx−C)+D\) and \(y=A\cos(Bx−C)+D\) is indicated by the value of the parameter \(D\).
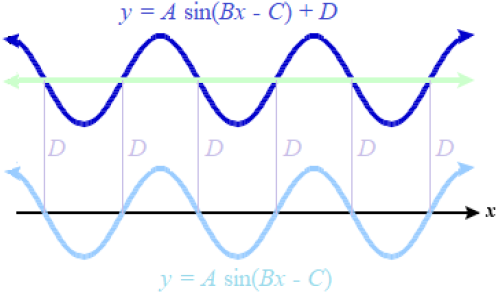
and \(y = A\sin(Bx - C) \) .
The equation for the midline of a sinusoidal function is \(y=D\)
- If \(D > 0\) the graph has been shifted up \(D\) units
- If \(D < 0\) the graph has been shifted down \(D\) units
The vertical shift can be directly observed on a graph of a sinusoidal function. It is the vertical distance the midline has moved up or down from the \(x\)-axis.
- Local maxima are a distance \(|A|\) above the vertical midline of the graph, and have \(y\) coordinates of \(y=D + |A|\).
- Local minima will be the same distance below the midline, and have \(y\) coordinates of \(y=D - |A|\).
- The range of sinusoidal functions in interval notation is \( [D-|A|, D+|A| ] \)
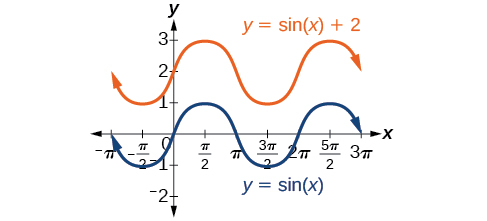
Any value of \(D\) other than zero shifts the graph up or down. Figure \(\PageIndex{16}\) compares \(f(x)=\sin x\) with \(f(x)=\sin x+2\), which is shifted \(2\) units up on a graph.
Example \(\PageIndex{2}\): Identify the Vertical Shift of a Sinusoidal Function
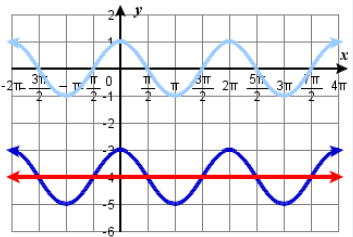
Given the function \(f(\theta )=\cos (\theta )-4\),
- What is the midline of the function \(f(\theta )=\cos (\theta )-4\)?
- Determine the direction and magnitude of the transformation needed on the basic cosine function to obtain \(f(\theta )\).
- Sketch a graph of the function.
Solution
(1). Because the parameter \(D=−4\), the midline is \(y = -4\). \(\qquad\)
(2). Shift \(y = \cos (x)\) down 4 units to obtain \(f(\theta )\). \(\qquad\)
(3). The graph below shows the basic function \(y = \cos (x)\) , the midline for \(f\), and \(f(\theta )\).
![]() Try It \(\PageIndex{2}\)
Try It \(\PageIndex{2}\)
Determine the direction and magnitude of the vertical shift for \(f(x)=\sin(x)+2\). State the equation for the midline and sketch the graph.
- Answer
-
The midline is \(y = 2\). Shift \(y = \sin (x)\) up 2 units to obtain \(f(x)\).
The graph below shows \(f(x)\), the midline \(y = 2\), and the basic function \(y = \sin (x)\).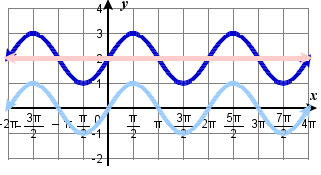
Period of Sinusoidal Functions
Looking at the forms of sinusoidal functions, we can see that they are transformations of the sine and cosine functions. We can use what we know about transformations to determine the period. Some examples of sinusoidal equations and their graphs are below. Look at each graph and observe what the length of one complete cycle (period) of the function is and then relate the observed period to the equation itself. The graph of the basic function \(y = \sin(t)\) is also shown (dashes).
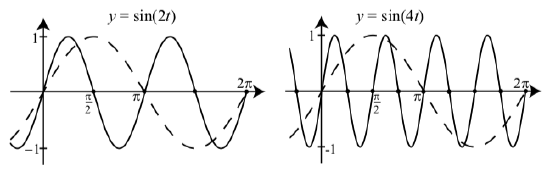
The graph of \(y = \sin({\color{Cerulean}{2}}t)\) has one complete cycle over the interval \([0, \pi]\) and so its period is \(P = \pi= \dfrac{2\pi}{\color{Cerulean}{2}}\).
The graph of \(y = \sin({\color{Cerulean}{4}}t)\) has one complete cycle over the interval \([0, \dfrac{\pi}{2}]\) and so its period is \(P = \dfrac{\pi}{2}= \dfrac{2\pi}{\color{Cerulean}{4}}\).
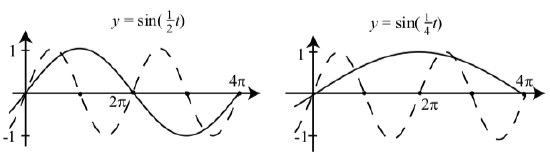
The graph of \(y = \sin\left({\color{Cerulean}{\dfrac{1}{2}}}t\right)\) has one complete cycle over the interval \([0, 4\pi]\) and so its period is \(P = 4\pi= \dfrac{2\pi}{\color{Cerulean}{\dfrac{1}{2}}}\).
The graph of \(y = \sin\left({\color{Cerulean}{\dfrac{1}{4}}}t\right)\) has one-half of a complete cycle over the interval \([0, 4\pi]\) and so its period is \(P = 8\pi= \dfrac{2\pi}{\color{Cerulean}{\dfrac{1}{4}}}\).
The conclusion we reach is that the period for equations of the sine and cosine functions \(y=A\sin( {\color{Cerulean}{B}}x )\) and \(y=A\cos( {\color{Cerulean}{B}}x )\) is \(P = \dfrac{2\pi}{ \color{Cerulean}{B} }\). In fact this is also true for the more general forms of the sinusoidal functions.
PERIOD OF SINUSOIDAL FUNCTIONS and horizontal stretching
 The period \(P\) of the sinusoidal functions
\(y=A\sin(Bx−C)+D\) and \(y=A\cos(Bx−C)+D\) is \(\quad\) \(P = \dfrac{2\pi}{|B|}\).
The period \(P\) can be directly observed on a graph of a sinusoidal function. It is the horizontal length of one complete cycle. \(P\) is always positive.
Notice that the parameter \(B\) is not directly visible from a graph, but it can be calculated once the period \(P\) IS obtained by looking at the graph. The period is inversely proportional to the parameter \(|B|\).
- If \(|B|>1\), then the period is less than \(2\pi\) and the function undergoes a horizontal compression
- if \(| B |<1\), then the period is greater than \(2\pi\) and the function undergoes a horizontal stretch
- If \(B\) is negative, before graphing the function, rewrite the equation using the Negative Angle Identities (also known as the Even/Odd Properties) so the equation under analysis has \(B >0\) and reflection will be done properly.
When graphing a sinusoidal function, the period is broken down into quarters. When \(C=0\), these quarter points are at the beginning of a cycle \( \color{Green}{x=0}\), \(\color{Green}{x=\dfrac{1}{4}P}\), \(\color{Green}{x=\dfrac{1}{2}P}\), \(\color{Green}{x=\dfrac{3}{4}P}\), and at the end of a cycle \( \color{Green}{x=P}\). These quarter points, using the shape of the parent function as a guide, are the locations, in one cycle, of the local minimum, local maximum, and intersection with the midline.
A good question now is, “Why are the periods of sinusoidal functions always equal to \(\tfrac{2\pi}{B}\)”? From our work with transformations, we know that the coefficient of \(x\) affects the amount of horizontal stretch or compression of a graph. When the argument of the general form of a sinusoidal function is zero, the graph of the function will start a cycle. This occurs when \(Bx_0 - C = 0\). When the argument of that same sinusoidal function is \(2\pi\) , the graph of that function will end the cycle that was started. This occurs when \(Bx_1 - C = 2\pi\). The length of a cycle is the difference between \(x\)-coordinates at the end and start of a cycle. By subtracting these two equations \( (Bx_1 - C) - (Bx_0 - C ) = 2\pi - 0\) we obtain \( B(x_1-x_0) =2\pi \) or \(x_1-x_0 = \tfrac{2\pi}{B}\).
Example \(\PageIndex{3}\): Identify the Period of a Sine or Cosine Function
Determine the period of the function \(f(x)=\sin\left(\dfrac{\pi}{6}x\right)\). Then sketch the function.
Solution
 Let’s begin by comparing the equation to the general form \(y=A\sin(Bx)\).
In the given equation, \(B=\dfrac{\pi}{6}\), so the period will be \(\quad\) \( P =\dfrac{2\pi}{|B|} =\dfrac{2\pi}{\tfrac{\pi}{6}} =2\pi ⋅ \dfrac{6}{\pi} =12 \)
To graph the function, the sketch will take on the general shape of a sine function, starting a cycle at \(x=0\) with quarter points at \(x=3\), \(x=6\), \(x=9\), and \(x=12\) to complete one cycle.
![]() Try It \(\PageIndex{3}\)
Try It \(\PageIndex{3}\)
Determine the period of the function \(g(x)=\cos \left( \dfrac{x}{3} \right) \). Then sketch the function.
- Answer
-
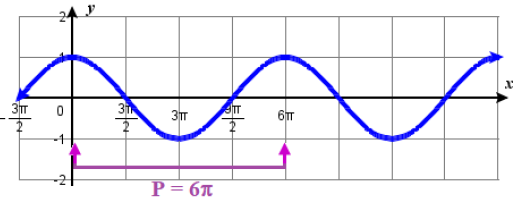 \(6\pi\). To graph the function, the sketch will take on the general shape of a cosine function, starting a cycle at \(x=0\) with quarter points at \(x=1.5\pi\), \(x=3\pi\), \(x=4.5\pi\), and \(x=6\pi\) to complete one cycle.
Summary: Period, Amplitude, and Vertical Shift
TRANSFORMATIONS OF SINE AND COSINE
|
Given an equation in the form \(y=A\sin(Bx)+D \quad \) or \(\quad y=A\cos(Bx)+D\) Rewrite the equation if necessary so that \(B > 0\). \(A\) is the vertical stretch, and \(|A|\) is the amplitude of the function. When \(A\) is negative, the graph has been reflected over the \(x\)-axis.
\(B\) is inversely proportional to the amount of horizontal stretch/compression, and is related to the period, \(P\), by the equation \(P=\dfrac{2\pi }{B}\).
\(D\) is the vertical shift and determines the equation, \(y=D\), for the midline of the function. |
Graph for \(y = A \sin \left( \dfrac{2\pi}{|P|} t \right) + k \) |
Sketch a Graph From an Equation
Instead of focusing on the general form equations \(y=A\sin(Bx-C)+D \text{ and } y=A\cos(Bx-C)+D\) we will let \(C=0\) and work with a simplified form of the equations in the following examples.
![]() Howto: Sketch the graph of a sinusoidal function that does not have a phase shift.
Howto: Sketch the graph of a sinusoidal function that does not have a phase shift.
 Before doing anything else, if \(B\), the coefficient of \(x\) in the argument is negative, use the Even/Odd Properties to rewrite the sinusoidal equation so that \(B\) is positive (This could change the sign of \(A\)).
Given sinusoidal functions of the form
\(y=A\sin(Bx)+D \quad \) or \(\quad y=A\cos(Bx)+D\)
- Identify the amplitude, \(| A |\). If \(B\) is negative, rewrite the sinusoidal equation so that \(B\) is positive (This rewrite could change the sign of \(A\)).
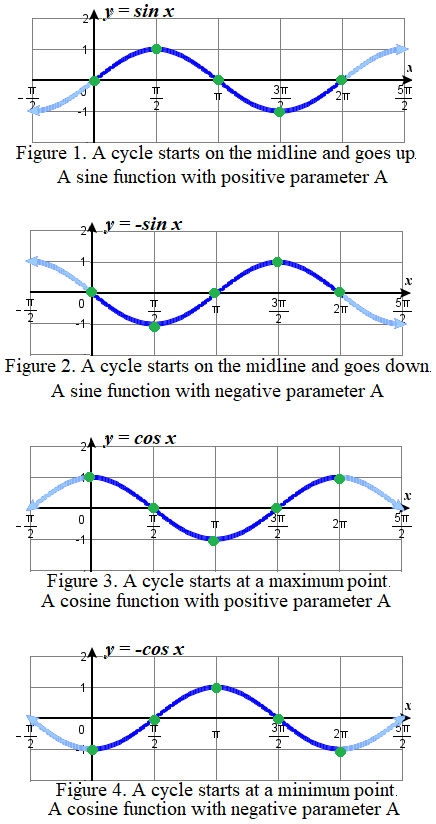
- Use the equation and its sign for \(A\) to determine the shape of the graph. The four options are shown in the graphs to the right.
- Identify the vertical shift from the parameter \(D\). The midline is the line \(y=D\). The graph will oscillate \(| A | \) units above and below this line, so the maximum is \(y=D+|A|\), and the minimum is \(y=D-|A|\).
- Identify the period, \(P=\dfrac{2\pi}{| B |}\).
- Divide the period into quarters, These quarter points are at the beginning of a cycle (\(\color{Green}{x=0}\)), \(\color{Green}{x=\tfrac{1}{4}P}\), \(\color{Green}{x=\tfrac{1}{2}P}\), \(\color{Green}{x=\tfrac{3}{4}P}\), and at the end of a cycle (\(\color{Green}{x=P}\)). These quarter points, using the shape of the parent function as a guide, are the locations, in one cycle, of the local minimum, local maximum, and intersection with the midline. (See accompanying graphs)
Quarter points correspond to intervals of equal length each representing \(1/4\) of the period. They indicate the horizontal location of the maximum and minimum values and where the midline is crossed for one period of the function. The green dots in the figures to the right show where the quarter points are for the four basic sinusoidal functions.
Example \(\PageIndex{4a}\): Graphing a Function and Identifying the Amplitude and Period
Sketch the graph of
- \(f(x)=−2\sin\left(\dfrac{\pi x}{2}\right)\).
- \(g(x) = 2\sin\left(\dfrac{-\pi x}{2}\right)\).
Solution
![A graph of -2sin((pi/2)x). Graph has range of [-2,2], period of 4, and amplitude of 2.](https://math.libretexts.org/@api/deki/files/6907/CNX_Precalc_Figure_06_01_019.jpg?revision=1)
a. Let’s begin by comparing the equation to the form \(y=A\sin(Bx)+D\).
- Step 1. We can see from the equation that \(A=−2\), so the amplitude is 2. \(\quad\) \(|A|=2 \)
- Step 2. Because \(A\) is negative, the graph is a reflection over the \(x\)-axis of the basic sine function. The shape of the graph is like the graph for \(y = - \sin (x)\), starting on the \(y\)-axis at the midline and going down.
- Step 3. The parameter \(D\) is zero so the midline is along \(y=D \Rightarrow y=0\) or the \(x\)-axis, and, since the amplitude is \(2\), the graph oscillates between \(2\) and \(-2\).
- Step 4. The equation shows that \(B=\dfrac{\pi}{2}\), so the period is \(\quad\) \( P =\dfrac{2\pi}{|B|} =\dfrac{2\pi}{\dfrac{\pi}{2}}=2\pi \cdot \dfrac{2}{\pi}=4 \)
- Step 5. The quarter points are at \(x = 0, 1, 2, 3, 4\). One cycle starts at the midline and goes down. The graph intersects the midline at \(x = 0\), \(x=2\), and \(x=4\). A local minimum will occur at \(2\) units below the midline, at \(x=1\). A local maximum will occur at \(2\) units above the midline, at \(x=3\). The graph of the function is below.
b.
- Preparation. Because \(B\) is negative, the equation needs to be rewritten using the Negative Angle Identity. Since \(\sin(-x) = -\sin (x)\), then \(g(x) = −2\sin\left(\dfrac{\pi x}{2}\right),\) which is the same as \(f(x)\) in part (a).
- Step 1. We can see from the equation that \(|A|=2\), so the amplitude is 2.
- Step 2. Using the modified version of \(g\), \(A\) is negative, so the shape of the graph for \(g\) is like the shape of \(y = - \sin (x)\). [Notice that if the Negative Angle Identity is not used, the shape chosen would be that of \(y = \sin(x)\) , which would result in a graph that would not be correct].
- Step 3. The midline is \(y=0\).
- Step 4. The period is \(P = 4\).
- Step 5. The quarter points are at \(x = 0, 1, 2, 3, 4\), and the graph is the same as that in the graph above.
Example \(\PageIndex{4b}\)
Determine the midline, amplitude, and period of the function \(y=3\sin (2x)+1\). Then sketch the function.
Solution
|
Step 1. \(A=3\), so the amplitude is \(| A |=3\). Step 2. The graph has the same shape as the graph for \(y=\sin(x)\), starting on the \(y\)-axis at the midline and going up. Step 3. \(D=1\), so the midline is \(y=1\), and the graph will oscillate between \(D-|A|\) and |\(D+|A|\) or between \(y=-2\) and \(y=4\). Step 4. \(B=2\), so the period is \(P=\dfrac{2\pi}{| B |}=\dfrac{2\pi}{2}=\pi\). Step 5. The quarter points are at \(x=0, \dfrac{\pi}{4}, \dfrac{\pi}{2}, \dfrac{3}{4}, \pi\). One cycle starts at the midline and goes up. One cycle of the function appears in the graph on the right. |
|
![]() Try It \(\PageIndex{4}\)
Try It \(\PageIndex{4}\)
Sketch a graph of \( g(x)=−0.8\cos(2x)\). Determine the midline, amplitude, and period.
- Answer
-
![A graph of -0.8cos(2x). Graph has range of [-0.8, 0.8], period of pi, amplitude of 0.8, and is reflected about the x-axis compared to it's parent function cos(x).](https://math.libretexts.org/@api/deki/files/6908/CNX_Precalc_Figure_06_01_020.jpg?revision=1)
\( g(x)=−0.8\cos(2x)\) amplitude: \(| A |=0.8\);
shape: \(y=-\cos(x)\);
midline: \(y=0\), minimum \(y=-.8\), maximum: \(y=.8\);
period: \(P=\dfrac{2\pi}{| B |}=\pi\);
quarter points: \(x=0, \dfrac{\pi}{4}, \dfrac{\pi}{2}, \dfrac{3\pi}{4}, \text{ and }\pi\).
Construct an Equation From a Graph
![]() Howto: Construct an equation from the graph of a sinusoidal function.
Howto: Construct an equation from the graph of a sinusoidal function.
Given a sinusoidal graph, construct one of the sinusoidal functions: \(y=A\sin(Bx)+D\) and \(y=A\cos(Bx)+D\)
- Identify the amplitude, \(| A |\), half the distance between the highest and lowest values of \(y\) on the graph.
- Identify the midline, the line halfway between the highest and lowest values of \(y\) on the graph. This is parameter \(D\).
- Look at the shape of the graph at the point where it intersects the y-axis.
- If the point is on the midline and the graph is going up, use the sine function and make parameter \(A\) positive. The shape is the same as \(y = \sin x\).
- If the point is on the midline and the graph is going down, use the sine function and make parameter \(A\) negative. The shape is the same as \(y = -\sin x\).
- If the point is a maximum, use the cosine function and make parameter \(A\) positive. The shape is the same as \(y = \cos x\).
- If the point is a minimum, use the cosine function and make parameter \(A\) negative. The shape is the same as \(y = -\cos x\).
- Identify the period \(P\), the horizontal distance between peaks on the graph. Calculate parameter \(B\) from the equation \(B=\dfrac{2\pi}{P}\).
- Use the values of the parameters obtained above to construct a possible sinusoidal equation for the graph.
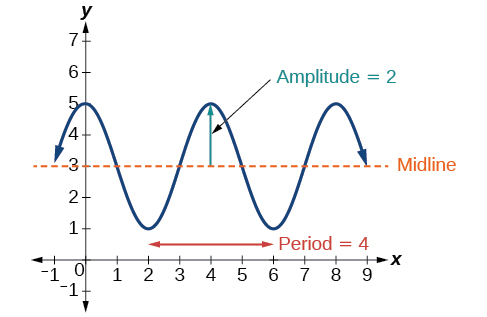
Example \(\PageIndex{5a}\): Identifying the Equation for a Sinusoidal Function from a Graph
Determine the formula for the function in Figure \(\PageIndex{27}\).
![A graph of -0.5cos(x)+0.5. The graph has an amplitude of 0.5. The graph has a period of 2pi. The graph has a range of [0, 1]. The graph is also reflected about the x-axis from the parent function cos(x).](https://math.libretexts.org/@api/deki/files/6903/CNX_Precalc_Figure_06_01_015.jpg?revision=1)
Solution
To determine the equation, we need to identify each parameter value in the general form of a sinusoidal function.
\(y=A\sin (Bx)+D \qquad \qquad y=A\cos (Bx)+D\)
The amplitude is half the difference between the height of local maxima and minima. This difference is \(1\), so \(| A |=\frac{1}{2}=0.5\). Another way to obtain the amplitude is to identify the midline and observe the greatest distance above and below the midline, which is the amplitude.
In general, the shape of the graph indicates a sinusoidal function. When \(x=0\), the graph has an extreme point, \((0,0)\). Since the reflected cosine function has an extreme (minimum) point for \(x=0\), let us write our equation in terms of a reflected cosine function. Therefore, the parameter \(A\) must be negative, and \(A=−0.5\).
We can see that the graph rises and falls an equal distance above and below \(y=0.5\). This value, which is the midline, is \(D\) in the equation, so \(D=0.5\).
The period is \(P=2\pi\), so the graph is not horizontally stretched or compressed, so \(B=\dfrac{2\pi}{P}=1\).
Putting this all together,
\(g(x)=−0.5\cos (x)+0.5\)
![]() Try It \(\PageIndex{5a}\)
Try It \(\PageIndex{5a}\)
Determine the formula for the function in the graph below
![A graph of sin(x)+2. Period of 2pi, amplitude of 1, and range of [1, 3].](https://math.libretexts.org/@api/deki/files/6904/CNX_Precalc_Figure_06_01_016.jpg?revision=1)
- Answer
- amplitude is half the difference between maximum and minimum so \(|A| = 1\); midline is \(y=2\) so \(D=2\). When \(x=0\), the graph is on the midline and is going up, so the shape is the same as for the function \(y=sin (x)\), so write the equation in terms of a sine function, and \(A\) is positive, so \(A=1\). The period is \(P = 2\pi\), so there has been no horizontal stretching, so \(B=\dfrac{2\pi}{P}=1\). Putting it all together, the equation is: \(f(x)=\sin(x)+2\)
Example \(\PageIndex{5b}\)
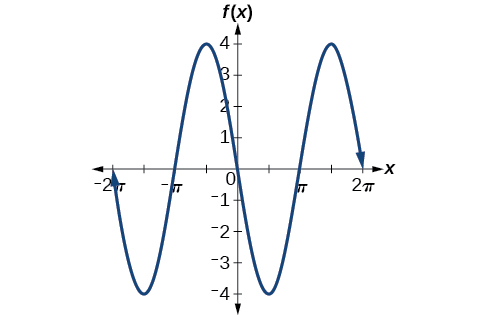
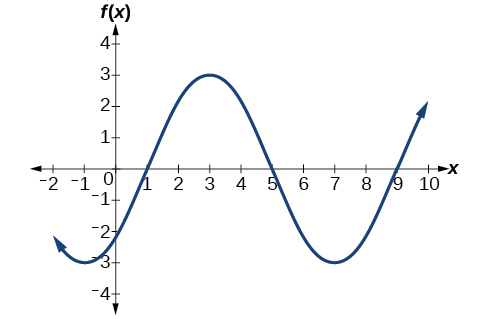
Find a formula for the sinusoidal function graphed here.
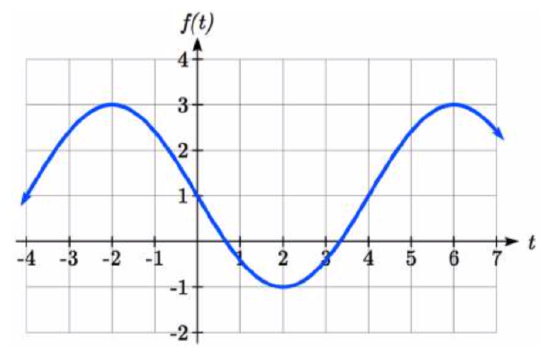
Solution
The amplitude is half the distance between the highest value and lowest value of the graph. So the amplitude is \(\dfrac{3-(-1)}{2} = 2\).
The graph oscillates from a low of -1 to a high of 3, putting the midline at \(y = 1\), halfway between.
At \(t = 0\), the graph is at the midline value, which tells us the graph can most easily be represented as a sine function. Since the graph then decreases, this must be a vertical reflection of the sine function. Therefore the shape is the same as that of \(y=-\sin(t)\) so \(A\) is negative, and thus \(A=-2\).
The period of the graph is 8. We can measure this from the first peak at \(x = -2\) to the second at \(x = 6\). Since the period is 8, the stretch/compression factor we will use will be
\[B=\dfrac{2\pi }{P} =\dfrac{2\pi }{8} =\dfrac{\pi }{4}\nonumber\]
Putting this all together,
\[f(t)=-2\sin \left(\dfrac{\pi }{4} t\right)+1\nonumber\]
![]() Try It \(\PageIndex{5b}\)
Try It \(\PageIndex{5b}\)
If a sinusoidal function has a maximum value at point (0,5), has an amplitude of 2, and a period of 4, write a formula for the function. Sketch the graph.
- Answer
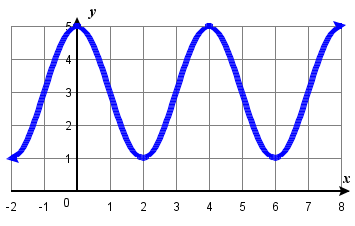 We are given \(|A|=2\) and there is a maximum is on the \(y\)-axis. Therefore the shape is the same as that of \(y=cos (x)\), so \(A\) is positive, and thus \(A=2\). The midline is at \(y=3\), so \(D=3\). \(B= \dfrac{2\pi}{4}=\dfrac{\pi}{2}\).
- Putting it all together, a possible equation would be \(f(x)=2\cos \left(\dfrac{\pi }{2} x\right)+3\). Its graph is below.
Phase Shift of Sinusoidal Functions
starting at \(x=0\) and ending at \(\dfrac{2\pi}{B}\).
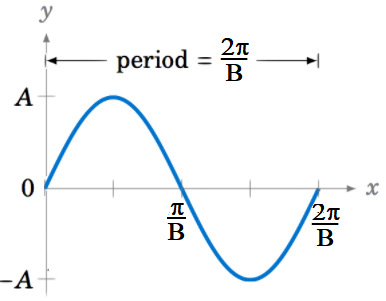
Now that we understand how equation parameters \(A\), \(B\), and \(D\) relate to the graph of sine and cosine functions, we will explore the parameter \(C\). We have seen how adding a constant to a function shifts the entire graph vertically. We will now see how to shift the entire graph of a periodic curve horizontally.
Consider a function of the form \(y=A\,\sin(Bx) \), where \(A \) and \(B\) are nonzero constants. For simplicity we will assume that \(A >0 \) and \(B > 0 \) (in general either one could be negative). Then the amplitude is \(A \) and the period is \(\dfrac{2\pi}{B} \). The graph is shown on the right.
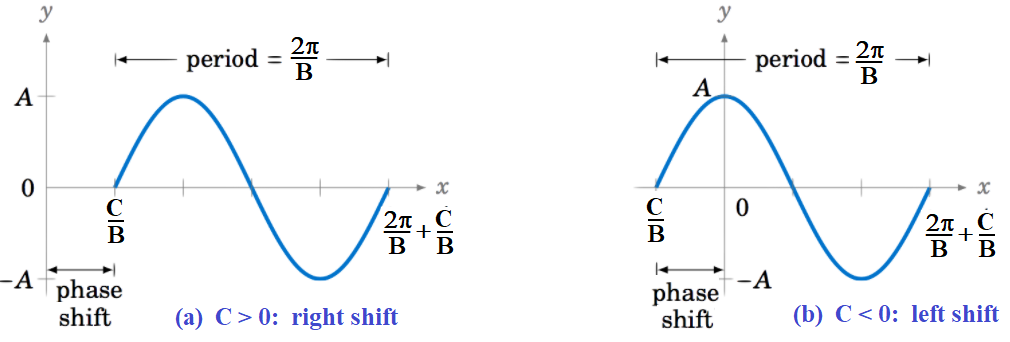
Now consider the function \(y=A\,\sin\;(Bx - C) \), where \(C\) is some constant. The amplitude is still \(A\), and the period is still \(\dfrac{2\pi}{B}\), since \(Bx - C\) is a linear function of \(x\). Also, we know that the sine function goes through an entire cycle when its angle goes from \(0\) to \(2\pi \). Here, we are taking the sine of the angle \(Bx - C\). So as \(Bx - C\) goes from \(0 \) to \(2\pi \), an entire cycle of the function \(y=A\,\sin\;(Bx - C) \) will be traced out.
The cycle starts when \( \quad Bx - C ~=~ 0 \quad \Rightarrow\quad x ~=~ \frac{C}{B}\)
and ends when \( \quad Bx - C ~=~ 2\pi \quad \Rightarrow\quad x ~=~ \frac{2\pi}{B}\;+\;\frac{C}{B}~.\)
Thus, the graph of \(y=A\,\sin\;(Bx - C) \) is just the graph of \(y=A\,\sin (Bx)\) shifted horizontally by \(\dfrac{C}{B} \), as in Figure 5.2.11. The graph is shifted to the right when \(C >0 \), and to the left when \(C <0 \). The amount \(\dfrac{C}{B} \) of the shift is called the phase shift of the graph.
The phase shift is defined similarly for the cosine function.
PHASE SHIFT OF SINUSOIDAL FUNCTIONS (horizontal shift)
The phase shift is the horizontal displacement of a sine or cosine function.
- If the graph starts to the left of the \(y\) axis, the phase shift is negative.
- If the graph starts to the right of the \(y\) axis, the phase shift is positive.
The formula for the phase shift given one of the sinusoidal functions \(y=A\sin(Bx−C)+D\) and \(y=A\cos(Bx−C)+D\) is
Phase Shift: \(H = \dfrac{C}{B}\).
Be careful!! When determining the value for \(C\), notice the negative sign in front of \(C\) in the sinusoidal equations!
The phase shift \(H=\dfrac{C}{B}\) can be directly observed on a graph of a sinusoidal function. It is the horizontal distance between the start of a sinusoidal function and the \(y\)-axis.
Notice that the parameter \(C\) is not necessarily visible when looking at a graph.
- If the graph starts to the left of the \(y\) axis, the phase shift \(H\) is negative, and therefore \(C\) will be negative (but the operation in the argument will be +).
- If the graph starts to the right of the \(y\) axis, the phase shift \(H\) is positive, and therefore \(C\) will be positive (but the operation in the argument will be -).
If we rewrite the above equations by factoring \(B\) out of the argument expression, the argument \(Bx - C\) becomes \(B\left( x - \dfrac{C}{B} \right) \) or \(B \left(x-H \right) \). Then the general equations can be written in the following form, which makes the phase shift \(H\) readily visible in the equation.
\(y=A\sin\left (B \left(x-H \right) \right)+D \qquad \text{ and } \qquad y=A\cos \left( B\left (x-H \right) \right)+D \)
![]() Howto: Identify the midline, amplitude, period, and phase shift from a sinusoidal equation .
Howto: Identify the midline, amplitude, period, and phase shift from a sinusoidal equation .
- Determine the amplitude as \(| A |\).
- Determine the period as \(P=\dfrac{2\pi}{| B |}\).
- Determine the phase shift as \(\dfrac{C}{B}\). Shift is to the left if negative and to the right if positive.
- Determine the midline as \(y=D\).
Example \(\PageIndex{6}\): Identify phase shift in a sinusoidal equation
Determine the direction and magnitude of the phase shift for \(f(x)=\sin\left(x+\dfrac{\pi}{6}\right)−2\).
Solution
Let’s begin by comparing the equation to the general form \(y=A\sin(Bx−C)+D\).
In the given equation, notice that \(B=1\) and \(C=−\dfrac{\pi}{6}\). So the phase shift is \( \dfrac{C}{B} = -\dfrac{\frac{\pi}{6}}{1} = -\dfrac{\pi}{6} \)
or \(\dfrac{\pi}{6}\) units to the left.
Analysis
We must pay attention to the sign in the equation for the general form of a sinusoidal function. The equation shows a minus sign before \(C\). Therefore \(f(x)=\sin(x+\dfrac{\pi}{6})−2\) can be rewritten as \(f(x)=\sin\left(x−\left(−\dfrac{\pi}{6}\right)\right)−2\). If the value of \(C\) is negative, the shift is to the left.
![]() Try It \(\PageIndex{6a}\)
Try It \(\PageIndex{6a}\)
Determine the direction and magnitude of the phase shift for \(f(x)=3\cos\left(x−\dfrac{\pi}{2}\right)\).
- Answer
-
\(\dfrac{\pi}{2}\); right
![]() Try It \(\PageIndex{6b}\)
Try It \(\PageIndex{6b}\)
Determine the midline, amplitude, period, and phase shift of the function \(y=\dfrac{1}{2}\cos \left(\dfrac{x}{3}−\dfrac{\pi}{3}\right)\).
- Answer
- midline: \(y=0\); amplitude: \(| A |=\dfrac{1}{2}\); period: \(P=\dfrac{2\pi}{| B |}=6π\); phase shift: \(\dfrac{C}{B}=\pi\) or \(\pi\) units to the right.
Draw a graph from an equation
Throughout this section, we have learned about types of variations of sine and cosine functions and used that information to write equations from graphs. Now we can use the same information to create graphs from equations.
![]() Howto: Given a sinusoidal function with a phase shift and a vertical shift, sketch its graph
Howto: Given a sinusoidal function with a phase shift and a vertical shift, sketch its graph
- Express the function in the general form \(y=A\sin(Bx−C)+D\) or \(y=A\cos(Bx−C)+D\). Rewrite the equation so \(B\) is positive and determine the basic shape of the graph.
- Identify the amplitude, \(| A |\) and the midline \(y=D\), and maximum and minimum \(y\) values.
- Identify the period, \(P=\dfrac{2\pi}{| B |}\) and the value of \(x\) at the quarter points.
- Identify the phase shift, \(\dfrac{C}{B}\) and adjust the quarter points accordingly.
- Draw the graph of \(f(x)=A\sin(Bx)\) or \(f(x)=A\cos(Bx)\) shifted to the right or left by \(\dfrac{C}{B}\) units and up or down by \(D\) units.
Example \(\PageIndex{7a}\): Graph a Sinusoidal Equation
Sketch a graph of \(f(x)=3\sin\left(\dfrac{\pi}{4}x−\dfrac{\pi}{4}\right)\).
Solution
- Step 1. The function is already written in general form: \(f(x)=3\sin\left(\dfrac{\pi}{4}x−\dfrac{\pi}{4}\right)\).This graph will have the shape of a sine function, starting at the midline and increasing to the right.
- Step 2. \(| A |=| 3 |=3\). The amplitude is \(3\). \(D=0\) so the midline is \(y=0\) and the graph has not been shifted vertically. The maximum and minimun values for \(y\) are \(3\) and \(-3\).
- Step 3. Since \(| B |=| \dfrac{\pi}{4} |=\dfrac{\pi}{4}\), we determine the period as follows.
\( P=\dfrac{2\pi}{|B|}=\dfrac{2\pi}{\dfrac{\pi}{4}}=2\pi \cdot \dfrac{4}{\pi}=8 \)
The period is \(8\). The quarter points are \(x=0,\; 2,\; 4,\; 6, \text{ and } 8\).
- Step 4. Since \(C=\dfrac{\pi}{4}\), the phase shift is \( \quad \dfrac{C}{B}=\dfrac{\dfrac{\pi}{4}}{\dfrac{\pi}{4}}=1\).
The phase shift is \(1\) unit. This means \(1\) is added to each of the quarter points making them \(x=1,\; 3,\; 5,\; 7, \text{ and } 9\).
- Step 5. The graph of the function is below.
Example \(\PageIndex{7b}\)
Given \(y=−2cos\left(\dfrac{\pi}{2}x+\pi\right)+3\), determine the amplitude, period, phase shift, and horizontal shift. Then graph the function.
Solution
Begin by comparing the equation to the general form.
\(y=A\cos(Bx−C)+D\)
- Step 1. The function is already written in general form. It will have the shape of a reflected cosine function, starting at a minimum and going up to the right.
- Step 2. Since \(A=−2\), the amplitude is \(| A |=2\). \(D=3\) so the midline is \(y=3\) . The maximum and minimum values for \(y\) are \(y=3+2=5\) and \(y=3-2=1\).
- Step 3. \(| B |=\dfrac{\pi}{2}\), so the period is \(P=\dfrac{2\pi}{| B |}=\dfrac{2\pi}{\dfrac{pi}{2}}=2\pi⋅\dfrac{2}{\pi}=4\).
The period is 4. The quarter points are \(x=0,\; 1,\; 2,\; 3, \text{ and } 4\). - Step 4. \(C=−\pi\), so we calculate the phase shift as \(\dfrac{C}{B}=−\dfrac{\pi}{\dfrac{\pi}{2}}=−\pi⋅\dfrac{2}{\pi}=−2\).
The phase shift is \(−2\) or two units to the left. This changes the quarter points to \(x=-2,\; -1,\; 0,\; 1, \text{ and } 2\).
One complete cycle starts at \(x=-2\) and since \(A\) is negative, the graph will start a a local minimum (\(y=1\)) and go up (like the shape of the function \(y=-\cos(x)\). Another cycle will start at \(x=2\) and this is the cycle indicated in the graph of the function illustrated in Figure \(\PageIndex{23}\).
![]() Try It \(\PageIndex{7}\)
Try It \(\PageIndex{7}\)
Draw a graph of \(g(x)=−2\cos\left(\dfrac{\pi}{3}x+\dfrac{\pi}{6}\right)\). Determine the midline, amplitude, period, and phase shift.
- Answer
-
midline: \(y=0\); amplitude: \(| A |=2\); period: \(P=\dfrac{2\pi}{| B |}=6\); phase shift: \(\dfrac{C}{B}=−\dfrac{1}{2}\) or \(\dfrac{1}{2}\) unit to the left.
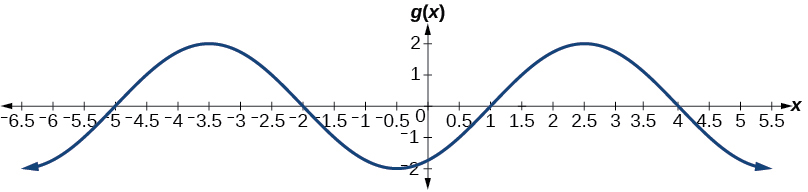
Graph of \(g(x)=−2\cos\left(\dfrac{\pi}{3}x+\dfrac{\pi}{6}\right)\)
Construct an Equation From a Graph
![]() Howto: Construct an equation from the graph of a sinusoidal function.
Howto: Construct an equation from the graph of a sinusoidal function.
From a sinusoidal graph, construct one of the sinusoidal functions: \(y=A\sin(Bx−C)+D\) and \(y=A\cos(Bx−C)+D\)
Determine the values of the parameters used in the
- Identify the amplitude, \(| A |\), half the distance between the highest and lowest values of \(y\) on the graph.
- Identify the midline, the line halfway between the highest and lowest values of \(y\) on the graph. This is parameter \(D\).
- Identify the period \(P\), the horizontal distance between peaks on the graph. Calculate parameter \(B\) from the equation \(B=\dfrac{2\pi}{P}\).
- Look for a highest point, a lowest point, or a point on the midline that is on (ideally - then there is no phase shift) or close to the \(y\) axis and determine the horizontal distance, \(H\), this point is from the \(y\)-axis. This is the phase shift and marks the beginning of one cycle of the function. Calculate parameter \(C\) from the equation \(C=B \cdot H\).
- Identify the function to be used and the parameter \(A\) from the shape of the graph beginning at the starting point for one cycle, determined in the previous step.
\( \begin{array}{|c|c||c|c|}
\hline \text{Starting point} & \text{Graph direction} & \text{Function} & \text{parameter }A \\
\hline \text{a Maximum} & \text{Down} & \cos & |A| \\
\hline \text{on Midline} & \text{Up} & \sin & |A| \\[2pt]
\hline \text{on Midline} & \text{Down} & \sin & -|A| \\[2pt]
\hline \text{a Minimum} & \text{Up} & \cos & -|A| \\[2pt]
\hline \end{array} \)
Use the values of the parameters obtained above to construct a possible sinusoidal equation for the graph.
Example \(\PageIndex{8}\) Identifying the Equation for a Sinusoidal Function from a Graph
Determine the equation for the sinusoidal function below.
![ex6.1.8.png - A graph of 3cos(pi/3x-pi/3)-2. Graph has amplitude of 3, period of 6, range of [-5,1].](https://math.libretexts.org/@api/deki/files/94267/5.5.8_example.png?revision=1)
Solution
Step 1. Half the distance between the highest or lowest values gives an amplitude of \(| A |=3\).
Step 2. With the highest value at \(1\) and the lowest value at \(−5\), the midline will be halfway between at \(−2\). So \(D=−2\).
Step 3. The period of the graph is \(6\), which can be measured from the peak at \(x=1\) to the next peak at \(x=7\), or from the distance between adjacent lowest points. Therefore, \(P=\dfrac{2\pi}{| B |}=6\). Using the positive value for \(B\), we find that
\( B =\dfrac{2\pi}{P} =\dfrac{2\pi}{6} =\dfrac{\pi}{3} \)
So far, our equation is either \(y=3\sin\left(\dfrac{\pi}{3}x−C\right)−2\) or \(y=3\cos\left(\dfrac{\pi}{3}x−C\right)−2\).
Steps 4 and 5. For the shape and horizontal shift, we have more than one option. We could write this as any one of the following:
- a cosine shifted to the right \(\qquad \) Starting at \(x = 1 = H = C/B\)
- a negative cosine shifted to the left \(\qquad \) Starting at \(x = -2\)
- a sine shifted to the left \(\qquad \) Starting at \(x \approx 1/2\)
- a negative sine shifted to the right \(\qquad \) Starting at \(x \approx 2 \; 1/2\)
While any of these would be correct, the cosine shifts are easier to work with than the sine shifts in this case because they involve integer values. So our function becomes either \(y=3\cos\left(\dfrac{\pi}{3}x−C\right)−2\) or \(y=-3\cos\left(\dfrac{\pi}{3}x−C\right)−2\). The horizontal displacement when \(A=3\) to the highest point on the graph is one unit to the right, so the equation used to solve for \(C\) is \(\dfrac{C}{B} = 1 \Rightarrow C=B = \dfrac{\pi}{3}\). Alternatively, we could have chosen to use the equation in which \(A = -3\) (indicating reflection over the \(x\)-axis). In this case, the horizontal displacement to the lowest point on the graph is two units to the left, and the equation used to solve for \(C\) is \(\dfrac{C}{B} = -2 \Rightarrow C=-2B = -\dfrac{2\pi}{3}\).
So, two possibilities for our equation are \(y=3\cos\left(\dfrac{\pi}{3}x−\dfrac{\pi}{3}\right)−2\) and \(y=-3\cos\left(\dfrac{\pi}{3}x+\dfrac{2\pi}{3}\right)−2\). Again, these functions are equivalent, so both yield the same graph.
![]() Try It \(\PageIndex{8}\)
Try It \(\PageIndex{8}\)
Write a formula for the function graphed below.
![A graph of 4sin((pi/5)x-pi/5)+4. Graph has period of 10, amplitude of 4, range of [0,8].](https://math.libretexts.org/@api/deki/files/6906/CNX_Precalc_Figure_06_01_018n.jpg?revision=1&size=bestfit&width=560&height=337)
- Answer
- Two possible equations are: \(y=4\sin\left(\dfrac{\pi}{5}x−\dfrac{\pi}{5}\right)+4\) or \(y=−4\sin\left(\dfrac{\pi}{5}x+\dfrac{4\pi}{5}\right)+4\)
Construct Functions for Applications
We can use the transformations of sine and cosine functions in numerous applications. As mentioned at the beginning of the chapter, circular motion can be modeled using either the sine or cosine function.
Circular Motion
Example \(\PageIndex{9}\): Finding the Vertical Component of Circular Motion
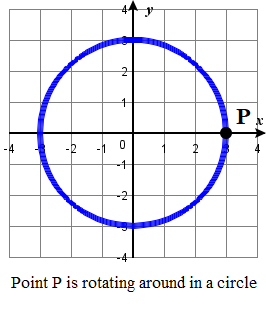
A point rotates around a circle of radius \(3\) centered at the origin. Sketch a graph of the \(y\)-coordinate of the point as a function of the angle of rotation.
Solution
Recall that, for a point on a circle of radius \(r\), the \(y\)-coordinate of the point is \(y=r \sin(x)\), so in this case, we get the equation \(y(x)=3 \sin(x)\). The constant \(3\) causes a vertical stretch of the \(y\)-values of the function by a factor of \(3\), which we can see in the graph in Figure \(\PageIndex{24}\).
![A graph of 3sin(x). Graph has period of 2pi, amplitude of 3, and range of [-3,3].](https://math.libretexts.org/@api/deki/files/6912/CNX_Precalc_Figure_06_01_023.jpg?revision=1)
Analysis
Notice that the period of the function is still \(2\pi\); as we travel around the circle, we return to the point \((3,0)\) for \(x=2\pi,4\pi,6\pi,\)....Because the outputs of the graph will now oscillate between \(–3\) and \(3\), the amplitude of the sine wave is \(3\).
Example \(\PageIndex{10}\): Finding the Vertical Component of Circular Motion
A circle with radius \(3\) ft is mounted with its center \(4\) ft off the ground. The point closest to the ground is labeled \(P\), as shown in Figure \(\PageIndex{26}\). Sketch a graph of the height above the ground of the point \(P\) as the circle is rotated; then find a function that gives the height in terms of the angle of rotation.
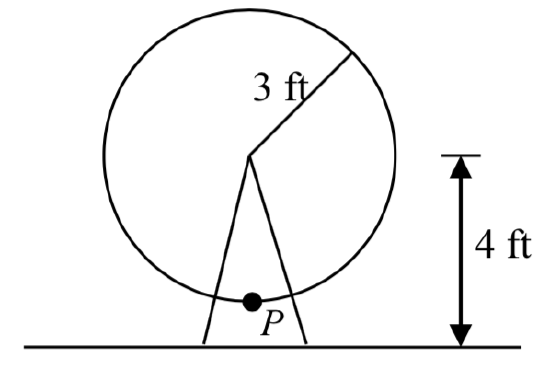
Solution
For a point rotating on a circle of radius \(r\), the height is the \(y\)-coordinate of the point defined by the equation \(y=r \sin(\theta)\) so \(y=3 \sin(\theta)\) . The amplitude is \(|A| = 3\).
Sketching the height, we note that it will start \(1\) ft above the ground, then increase up to \(7\) ft above the ground, and continue to oscillate \(3\) ft above and below the center value of \(4\) ft, as shown in Figure \(\PageIndex{27}\).
Although we could use a transformation of either the sine or cosine function, we start by looking for characteristics that would make one function easier to use than the other. Let’s use a cosine function because it starts at the highest or lowest value, while a sine function starts at the middle value. A standard cosine starts at the highest value, and this graph starts at the lowest value, so we need to incorporate a vertical reflection.
Second, we see that the graph oscillates \(3\) above and below the center, while a basic cosine has an amplitude of \(1\), so this graph has been vertically stretched by \(3\), as in the last example.
Finally, to move the center of the circle up to a height of \(4\), the graph has been vertically shifted up by \(4\). Putting these transformations together, we find that
\(y=−3\cos(x)+4\)
To answer the Ferris wheel problem at the beginning of the section, we need to be able to express our sine and cosine functions at inputs of time. The basic sinusoidal functions are functions of an angle instead of time. One approach would be to use composition. For example, write one sinusoidal equation for vertical height, \(h\), as a function of an angle and another equation for an angle, \(a\) as a function of time. The composition \(h(a(t))\) is a sinusoidal function of time. Here, instead, we observe the equivalency of two graphs that are identical except for the units on the \(x\) axis.
Example \(\PageIndex{11}\)
A point completes 1 revolution every 2 minutes around a circle of radius 5. Find the \(x\) coordinate of the point as a function of time, if it starts at (5, 0).
Solution
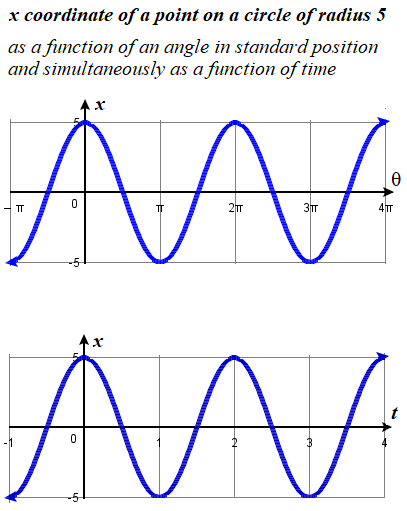
For a point moving on a rotating circle of radius \(r\), the \(x\)-coordinate of the point is \(x=r \cos(\theta)\) so \(x=5 \cos(\theta)\) . The amplitude is \(|A| = 5\).
We are told the starting point is at a maximum point, so this is a cosine function.
Simultaneously, from a different perspective of time rather than rotational angle, the same motion completes one revolution every \(t=2\) minutes. A cosine function with the same amplitude but a period \(P=2\) has equation parameter \(B\) defined by the formula \(P = \dfrac{2\pi}{B}\). So \( B = \pi\) and the equation in terms of time is \(x=5\cos(\pi t)\).
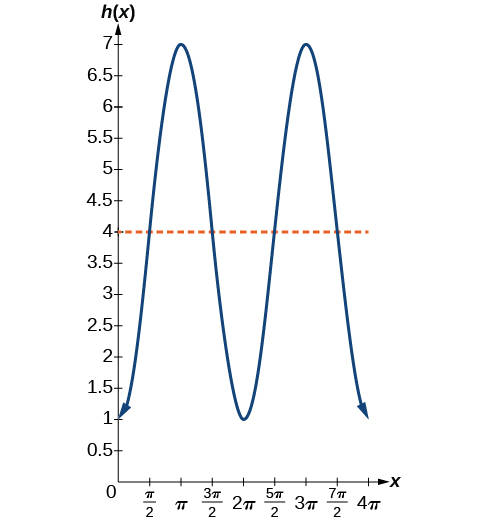
Example \(\PageIndex{12}\): Determining a Rider’s Height on a Ferris Wheel
The London Eye is a huge Ferris wheel with a diameter of \(135\) meters (\(443\) feet). It completes one rotation every \(30\) minutes. Riders board from a platform \(2\) meters above the ground. Express a rider’s height above ground as a function of time in minutes.
Solution
With a diameter of \(135\) m, the wheel has a radius of \(67.5\) m. The height will oscillate with amplitude \(67.5\) m above and below the center.
Passengers board \(2\) m above ground level, so the center of the wheel must be located \(67.5+2=69.5\) m above ground level. The midline of the oscillation will be at \(69.5\) m.
The wheel takes \(30\) minutes to complete \(1\) revolution, so the height will oscillate with a period of \(30\) minutes.
Lastly, because the rider boards at the lowest point, the height will start at the smallest value and increase, following the shape of a vertically reflected cosine curve.
- Amplitude: \(67.5\), so \(A=67.5\)
- Midline: \(69.5\), so \(D=69.5\)
- Period: \(30\), so \(B=\dfrac{2\pi}{30}=\dfrac{\pi}{15}\)
- Shape: \(−\cos(t)\)
An equation for the rider’s height would be
\(y=−67.5\cos\left(\dfrac{\pi}{15}t\right)+69.5\)
where \(t\) is in minutes and \(y\) is measured in meters.
![]() Try It \(\PageIndex{12}\)
Try It \(\PageIndex{12}\)
The Ferris wheel at the Puyallup Fair (Photo by photogirl7.1, www.flickr.com/photos/kitkaph...86205/sizes/z/, CC-BY) ha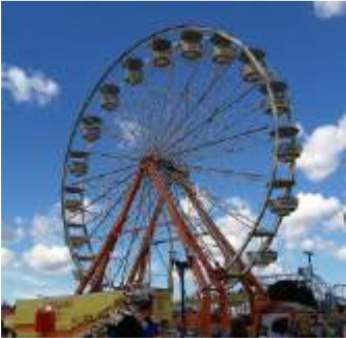 s a diameter of about 70 feet and takes 3 minutes to complete a full rotation. Passengers board from a platform 10 feet above the ground. Write an equation for a rider’s height above ground over time.
- Answer
-
\[h(t)=-35\cos \left(\dfrac{2\pi }{3} t\right)+45\nonumber\]
While it is common to compose sine or cosine with functions involving time, the composition can be done so that the input represents any reasonable quantity.
Example \(\PageIndex{13}\)
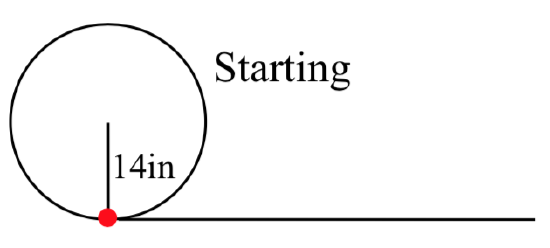 A bicycle wheel with radius 14 inches has the bottom-most point on the wheel marked in red. The wheel then begins rolling down the street. Write a formula for the height above ground of the red point after the bicycle has travelled \(x\) inches.
Solution
For a point moving on a rotating circle of radius \(r\), the height of the point above the ground is the \(y\)-coordinate of the point, \(y=r \sin(\theta)\). Therefore \(y=14 \cos(\theta)\), so the amplitude is \(|A| = 14\). The height oscillates between \(0\) inches and \(28\) inches above ground, so the vertical displacement is \(D=14\).
We are told the starting point is at a minimum point, so this is a reflected cosine function.
Simultaneously, from a different perspective of distance \(d\) travelled rather than rotational angle, the same motion completes one revolution every \(d=28\pi\) inches. A cosine function with the same amplitude and vertical displacement, but a period \(P=28\pi\) has equation parameter \(B\) defined by the formula \(P = \dfrac{2\pi}{B}\). So \( B = \dfrac{\pi}{14}\) and the equation for the height of the point in terms of distance travelled is
\(y=-14\cos\left(\dfrac{\pi}{14}d\right)+14)\).
Periodic Behaviour
We will now apply these ideas to problems involving periodic behavior.
Example \(\PageIndex{14}\): Modeling an Equation and Sketching a Sinusoidal Graph to Fit Criteria
The average monthly temperatures for a small town in Oregon are given in the table below. Find a sinusoidal function of the form \(y=A \sin (Bt−C)+D\) that fits the data (round to the nearest tenth) and sketch the graph.
| Month | Temperature,\(^oF\) | Month | Temperature,\(^oF\) | ||
|---|---|---|---|---|---|
| January | 42.5 | May | 58 | September | 64.5 |
| February | 44.5 | June | 63 | October | 55.5 |
| March | 48.5 | July | 68.5 | November | 46.5 |
| April | 52.5 | August | 69 | December | 43.5 |
Solution
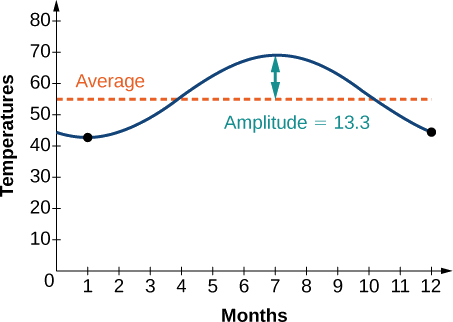
Recall that amplitude is found using the formula \(A=\tfrac{\text{largest value −smallest value}}{2}\). Thus, the amplitude is
\( |A| = \tfrac{69−42.5}{2} =13.25 \)
The data covers a period of 12 months, so \(\frac{2π}{B}=12\) which gives
\(B=\frac{2π}{12}=\frac{π}{6}\).
The vertical shift is found using the equation \(D=\tfrac{\text{highest value+lowest value}}{2}\). Thus, the vertical shift is
\( D = \tfrac{69+42.5}{2} =55.8 \)
So far, we have the equation \(y=13.3 \sin (\frac{π}{6}x−C)+55.8\). To find the horizontal shift, we input the \(x\) and \(y\) values for the first month and solve for \(C\).
\(\begin{array} {rll} 42.5 & =13.3 \sin (\frac{π}{6}(1)−C)+55.8 \\ −13.3 & =13.3 \sin (\frac{π}{6}−C) \\ −1 & =\sin (\frac{π}{6}−C) \qquad \sin θ=−1→ θ=−\frac{π}{2} \\ −\frac{π}{2} &=\frac{π}{6}−C \qquad \qquad \quad C = \frac{π}{6}+\frac{π}{2} → C =\frac{2π}{3} \end{array}\)
We have the equation \(y=13.3 \sin (\frac{π}{6}x−\frac{2π}{3})+55.8\). See the graph in Figure \(\PageIndex{14}\).
![]() Try It \(\PageIndex{15}\)
Try It \(\PageIndex{15}\)
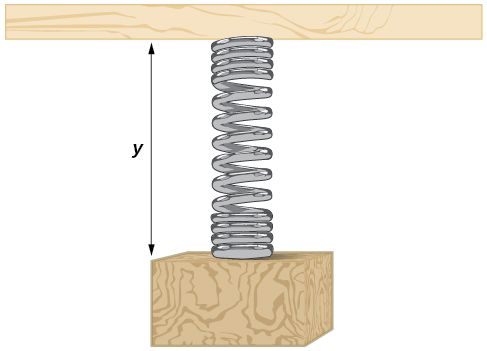
A weight is attached to a spring that is then hung from a board, as shown in Figure \(\PageIndex{28}\). As the spring oscillates up and down, the position \(y\) of the weight relative to the board ranges from \(–1\) in. (at time \(t=0\)) to \(–7\) in. (at time \(t=π\)) below the board. Assume the position of \(y\) is given as a sinusoidal function of time \(t\). Sketch a graph of the function, and then find a function that gives the position \(y\) in terms of \(t\).
- Answer
-
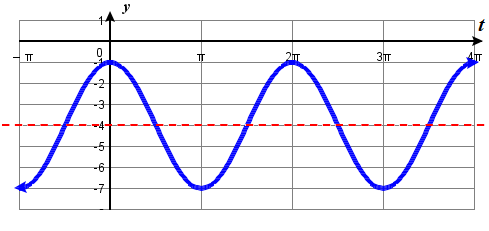 \(y=3\cos(x)−4\)
Key Equations
| Sinusoidal functions |
\(f(x)=A\sin(Bx−C)+D\) \(f(x)=A\cos(Bx−C)+D\) |
Key Concepts
- Periodic functions repeat after a given value. The smallest such value is the period. The basic sine and cosine functions have a period of \(2\pi\).
- The function \(\sin x\) is odd, so its graph is symmetric about the origin. The function \(\cos x\) is even, so its graph is symmetric about the y-axis.
- The graph of a sinusoidal function has the same general shape as a sine or cosine function.
- In the general formula for a sinusoidal function, the period is \(P=\frac{2\pi}{| B |}\).
- In the general formula for a sinusoidal function, \( | A |\) represents amplitude. If \(| A |>1\), the function is stretched, whereas if \(| A |<1\), the function is compressed.
- The value \(\frac{C}{B}\) in the general formula for a sinusoidal function indicates the phase shift.
- The value \(D\) in the general formula for a sinusoidal function indicates the vertical shift from the midline.
- An equation for a sinusoidal function can be determined from a graph.
- A function can be graphed by identifying its amplitude, period, phase shift, and horizontal shift.
- Sinusoidal functions can be used to solve real-world problems.
Contributors and Attributions
Jay Abramson (Arizona State University) with contributing authors. Textbook content produced by OpenStax College is licensed under a Creative Commons Attribution License 4.0 license. Download for free at https://openstax.org/details/books/precalculus.