4.4: Derivatives and the Shape of a Graph
( \newcommand{\kernel}{\mathrm{null}\,}\)
- Given function

- Given function
- Given function

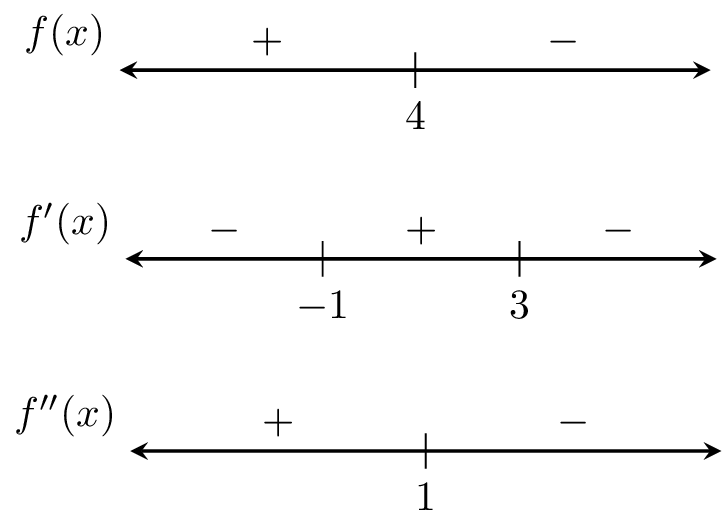
- Sketch the graph of a smooth function

-
Sketch the graph of a smooth function
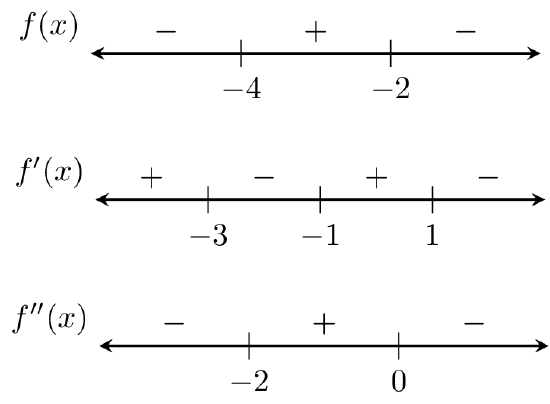
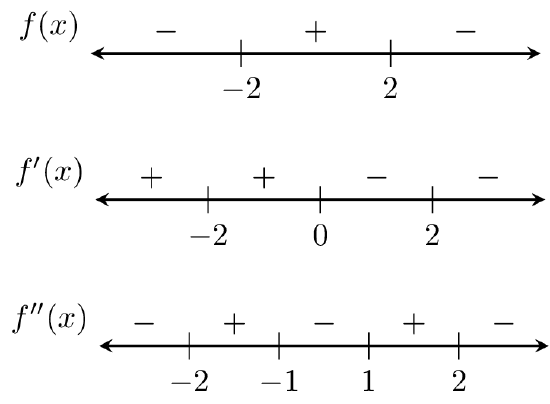
- Sketch the graph of a smooth function
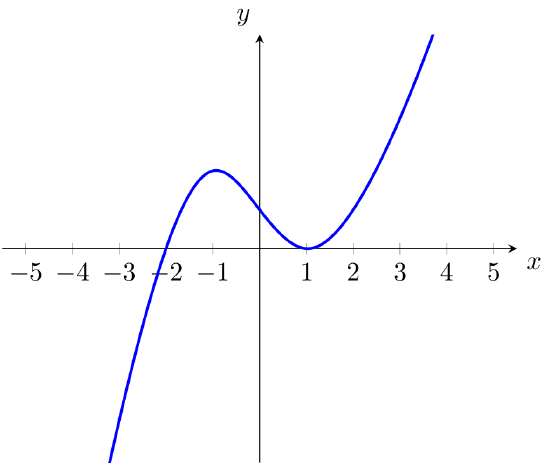
- Consider the function
- Consider the function
- Consider the function
- Consider the function
- Consider the function
- Consider the function
- Consider the function
- Consider the function