
2.7: Chapter 2 Exercises with Solutions
- Page ID
- 23290
\( \newcommand{\vecs}[1]{\overset { \scriptstyle \rightharpoonup} {\mathbf{#1}} } \)
\( \newcommand{\vecd}[1]{\overset{-\!-\!\rightharpoonup}{\vphantom{a}\smash {#1}}} \)
\( \newcommand{\dsum}{\displaystyle\sum\limits} \)
\( \newcommand{\dint}{\displaystyle\int\limits} \)
\( \newcommand{\dlim}{\displaystyle\lim\limits} \)
\( \newcommand{\id}{\mathrm{id}}\) \( \newcommand{\Span}{\mathrm{span}}\)
( \newcommand{\kernel}{\mathrm{null}\,}\) \( \newcommand{\range}{\mathrm{range}\,}\)
\( \newcommand{\RealPart}{\mathrm{Re}}\) \( \newcommand{\ImaginaryPart}{\mathrm{Im}}\)
\( \newcommand{\Argument}{\mathrm{Arg}}\) \( \newcommand{\norm}[1]{\| #1 \|}\)
\( \newcommand{\inner}[2]{\langle #1, #2 \rangle}\)
\( \newcommand{\Span}{\mathrm{span}}\)
\( \newcommand{\id}{\mathrm{id}}\)
\( \newcommand{\Span}{\mathrm{span}}\)
\( \newcommand{\kernel}{\mathrm{null}\,}\)
\( \newcommand{\range}{\mathrm{range}\,}\)
\( \newcommand{\RealPart}{\mathrm{Re}}\)
\( \newcommand{\ImaginaryPart}{\mathrm{Im}}\)
\( \newcommand{\Argument}{\mathrm{Arg}}\)
\( \newcommand{\norm}[1]{\| #1 \|}\)
\( \newcommand{\inner}[2]{\langle #1, #2 \rangle}\)
\( \newcommand{\Span}{\mathrm{span}}\) \( \newcommand{\AA}{\unicode[.8,0]{x212B}}\)
\( \newcommand{\vectorA}[1]{\vec{#1}} % arrow\)
\( \newcommand{\vectorAt}[1]{\vec{\text{#1}}} % arrow\)
\( \newcommand{\vectorB}[1]{\overset { \scriptstyle \rightharpoonup} {\mathbf{#1}} } \)
\( \newcommand{\vectorC}[1]{\textbf{#1}} \)
\( \newcommand{\vectorD}[1]{\overrightarrow{#1}} \)
\( \newcommand{\vectorDt}[1]{\overrightarrow{\text{#1}}} \)
\( \newcommand{\vectE}[1]{\overset{-\!-\!\rightharpoonup}{\vphantom{a}\smash{\mathbf {#1}}}} \)
\( \newcommand{\vecs}[1]{\overset { \scriptstyle \rightharpoonup} {\mathbf{#1}} } \)
\(\newcommand{\longvect}{\overrightarrow}\)
\( \newcommand{\vecd}[1]{\overset{-\!-\!\rightharpoonup}{\vphantom{a}\smash {#1}}} \)
\(\newcommand{\avec}{\mathbf a}\) \(\newcommand{\bvec}{\mathbf b}\) \(\newcommand{\cvec}{\mathbf c}\) \(\newcommand{\dvec}{\mathbf d}\) \(\newcommand{\dtil}{\widetilde{\mathbf d}}\) \(\newcommand{\evec}{\mathbf e}\) \(\newcommand{\fvec}{\mathbf f}\) \(\newcommand{\nvec}{\mathbf n}\) \(\newcommand{\pvec}{\mathbf p}\) \(\newcommand{\qvec}{\mathbf q}\) \(\newcommand{\svec}{\mathbf s}\) \(\newcommand{\tvec}{\mathbf t}\) \(\newcommand{\uvec}{\mathbf u}\) \(\newcommand{\vvec}{\mathbf v}\) \(\newcommand{\wvec}{\mathbf w}\) \(\newcommand{\xvec}{\mathbf x}\) \(\newcommand{\yvec}{\mathbf y}\) \(\newcommand{\zvec}{\mathbf z}\) \(\newcommand{\rvec}{\mathbf r}\) \(\newcommand{\mvec}{\mathbf m}\) \(\newcommand{\zerovec}{\mathbf 0}\) \(\newcommand{\onevec}{\mathbf 1}\) \(\newcommand{\real}{\mathbb R}\) \(\newcommand{\twovec}[2]{\left[\begin{array}{r}#1 \\ #2 \end{array}\right]}\) \(\newcommand{\ctwovec}[2]{\left[\begin{array}{c}#1 \\ #2 \end{array}\right]}\) \(\newcommand{\threevec}[3]{\left[\begin{array}{r}#1 \\ #2 \\ #3 \end{array}\right]}\) \(\newcommand{\cthreevec}[3]{\left[\begin{array}{c}#1 \\ #2 \\ #3 \end{array}\right]}\) \(\newcommand{\fourvec}[4]{\left[\begin{array}{r}#1 \\ #2 \\ #3 \\ #4 \end{array}\right]}\) \(\newcommand{\cfourvec}[4]{\left[\begin{array}{c}#1 \\ #2 \\ #3 \\ #4 \end{array}\right]}\) \(\newcommand{\fivevec}[5]{\left[\begin{array}{r}#1 \\ #2 \\ #3 \\ #4 \\ #5 \\ \end{array}\right]}\) \(\newcommand{\cfivevec}[5]{\left[\begin{array}{c}#1 \\ #2 \\ #3 \\ #4 \\ #5 \\ \end{array}\right]}\) \(\newcommand{\mattwo}[4]{\left[\begin{array}{rr}#1 \amp #2 \\ #3 \amp #4 \\ \end{array}\right]}\) \(\newcommand{\laspan}[1]{\text{Span}\{#1\}}\) \(\newcommand{\bcal}{\cal B}\) \(\newcommand{\ccal}{\cal C}\) \(\newcommand{\scal}{\cal S}\) \(\newcommand{\wcal}{\cal W}\) \(\newcommand{\ecal}{\cal E}\) \(\newcommand{\coords}[2]{\left\{#1\right\}_{#2}}\) \(\newcommand{\gray}[1]{\color{gray}{#1}}\) \(\newcommand{\lgray}[1]{\color{lightgray}{#1}}\) \(\newcommand{\rank}{\operatorname{rank}}\) \(\newcommand{\row}{\text{Row}}\) \(\newcommand{\col}{\text{Col}}\) \(\renewcommand{\row}{\text{Row}}\) \(\newcommand{\nul}{\text{Nul}}\) \(\newcommand{\var}{\text{Var}}\) \(\newcommand{\corr}{\text{corr}}\) \(\newcommand{\len}[1]{\left|#1\right|}\) \(\newcommand{\bbar}{\overline{\bvec}}\) \(\newcommand{\bhat}{\widehat{\bvec}}\) \(\newcommand{\bperp}{\bvec^\perp}\) \(\newcommand{\xhat}{\widehat{\xvec}}\) \(\newcommand{\vhat}{\widehat{\vvec}}\) \(\newcommand{\uhat}{\widehat{\uvec}}\) \(\newcommand{\what}{\widehat{\wvec}}\) \(\newcommand{\Sighat}{\widehat{\Sigma}}\) \(\newcommand{\lt}{<}\) \(\newcommand{\gt}{>}\) \(\newcommand{\amp}{&}\) \(\definecolor{fillinmathshade}{gray}{0.9}\)2.1 Exercises
In Exercises \(\PageIndex{1}\)-\(\PageIndex{6}\), state the domain and range of the given relation.
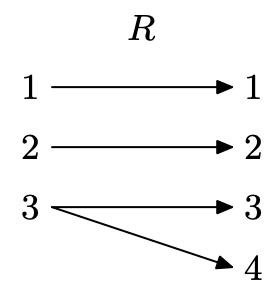
R = {(1, 3),(2, 4),(3, 4)}
- Answer
-
The domain is the set of all first coordinates = {1, 2, 3}. The range is the set of all second coordinates {3, 4} (note that in a set you do not list an object twice, so we only list 4 once).
R = {(1, 3),(2, 4),(2, 5)}
R = {(1, 4),(2, 5),(2, 6)}
- Answer
-
The domain is the set of all first coordinates = {1, 2} (note that in a set you do not list an object twice, so we only list 2 once). The range is the set of all second coordinates {4, 5, 6}.
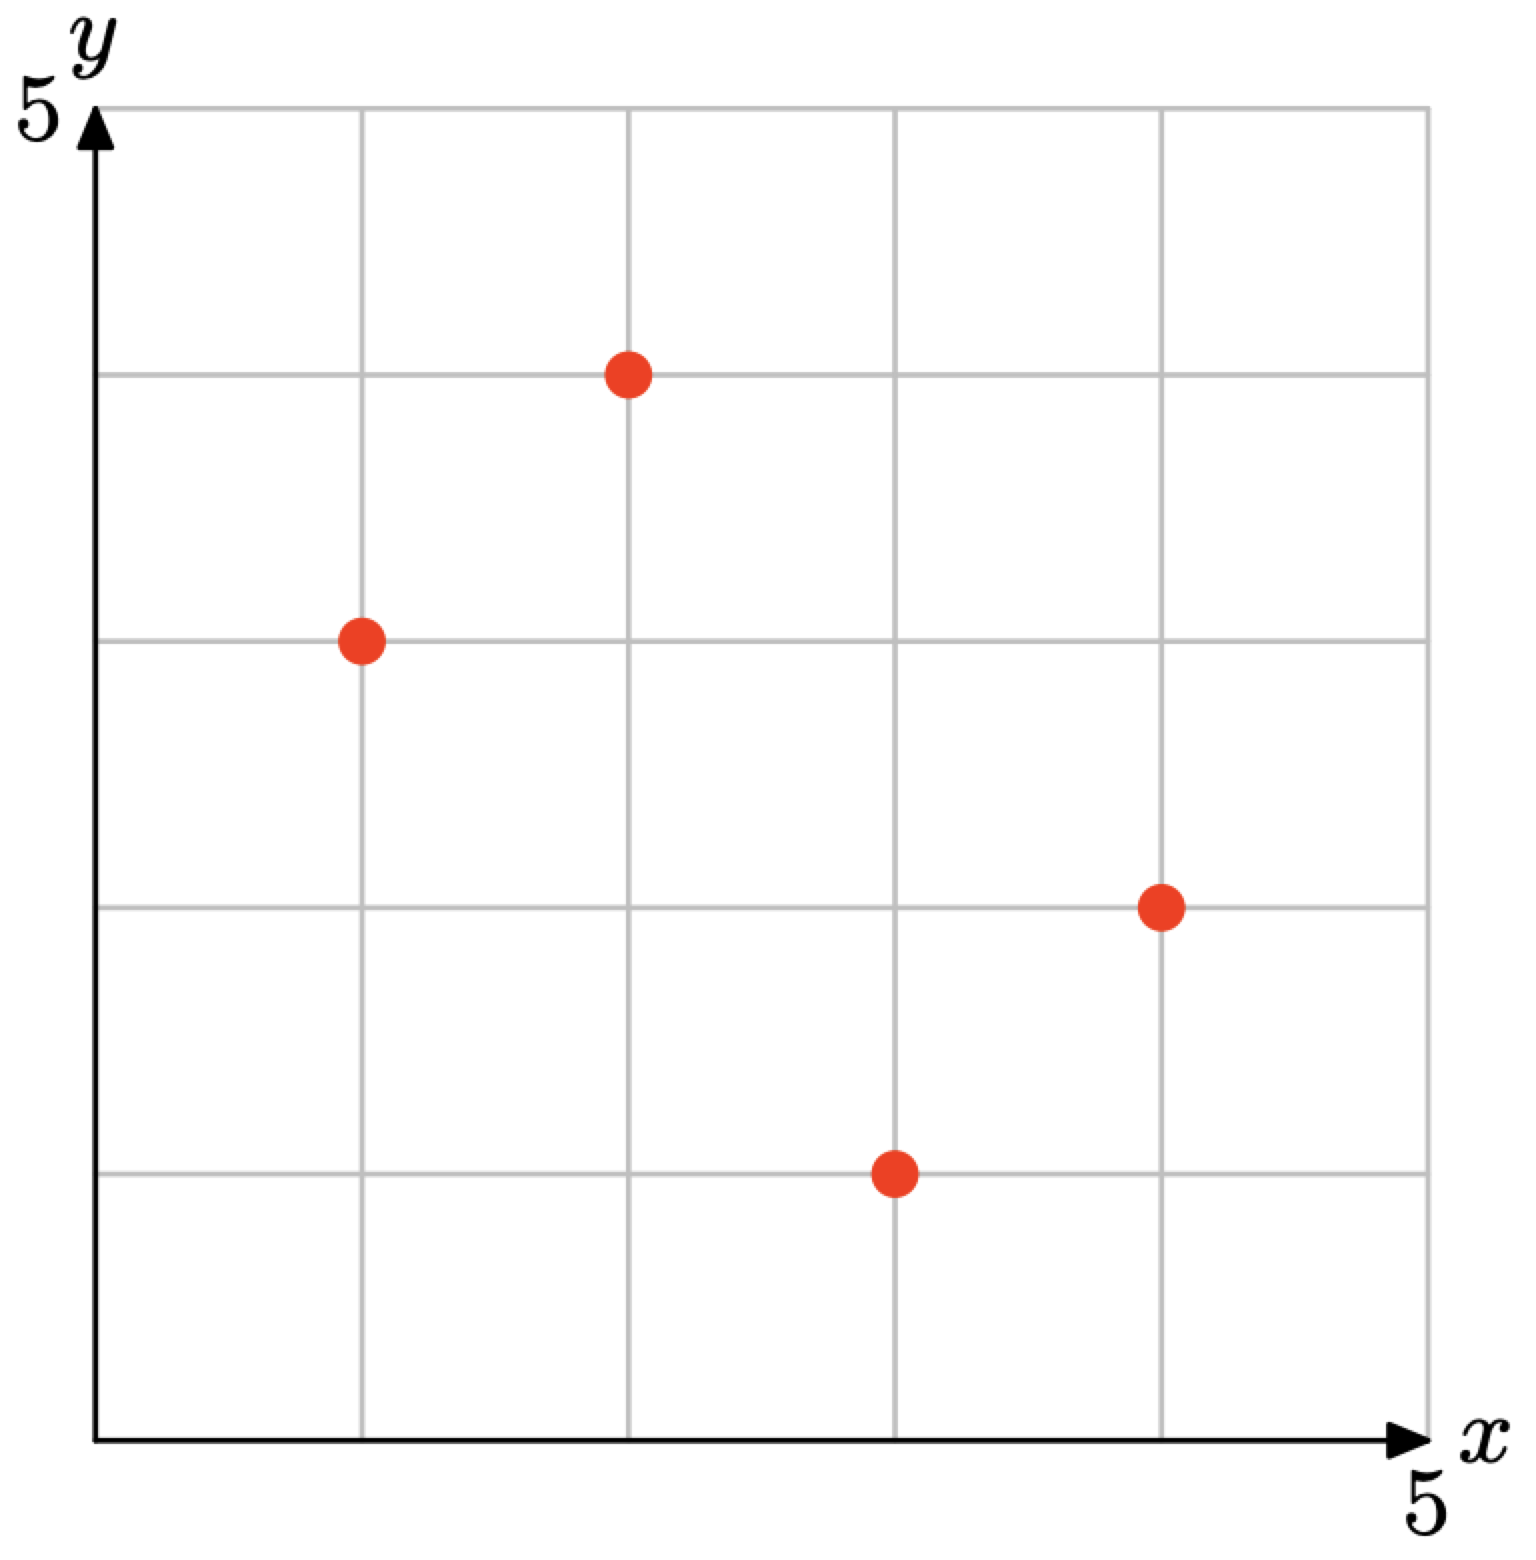
R = {(1, 5),(2, 4),(3, 6)}
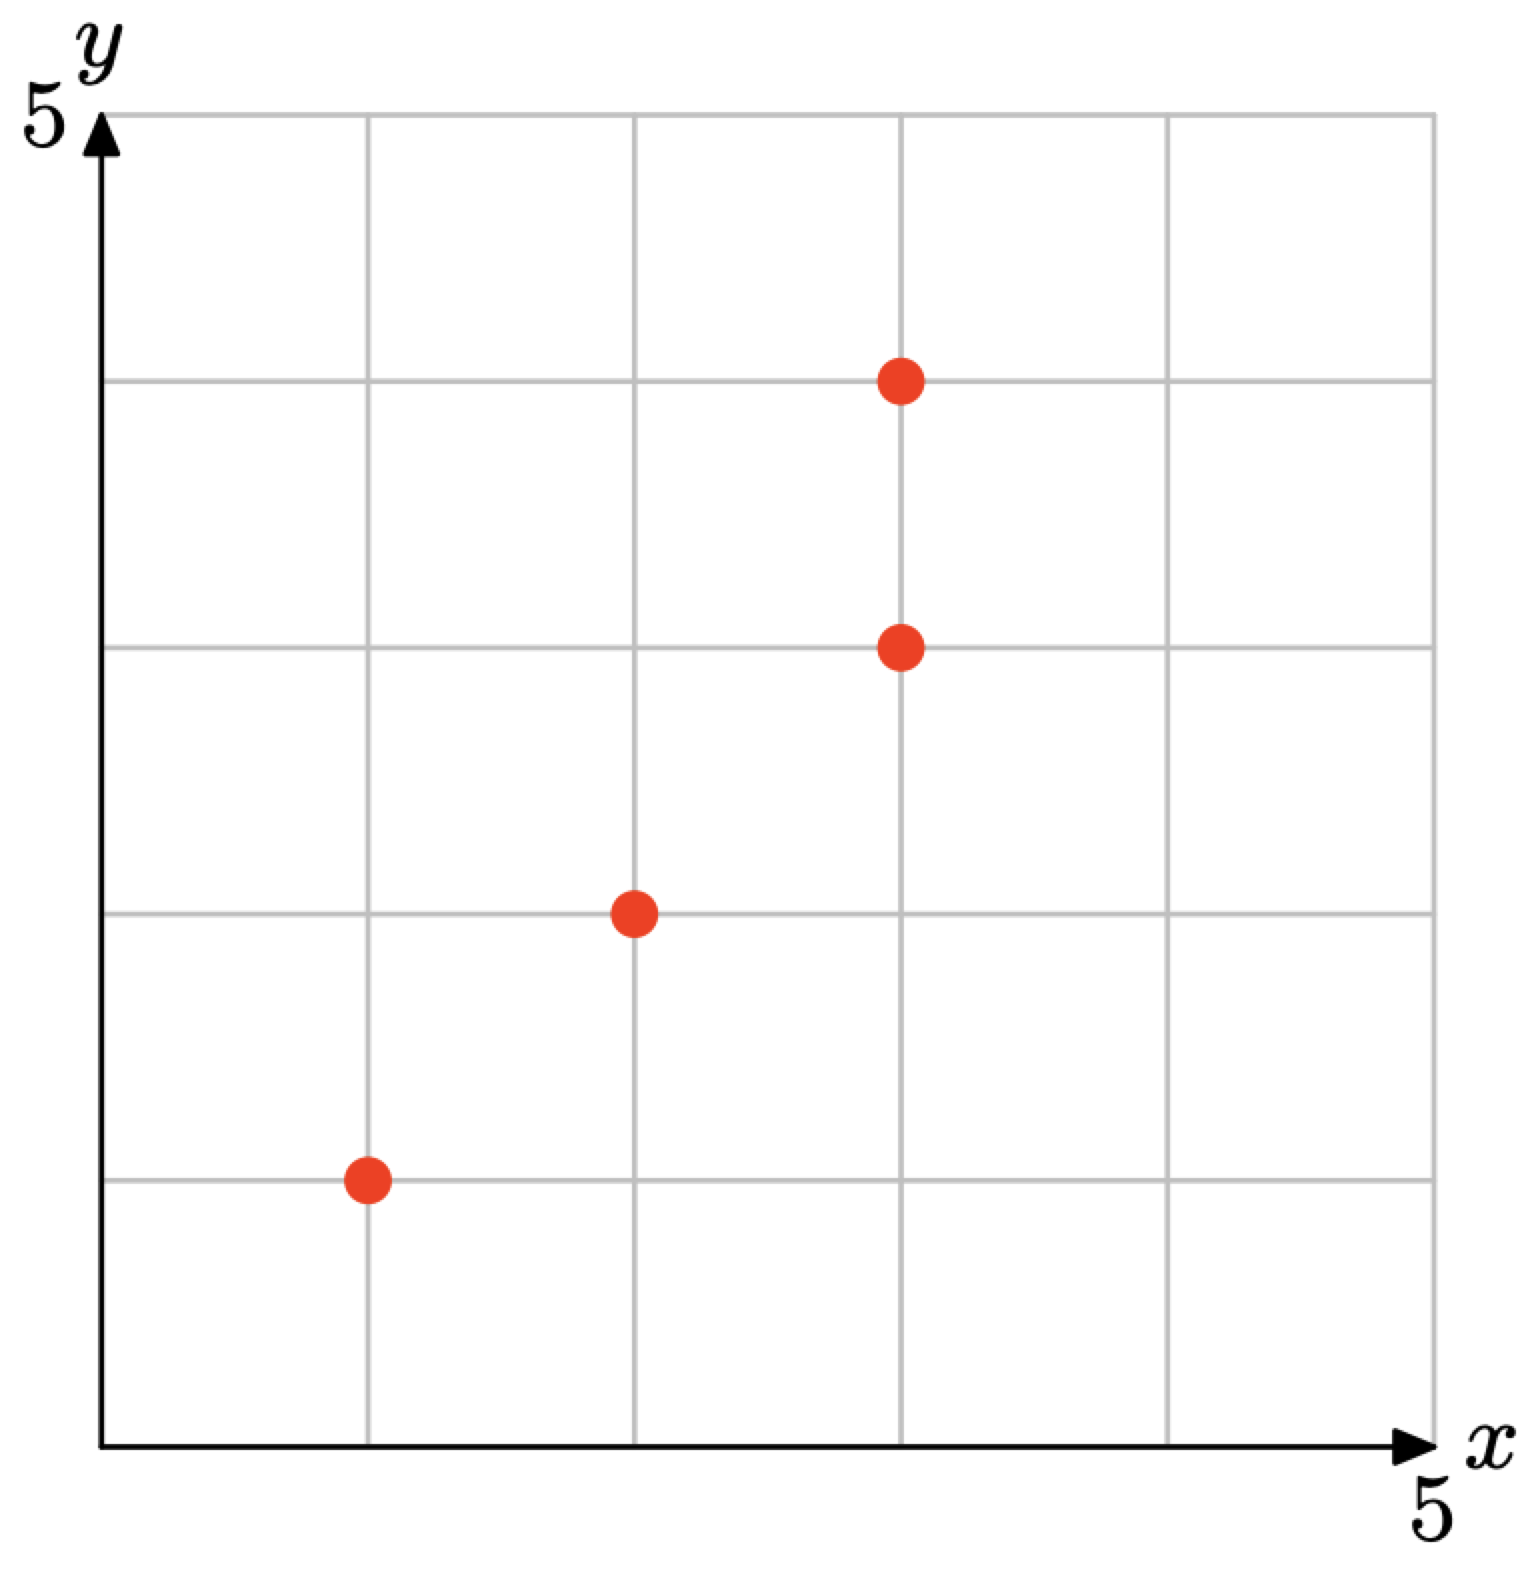
- Answer
-
Read off the x-coordinate of each point to get that the domain is {1, 2, 3}. Then read off the y-coordinates to get that the range is {1, 2, 3, 4}
In Exercises \(\PageIndex{7}\)-\(\PageIndex{12}\), create a mapping diagram for the given relation and state whether or not it is a function.
The relation in Exercise \(\PageIndex{1}\).
- Answer
-
Create a mapping diagram for R.
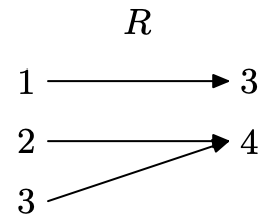
Since no domain value is paired with two range values, this is a function (each x maps to a single y). Note that having two different domain values go to a single range value (2 and 3 both map to 4) is permissible for a function.
The relation in Exercise \(\PageIndex{2}\).
The relation in Exercise \(\PageIndex{3}\).
- Answer
-
Create a mapping diagram for R.
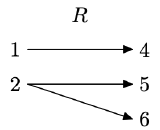
The number 2 is mapped to two different range values (one x maps to two y’s), so this is not a function.
The relation in Exercise \(\PageIndex{4}\).
The relation in Exercise \(\PageIndex{5}\).
- Answer
-
Create a mapping diagram for R.
The number 3 is mapped to two different range values (one x maps to two y’s), so this is not a function.
The relation in Exercise \(\PageIndex{6}\).
Given that g takes a real number and doubles it, then \(g : x \rightarrow ?\).
- Answer
-
Doubles means ’multiplies by 2,’ so \(g : x \rightarrow 2x\).
Given that f takes a real number and divides it by 3, then \(f : x \rightarrow ?\).
Given that g takes a real number and adds 3 to it, then \(g : x \rightarrow ?\).
- Answer
-
\(g : x \rightarrow x + 3\)
Given that h takes a real number and subtracts 4 from it, then \(h : x \rightarrow ?\).
Given that g takes a real number, doubles it, then adds 5, then \(g : x \rightarrow ?\)
- Answer
-
For an x put into g, g doubles it, giving 2x, and then adds five, resulting in 2x + 5. Therefore, \(g : x \rightarrow 2x + 5\)
Given that h takes a real number, subtracts 3 from it, then divides the result by 4, then \(h : x \rightarrow ?\)
Given that the function f is defined by the rule \(h : x \rightarrow 3x − 5\), determine where the input number is mapped in Exercises \(\PageIndex{19}\)-\(\PageIndex{22}\).
\(f : 3 \rightarrow ?\)
- Answer
-
Put 3 into f. This means, replace x with 3 and compute the output. \(f : 3 \rightarrow 3(3) − 5 = 4\), so \(f : 3 \rightarrow 4\).
\(f : -5 \rightarrow ?\)
\(f : a \rightarrow ?\)
- Answer
-
Put a into f, just like you would a number. This means, replace x with a and compute the output. \(f : a \rightarrow 3(a) − 5 = 3a − 5\), so \(f : 3 \rightarrow 3a − 5\).
\(f : 2a+3 \rightarrow ?\)
Given that the function f is defined by the rule \(f : x \rightarrow 4-5x\), determine where the input number is mapped in Exercises \(\PageIndex{23}\)-\(\PageIndex{26}\).
\(f : 2 \rightarrow ?\)
- Answer
-
Put 2 into f by replacing x with it. \(f : 2 \rightarrow 4 − 5(2) = −6\), so \(f : 2 \rightarrow −6\).
\(f : -3 \rightarrow ?\)
\(f : a \rightarrow ?\)
- Answer
-
Put a into f by replacing x with it, just as you would with a number. \(f : a \rightarrow 4 − 5(a)\), so \(f : 2 \rightarrow 4 − 5a\).
\(f : 2a+11 \rightarrow ?\)
Given that the function f is defined by the rule \(f : x \rightarrow x^{2}-4x-6\), determine where the input number is mapped in Exercises \(\PageIndex{27}\)-\(\PageIndex{30}\).
\(f : 1 \rightarrow ?\)
- Answer
-
Put 1 into f by replacing x with it. \(f : 1 \rightarrow (1)2 − 4(1) − 6 = 1 − 4 − 6 = −9\), so \(f : 1 \rightarrow −9\).
\(f : -2 \rightarrow ?\)
\(f : -1 \rightarrow ?\)
- Answer
-
Put −1 into f by replacing x with it. \(f : −1 \rightarrow (−1)2 −4(−1)−6 = 1+4−6 = −1\), so \(f : 1 \rightarrow −1\).
\(f : a \rightarrow ?\)
Given that the function f is defined by the rule \(f : x \rightarrow 3x-9\), determine where the input number is mapped in Exercises \(\PageIndex{31}\)-\(\PageIndex{34}\).
\(f : a \rightarrow ?\)
- Answer
-
Put a into f by replacing x with it, just as you would with a number. \(f : a \rightarrow 3a − 9\).
\(f : a+1 \rightarrow ?\)
\(f : 2a-5 \rightarrow ?\)
- Answer
-
Put 2a − 5 into f by replacing x with it, just as you would with a number. We get \(f : 2a − 5 \rightarrow 3(2a − 5) − 9 = 6a − 15 − 9 = 6a − 24\), so \(f : 2a − 5 \rightarrow 6a − 24\)
\(f : a+h \rightarrow ?\)
Given that the functions f and g are defined by the rules \(f : x \rightarrow 2x+3\) and \(g : x \rightarrow 4-x\), determine where the input number is mapped in Exercises \(\PageIndex{35}\)- \(\PageIndex{38}\).
\(f : 2 \rightarrow ?\)
- Answer
-
Put 2 into f by replacing x with it. We get \(f : 2 \rightarrow 2(2)+3 = 7\), so \(f : 2 \rightarrow 7\).
\(f : 2 \rightarrow ?\)
\(f : a+1 \rightarrow ?\)
- Answer
-
Put a + 1 into f by replacing x with it, just as you would with a number. We get \(f : a + 1 \rightarrow 2(a + 1) + 3 = 2a + 2 + 3 = 2a + 5\), so \(f : a + 1 \rightarrow 2a + 5\)
\(f : a-3 \rightarrow ?\)
Given that g takes a real number and triples it, then g(x) = ?.
- Answer
-
Triples means ’multiplies by 3,’ so g(x) = 3x
Given that f takes a real number and divides it by 5, then f(x) = ?.
Given that g takes a real number and subtracts it from 10, then g(x) = ?.
- Answer
-
g takes an input x and subtracts it FROM 10, so g(x) = 10 − x.
Given that f takes a real number, multiplies it by 5 and then adds 4 to the result, then f(x) = ?.
Given that f takes a real number, doubles it, then subtracts the result from 11, then f(x) = ?.
- Answer
-
f takes an input x, doubles it to get 2x, and takes this away FROM 11, getting 11 − 2x. Therefore, f(x) = 11 − 2x.
Given that h takes a real number, doubles it, adds 5, then takes the square root of the result, then h(x) = ?.
In Exercises \(\PageIndex{45}\)-\(\PageIndex{54}\), evaluate the given function at the given value b.
f(x) = 12x + 2 for b = 6.
- Answer
-
Substitute 6 for x in 12x + 2 and simplify to get 74: f(6) = 12(6) + 2 = 74.
f(x) = −11x − 4 for b = −3.
f(x) = −9x − 1 for b = −5.
- Answer
-
Substitute −5 for x in −9x−1 and simplify to get 44: f(−5) = −9(−5)−1 = 44.
f(x) = 11x + 4 for b = −4.
f(x) = 4 for b = −12.
- Answer
-
f is a constant function, so f(x) = 4 for all x. Therefore, f(−12) = 4.
f(x) = 7 for b = −7.
f(x) = 0 for b = −7.
- Answer
-
f is a constant function, so f(x) = 0 for all x. Therefore, f(−7) = 0.
f(x) = 12x + 8 for b = −3.
f(x) = −9x + 3 for b = −1.
- Answer
-
Substitute −1 for x in −9x+3 and simplify to get 12: f(−1) = −9(−1)+3 = 12
f(x) = 6x − 3 for b = 3.
In Exercises \(\PageIndex{55}\)-\(\PageIndex{58}\), given that the function f is defined by the rule f(x) = 2x+ 7, determine where the input number is mapped.
f(a) = ?
- Answer
-
Put a into f by replacing x with it, just as you would with a number. This yields f(a) = 2a + 7.
f(a + 1) = ?
f(3a − 2) = ?
- Answer
-
Put 3a − 2 into f by replacing x with it, just as you would with a number. This yields f(3a − 2) = 2(3a − 2) + 7 = 6a − 4 + 7 = 6a + 3.
f(a + h) = ?
In Exercises \(\PageIndex{59}\)-\(\PageIndex{62}\), given that the function g is defined by the rule g(x) = 3 − 2x, determine where the input number is mapped.
g(a) = ?
- Answer
-
Put a into g by replacing x with it, just as you would with a number. This yields g(a) = 3 − 2a.
g(a + 3) = ?
g(2 − 5a) = ?
- Answer
-
Put 2 − 5a into g by replacing x with it, just as you would with a number. This yields g(2 − 5a) = 3 − 2(2 − 5a) = 3 − 4 + 10a = −1 + 10a or 10a − 1.
g(a + h) = ?
Given that the functions f and g are defined by the rules f(x) = 1 − x and g(x) = 2x + 13, determine where the input number is mapped in Exercises \(\PageIndex{63}\)- \(\PageIndex{66}\).
f(a) = ?
- Answer
-
Put a into f by replacing x with it, just as you would with a number. This yields f(a) = 1 − a.
g(a) = ?
f(a + 3) = ?
- Answer
-
Put a + 3 into f by replacing x with it, just as you would with a number. This yields f(a + 3) = 1 − (a + 3) = 1 − a − 3 = −a − 2.
g(4 − a) = ?
Given that the functions f and g are defined by the rules f(x) = 3x + 4 and g(x) = 2x−5, determine where the input number is mapped in Exercises \(\PageIndex{67}\)-\(\PageIndex{70}\).
f(g(2)) = ?
- Answer
-
First compute g(2) = 2(2) − 5 = −1. This means that f(g(2)) is really f(−1). Plugging −1 in for x into the function f, we get f(g(2)) = f(−1) = 3(−1) + 4 = −3 + 4 = 1.
g(f(2)) = ?
f(g(a)) = ?
- Answer
-
First compute g(a) = 2a−5. This means that f(g(a)) is really f(2a−5). Plugging 2a − 5 in for x into the function f, we get f(g(a)) = f(2a − 5) = 3(2a − 5) + 4 = 6a − 15 + 4 = 6a − 11.
g(f(a)) = ?
Given that the functions f and g are defined by the rules f(x) = 2x − 9 and g(x) = 11, determine where the input number is mapped in Exercises \(\PageIndex{71}\)-\(\PageIndex{74}\).
f(g(2)) = ?
- Answer
-
First compute g(2) = 11 (note that, no matter what you put into g, it outputs 11). This means that f(g(2)) is really f(11). Plugging 11 in for x into the function f, we get f(g(2)) = f(11) = 2(11) − 9 = 22 − 9 = 13.
g(f(2)) = ?
f(g(a)) = ?
- Answer
-
First compute g(a) = 11 (note that, no matter what you put into g, it outputs 11). This means that f(g(a)) is really f(11). Plugging 11 in for x into the function f, we get f(g(2)) = f(11) = 2(11) − 9 = 22 − 9 = 13.
g(f(a)) = ?
Use set-builder notation to describe the domain of each of the functions defined in Exercises \(\PageIndex{75}\)-\(\PageIndex{78}\).
\(f(x) = \dfrac{93}{x+98}\)
- Answer
-
An input of x = −98 would cause division by zero, so −98 is not in the domain. All other possible inputs are valid. The domain, in set-builder notation, is \(\{x : x \neq −98\}\).
\(f(x) = \dfrac{54}{x+65}\)
\(f(x) = -\dfrac{87}{x-88}\)
- Answer
-
An input of x = 88 would cause division by zero, so 88 is not in the domain. All other possible inputs are valid. The domain, in set-builder notation, is \(\{x : x \neq 88\}\)..
\(f(x) = -\dfrac{30}{x-52}\)
Use set-builder and interval notation to describe the domain of the functions defined in Exercises \(\PageIndex{79}\)-\(\PageIndex{82}\).
\(f(x) = \sqrt{x+69}\)
- Answer
-
The square root of a negative number is not defined as a real number. Thus, x + 69 must be greater than or equal to zero. Then \(x + 69 geq 0\) implies that \(x \geq −69\), so the domain is the interval \([−69,\infty)\), or in set-builder notation, \(\{x : x \geq −69\}\).
\(f(x) = \sqrt{x+62}\)
\(f(x) = \sqrt{x-81}\)
- Answer
-
The square root of a negative number is not defined as a real number. Thus, x − 81 must be greater than or equal to zero. Then \(x − 81 \geq 0\) implies that \(x \geq 81\), so the domain is the interval \([81,\infty)\), or in set-builder notation, \(\{x : x \geq 81\}\).
\(f(x) = \sqrt{x-98}\)
Two integers are said to be relatively prime if their greatest common divisor is 1. For example, the greatest common divisor of 6 and 35 is 1, so 6 and 35 are relatively prime. On the other hand, the greatest common divisor of 14 and 21 is not 1 (it is 7), so 14 and 21 are not relatively prime. The Euler \(\phi\)-function is defined as follows:
• If n = 1, then \(\phi (n) = 1\).
• If n > 1, then \(\phi (n)\) is the number of positive integers less than n that are relatively prime to n. In Exercises \(\PageIndex{83}\)- \(\PageIndex{84}\), evaluate the Euler \(\phi\)-function at the given input.
\(\phi (12)\)
- Answer
-
1, 5, 7, and 11 are less than 12 and are each relatively prime to 12. Therefore, \(\phi(12) = 4\).
\(\phi (36)\)
2.2 Exercises
Perform each of the following tasks for the functions defined by the equations in Exercises \(\PageIndex{1}\)-\(\PageIndex{8}\).
i. Set up a table of points that satisfy the given equation. Please place this table of points next to your graph on your graph paper.
ii. Set up a coordinate system on a sheet of graph paper. Label and scale each axis, then plot each of the points from your table on your coordinate system.
iii. If you are confident that you “see” the shape of the graph, make a “leap of faith” and plot all pairs that satisfy the given equation by drawing a smooth curve (free-hand) on your coordinate system that contains all previously plotted points (use a ruler only if the graph of the equation is a line). If you are not confident that you “see” the shape of the graph, then add more points to your table, plot them on your coordinate system, and see if this helps. Continue this process until you “see” the shape of the graph and can fill in the rest of the points that satisfy the equation by drawing a smooth curve (or line) on your coordinate system.
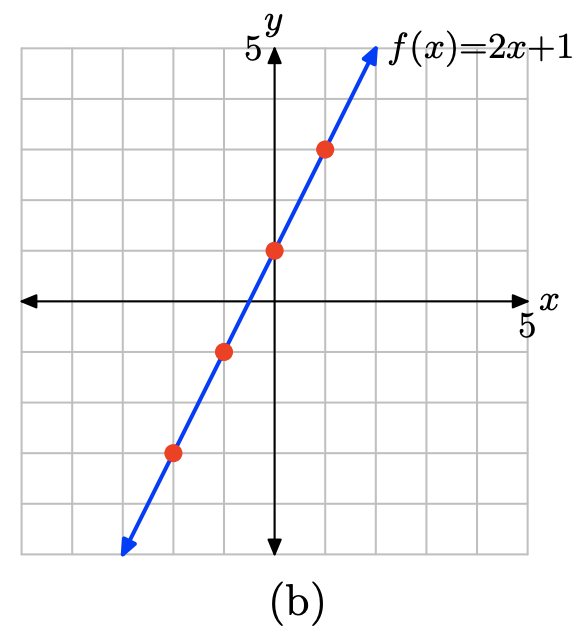
\(f(x) = 2x + 1\)
- Answer
-
Evaluate the function \(f(x) = 2x + 1\) at −2, −1, 0, and 1.
\[\begin{array} {ccc} f(−2) &=& 2(−2) + 1 &=& −3 \\ f(−1) & = &2(−1) + 1 &=& −1 \\ f(0) &=& 2(0) + 1 &=& 1 \\ f(1) &=& 2(1) + 1 &=& 3 \end{array} \nonumber \]
Place these results in table (a) and plot them as shown in (b). There is enough evidence here to intuit that the graph of f is the line shown in (b).
x \(f(x) = 2x + 1\) (x, f(x)) -2 -3 (−2, −3) -1 -1 (−1, −1) 0 1 (0,1) 1 3 (1,3) - (a)
\(f(x) = 1 − x\)
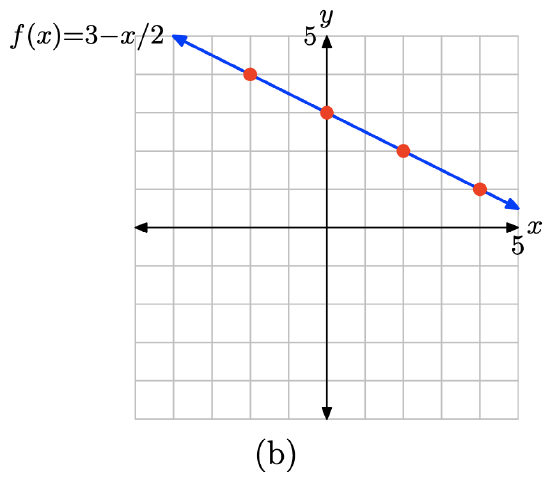
\(f(x) = 3 − \dfrac{1}{2} x\)
- Answer
-
Evaluate the function f(x) = 3 − (1/2)x at x = −2, 0, 2, and 4.
\[f(−2) = 3 − (1/2)(−2) = 4 \\ f(0) = 3 − (1/2)(0) = 3 \\ f(2) = 3 − (1/2)(2) = 2 \\ f(4) = 3 − (1/2)(4) = 1 \nonumber \]
Place these results in table (a) and plot them as shown in (b). There is enough evidence here to intuit that the graph of f is the line shown in (b).
x \(f(x) = 3 - x/2\) (x, f(x)) -2 4 (−2, 4) 0 3 (0,3) 2 2 (2,2) 4 1 (4,1)
(a)
\(f(x) = −1 + \dfrac{1}{2}x\)
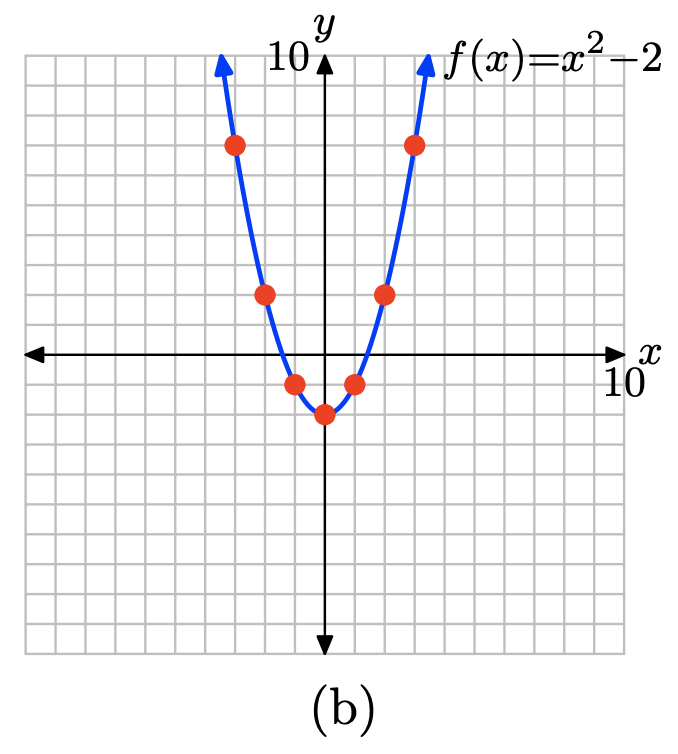
\(f(x) = x^2 − 2\)
- Answer
-
Evaluate \(f(x) = x^2 − 2\) at x = −3, −2, −1, 0, 1, 2, and 3.
\[f(−3) = (−3)^2 − 2 = 7 \\ f(−2) = (−2)^2 − 2 = 2 \\ f(−1) = (−1)^2 − 2 = −1 \\ f(0) = (0)^2 − 2 = −2 \\ f(1) = (1)^2 − 2 = −1 \\ f(2) = (2)^2 − 2 = 2 \\ f(3) = (3)^2 − 2 = 7 \nonumber \]
Place these results in table (a) and plot them as shown in (b). There is enough evidence here to intuit that the graph of f is the curve shown in (b).
x \(f(x) = x^2 − 2\) (x, f(x)) -3 7 (−3, 7) -2 2 (-2,2) -1 -1 (-1,-1) 0 -2 (0,-2) 1 -1 (1,-1) 2 2 (2,2) 3 7 (3,7) (a)
\(f(x) = 4 − x^{2}\)
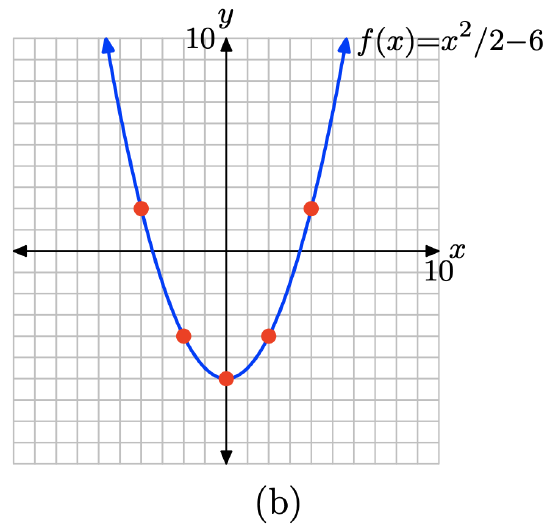
\(f(x) = \dfrac{1}{2} x^{2} − 6\)
- Answer
-
Evaluate \(f(x) = x^2/2 − 6\) at x = −4, −2, 0, 2, and 4.
\[f(−4) = (−4)^2/2 − 6 = 2 \\ f(−2) = (−2)^2/2 − 6 = −4 \\ f(0) = (0)^2/2 − 6 = −6 \\ f(2) = (2)^2/2 − 6 = −4 \\ f(4) = (4)^2/2 − 6 = 2 \nonumber \]
Place these results in table (a) and plot them as shown in (b). There is enough evidence here to intuit that the graph of f is the curve shown in (b).
x \(f(x) = x^2 − 2\) (x, f(x)) -4 2 (−4, 2) -2 -4 (-2,-4) 0 -6 (0,-6) 2 -4 (2,-4) 4 2 (4,2)
(a)
\(f(x) = 8-\dfrac{1}{2} x^2\)
Perform each of the following tasks for the functions Exercises \(\PageIndex{9}\)-\(\PageIndex{10}\).
i. Set up a coordinate system on a sheet of graph paper. Label and scale each axis.
ii. Use the table feature of your graphing calculator to evaluate the function at the given values of x. Record these results in a table next to your coordinate system on your graph paper.
iii. Plot the points in the table on your coordinate system then use them to draw the graph of the given function. Label the graph with its equation.
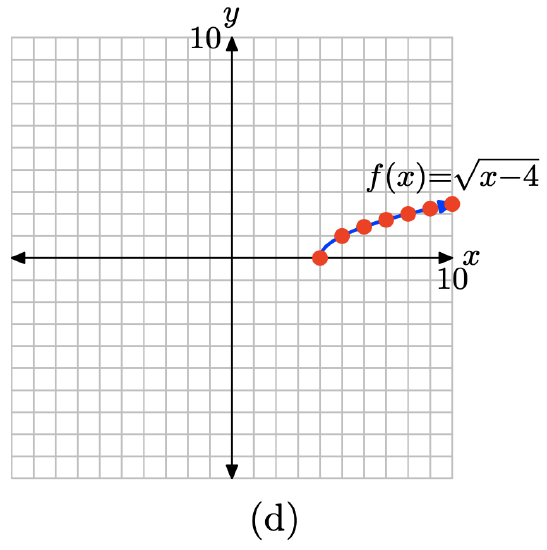
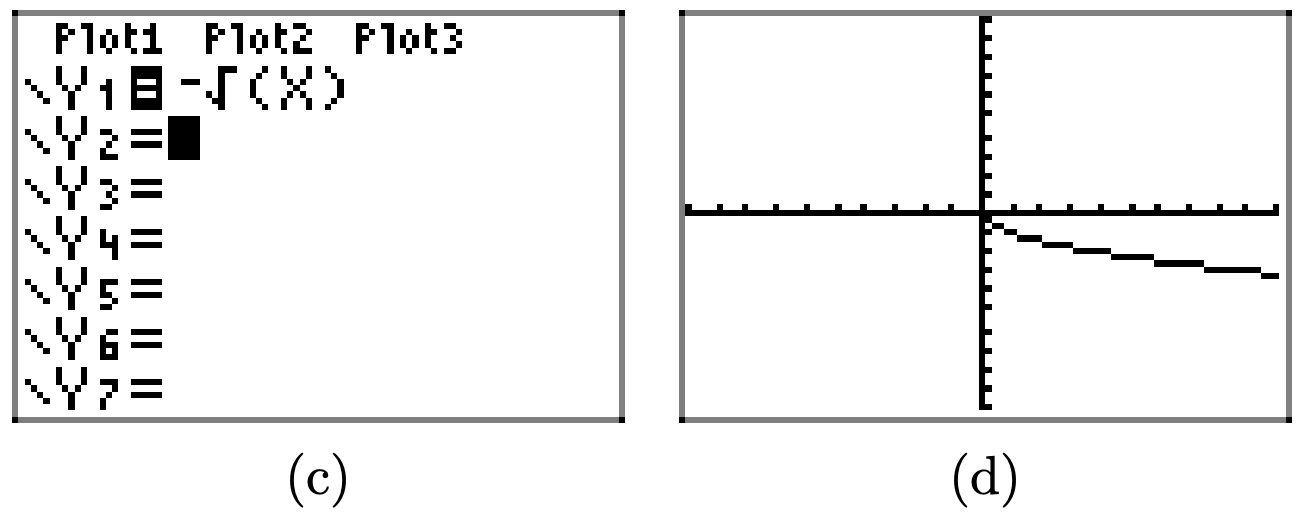
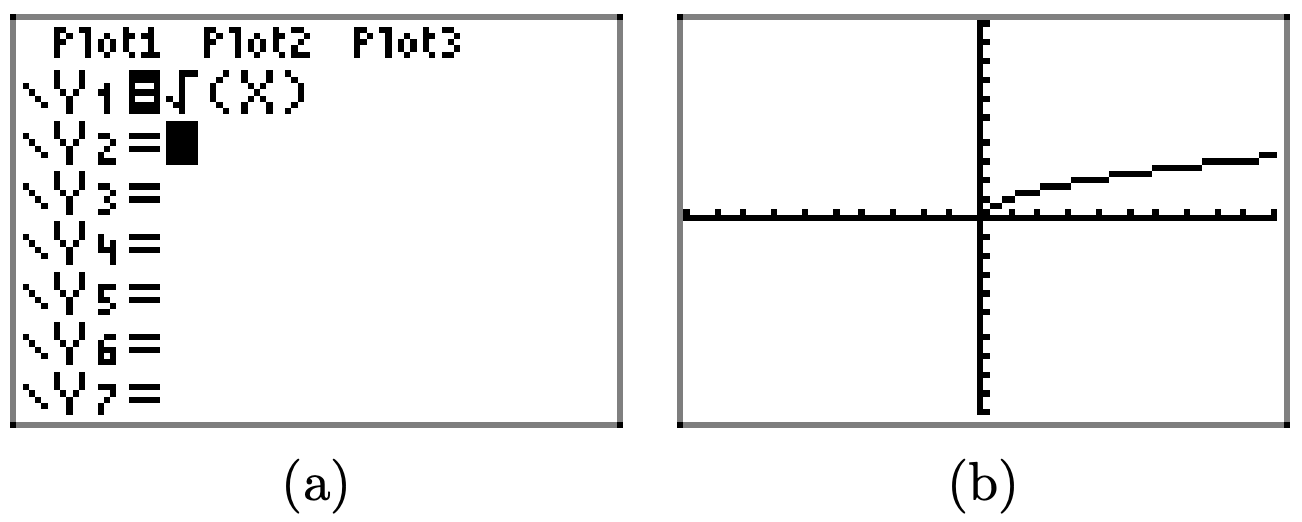
\(f(x) = \sqrt{x − 4}\) at x = 4, 5, 6, 7, 8, 9, and 10.
- Answer
-
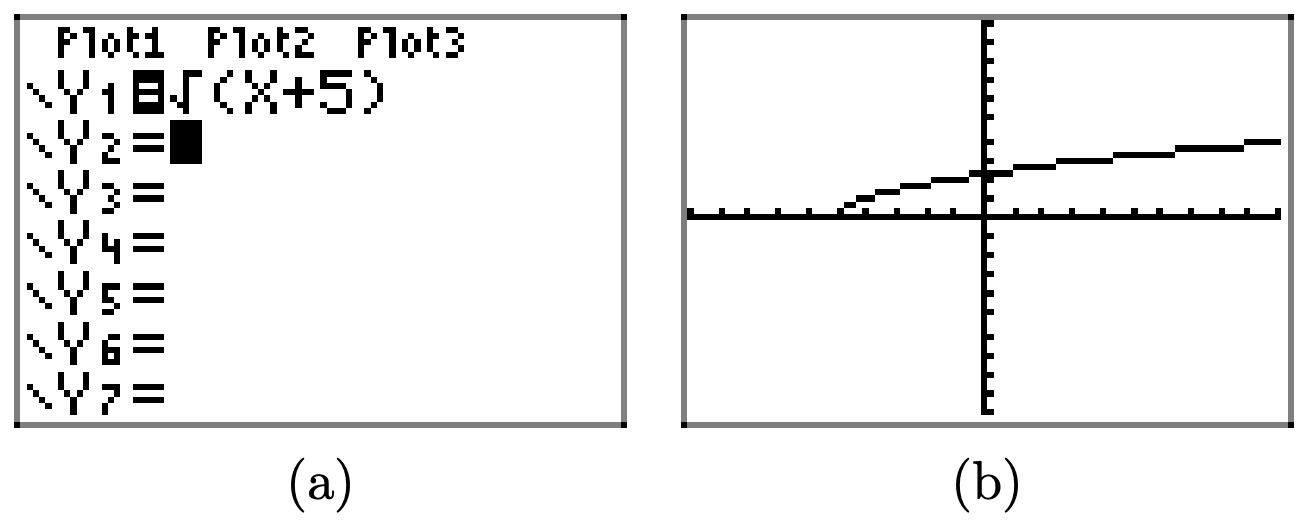
Load the function \(f(x) = \sqrt{x − 4}\) into Y1 as shown in (a). Select TBLSET, then highlight ASK for the independent variable and press ENTER (see (b)). It doesn’t matter what is entered for TblStart or ∆ Tbl. Select TABLE and enter the x-values 4, 5, 6, 7, 8, 9, and 10, as shown in (c).
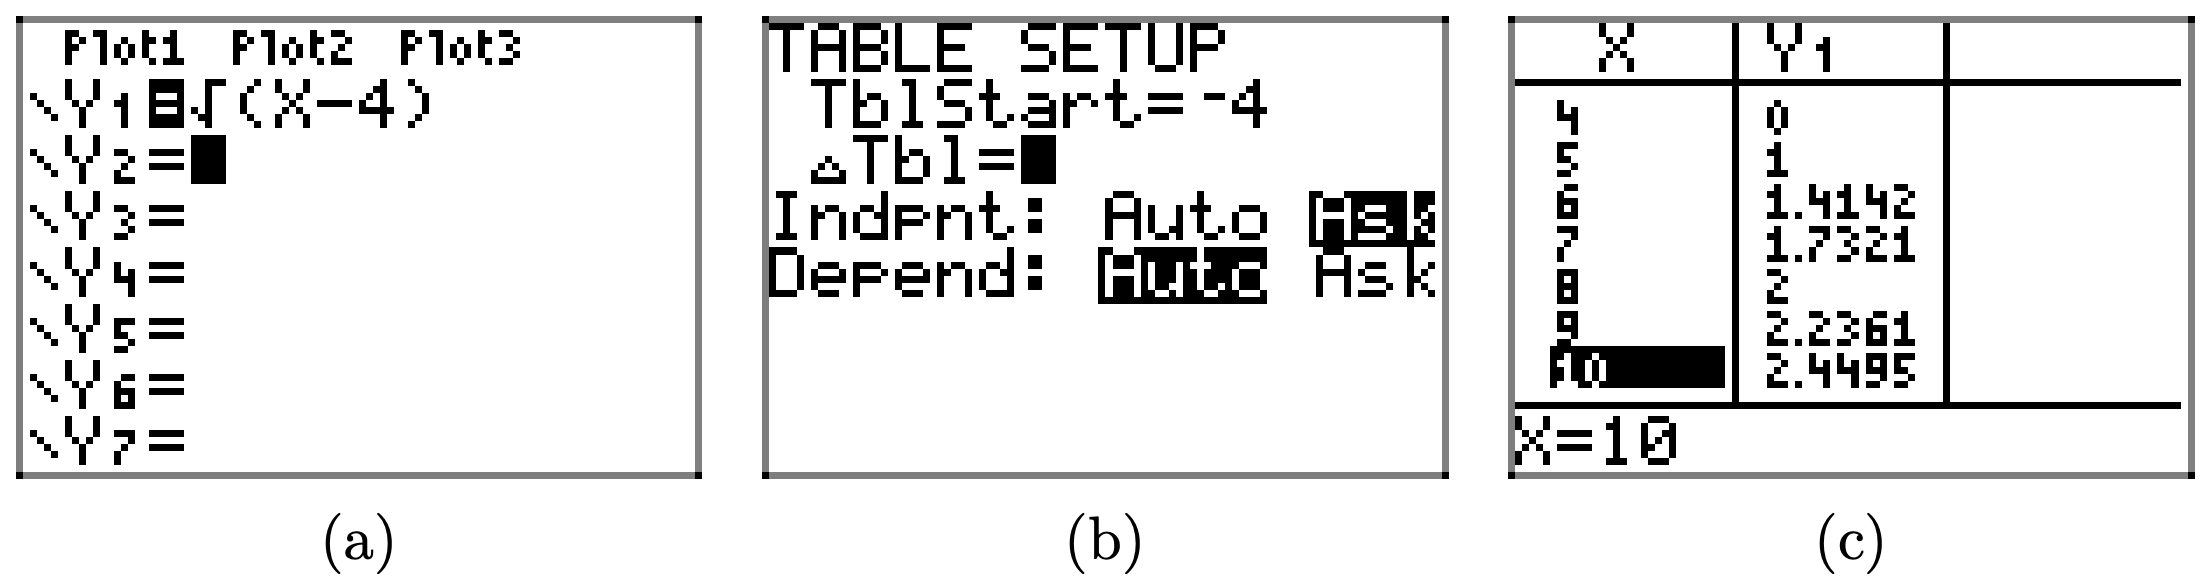
Plot the points in table (c) in (d). This is enough to intuit that the graph of f is the curve shown in (d).
\(f(x) = \sqrt{4 − x}\) at x = −10, −8, −6, −4, −2, 0, 2, and 4.
In Exercises \(\PageIndex{11}\)-\(\PageIndex{14}\), the graph of the given function is a parabola, a graph that has a “U-shape.” A parabola has only one turning point. For each exercise, perform the following tasks.
i. Load the equation into the Y= menu of your graphing calculator. Adjust the WINDOW parameters so that the “turning point” (actually called the vertex) is visible in the viewing window.
ii. Make a reasonable copy of the image in the viewing window on your homework paper. Draw all lines with a ruler (including the axes), but draw curves freehand. Label and scale each axis with xmin, xmax, ymin, and ymax. Label the graph with its equation.
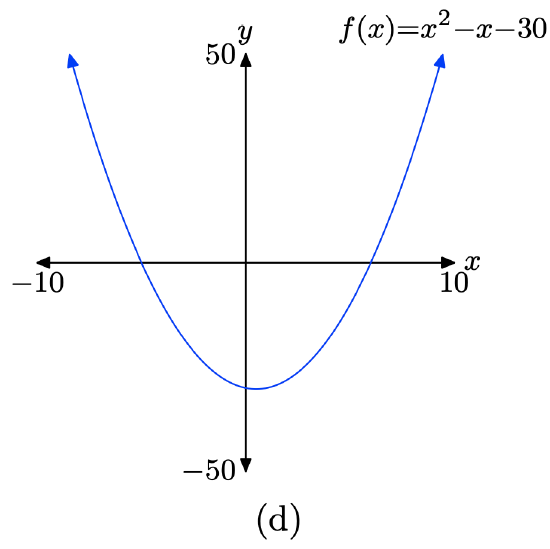
\(f(x) = x^{2} − x − 30\)
- Answer
-
Load the function \(f(x) = x^{2} − x − 30\) into Y1 as shown in (a). Adjust the WINDOW parameters as shown in (b). Push the GRAPH button to obtain the graph of f in (c).
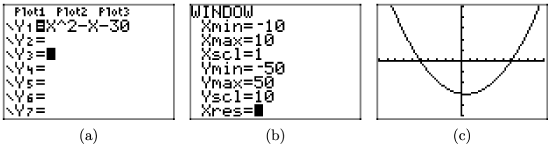
Copy the image onto your homework as shown in (d).
\(f(x) = 24 − 2x − x^2\)
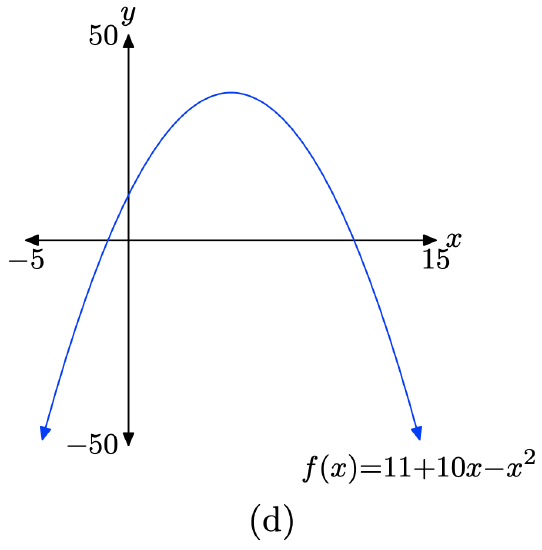
\(f(x) = 11 + 10x − x^2\)
- Answer
-
Load the function \(f(x) = 11 + 10x − x^2\) into Y1 as shown in (a). Adjust the WINDOW parameters as shown in (b). Push the GRAPH button to obtain the graph of f in (c).
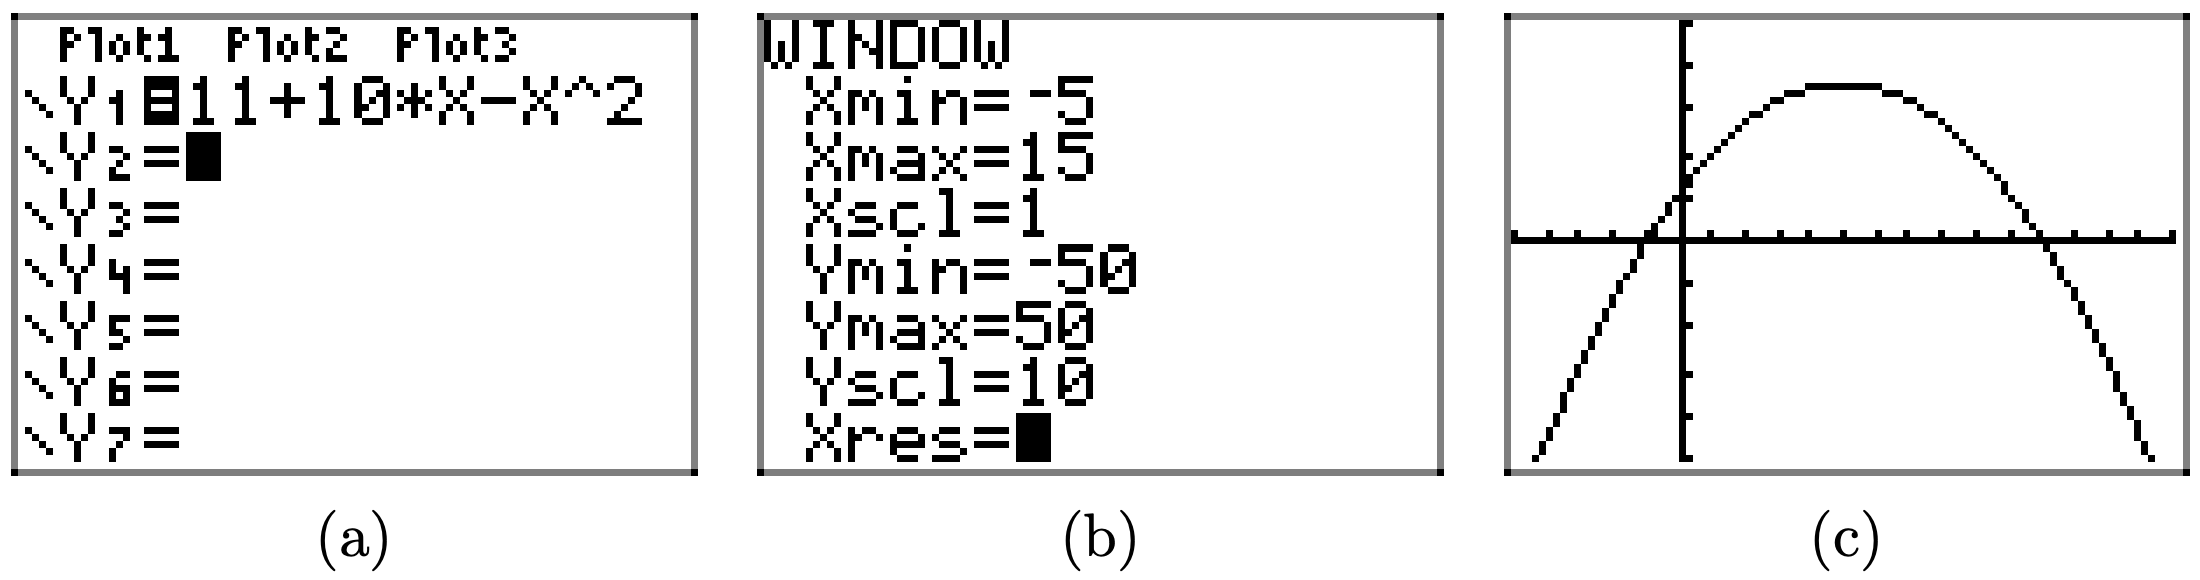
Copy the image onto your homework as shown in (d).
\(f(x) = x^2 + 11x − 12\)
Each of the equations in Exercises \(\PageIndex{15}\) - \(\PageIndex{18}\) are called “cubic polynomials.” Each equation has been carefully chosen so that its graph has exactly two “turning points.” For each exercise, perform each of the following tasks. i. Load the equation into the Y= menu of your graphing calculator and adjust the WINDOW parameters so that both “turning points” are visible in the viewing window. ii. Make a reasonable copy of the graph in the viewing window on your homework paper. Label and scale each axis with xmin, xmax, ymin, and ymax, then label the graph with its equation. Remember to draw all lines with a ruler.
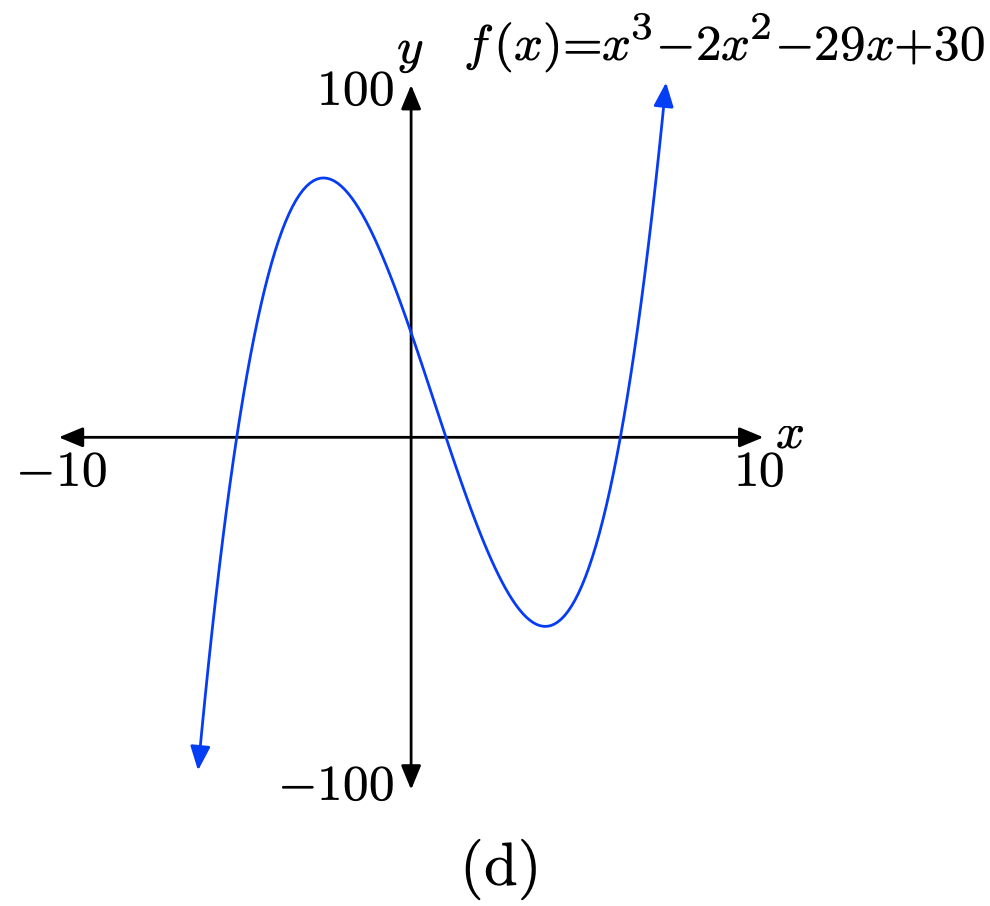
\(f(x) = x^3 − 2x^2 − 29x + 30\)
- Answer
-
Load the function \(f(x) = x^3 − 2x^2 − 29x + 30\) into Y1 as shown in (a). Adjust the WINDOW parameters as shown in (b). Push the GRAPH button to obtain the graph of f in (c).
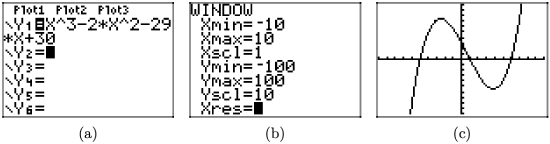
Copy the image onto your homework as shown in (d).
\(f(x) = −x^3 + 2x^2 + 19x − 20\)
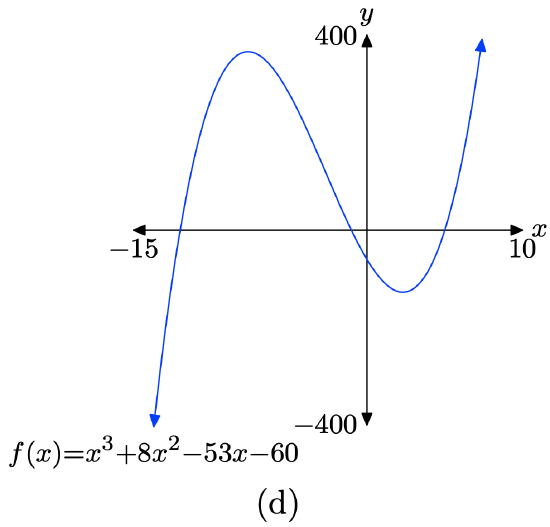
\(f(x) = x^3 + 8x^2 − 53x − 60\)
- Answer
-
Load the function \(f(x) = x^3 + 8x^2 − 53x − 60\) into Y1 as shown in (a). Adjust the WINDOW parameters as shown in (b). Push the GRAPH button to obtain the graph of f in (c).
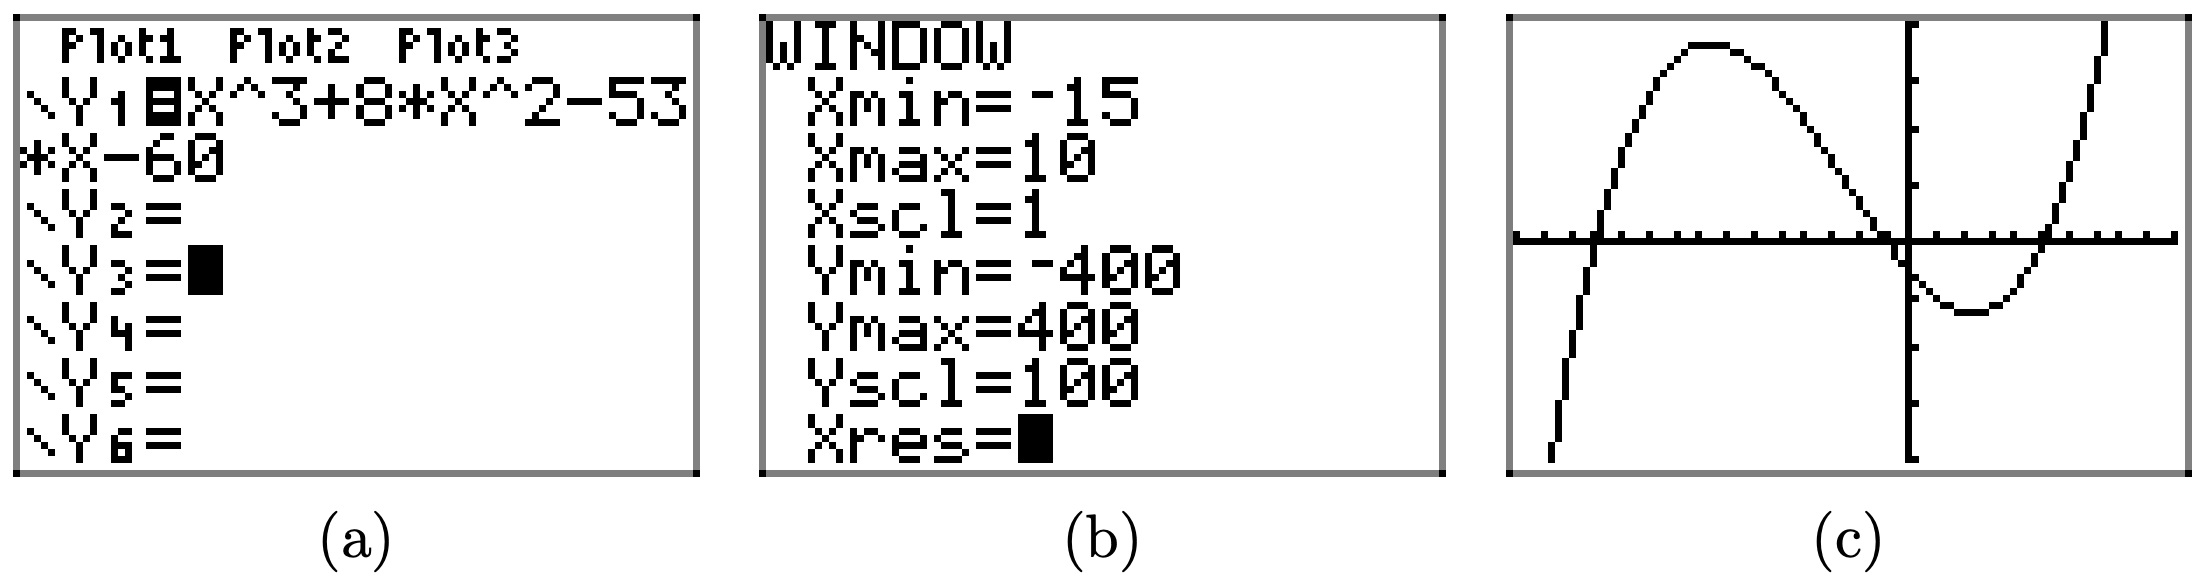
Copy the image onto your homework as shown in (d).
\(f(x) = −x^3 + 16x^2 − 43x − 60\)
Perform each of the following tasks for the equations in Exercises \(\PageIndex{19}\)-\(\PageIndex{22}\).
i. Load the equation into the Y= menu. Adjust the WINDOW parameters until you think all important behavior (“turning points,” etc.) is visible in the viewing window. Note: This is more difficult than it sounds, particularly when we have no advance notion of what the graph might look like. However, experiment with several settings until you “discover” the settings that exhibit the most important behavior.
ii. Copy the image on the screen onto your homework paper. Label and scale each axis with xmin, xmax, ymin, and ymax. Label the graph with its equation.
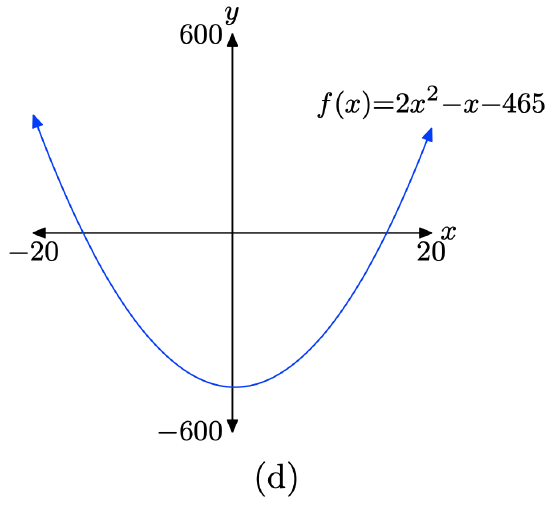
\(f(x) = 2x^2 − x − 465\)
- Answer
-
Load the function \(f(x) = 2x^2 − x − 465\) into Y1 as shown in (a). Adjust the WINDOW parameters as shown in (b). Push the GRAPH button to obtain the graph of f in (c).
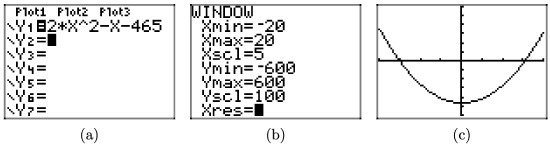
Copy the image onto your homework as shown in (d).
\(f(x) = x^3 − 24x^2 + 65x + 1050\)
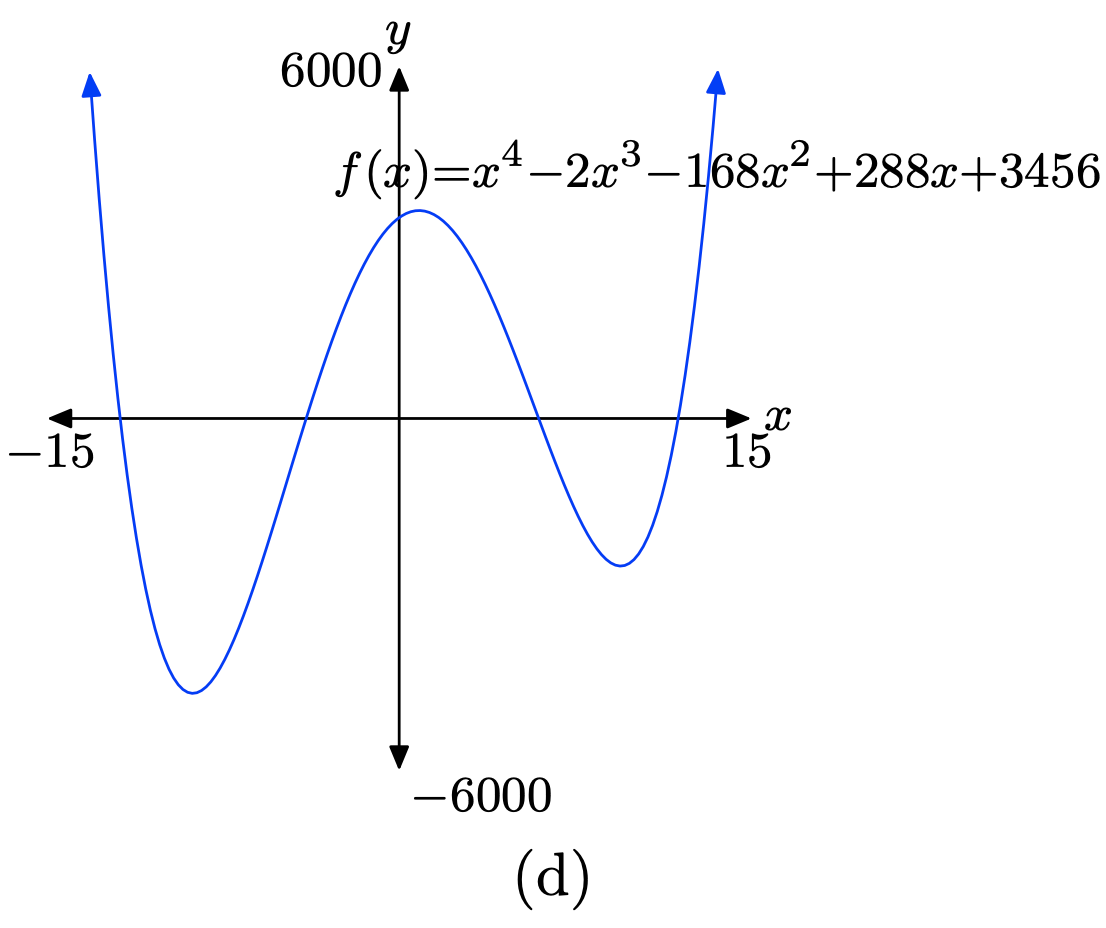
\(f(x) = x^4 − 2x^3 − 168x^2 + 288x + 3456\)
- Answer
-
Load the function \(f(x) = x^4 − 2x^3 − 168x^2 + 288x + 3456\) into Y1 as shown in (a). Adjust the WINDOW parameters as shown in (b). Push the GRAPH button to obtain the graph of f in (c).
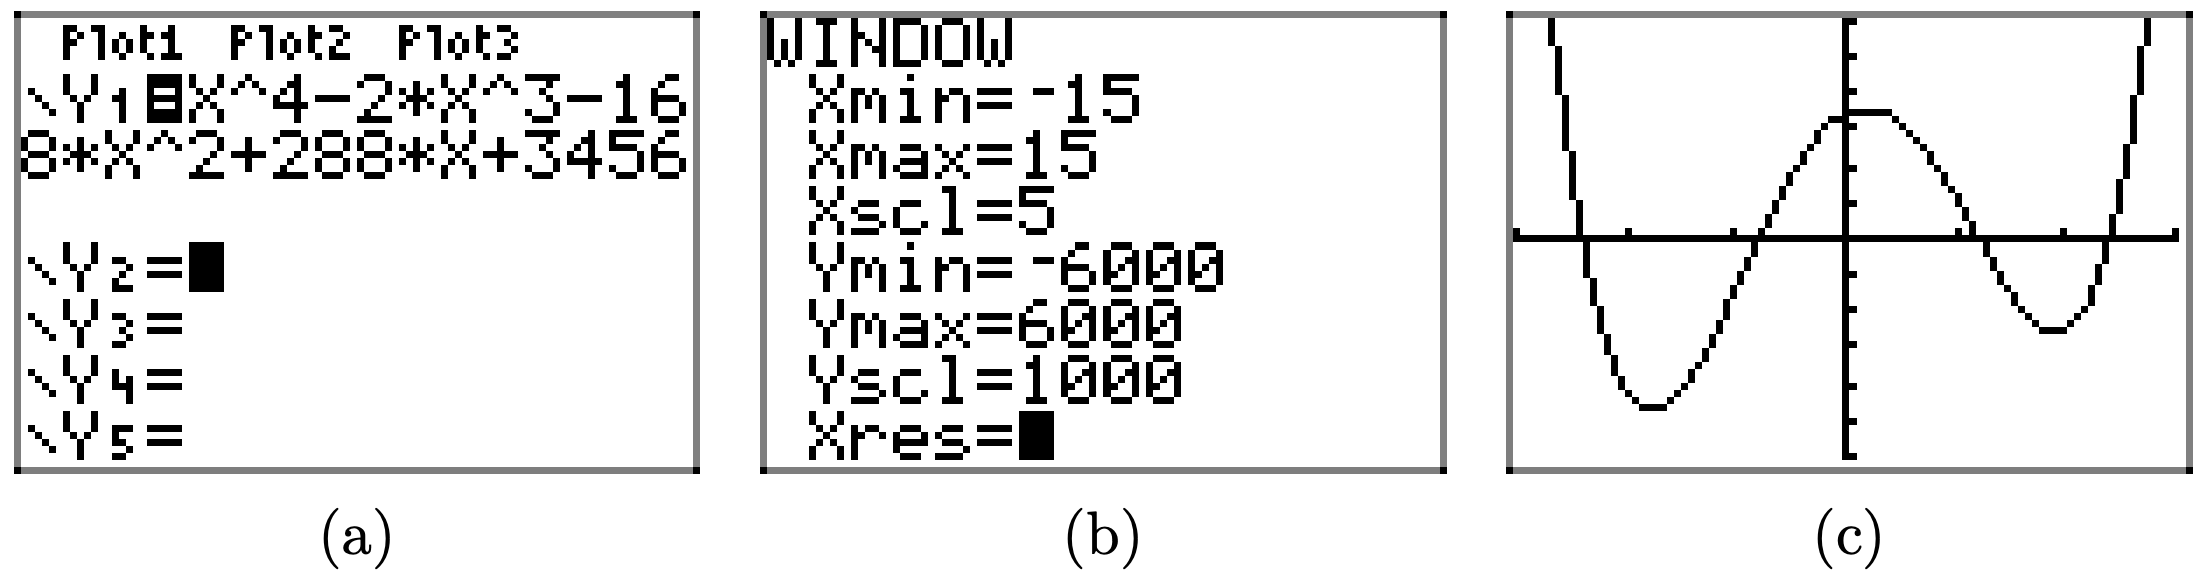
Copy the image onto your homework as shown in (d)
\(f(x) = −x^4 −3x^3 +141x^2 +523x− 660\)
2.3 Exercises
For Exercises \(\PageIndex{1}\)-\(\PageIndex{6}\), perform each of the following tasks.
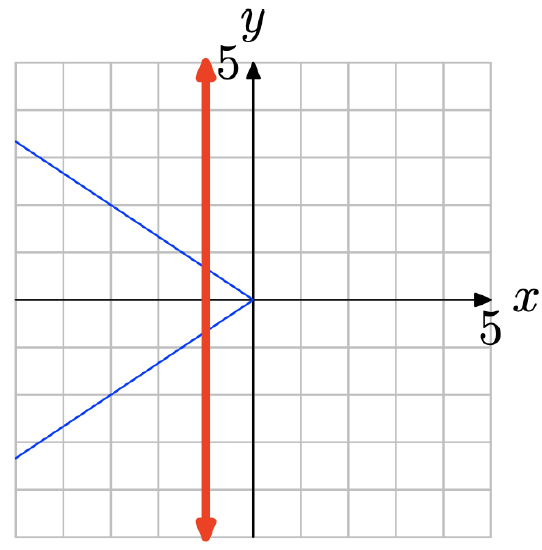
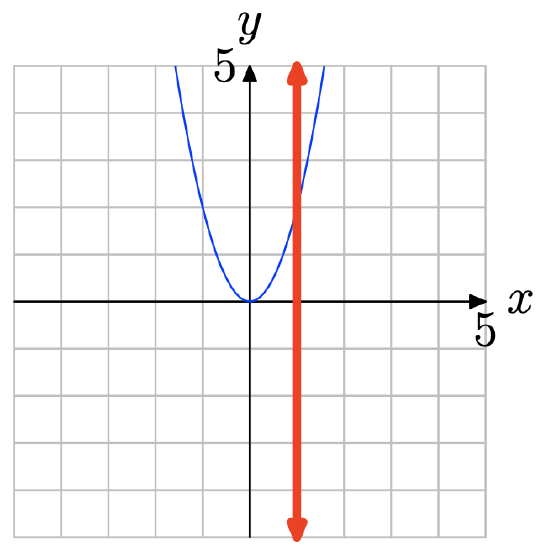
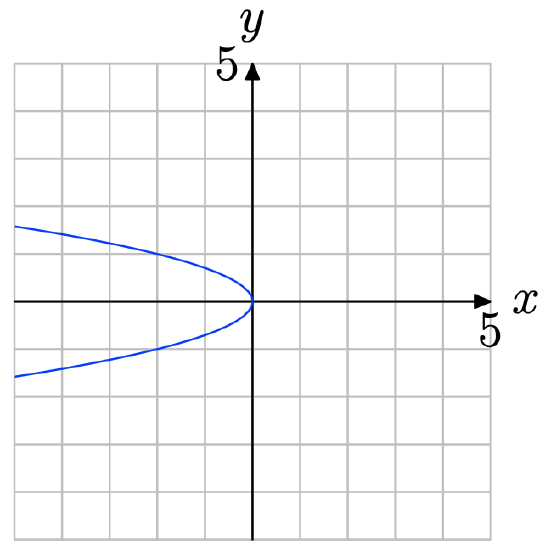
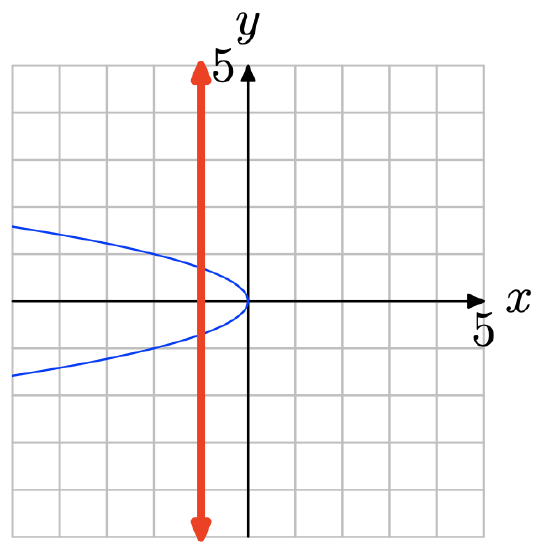
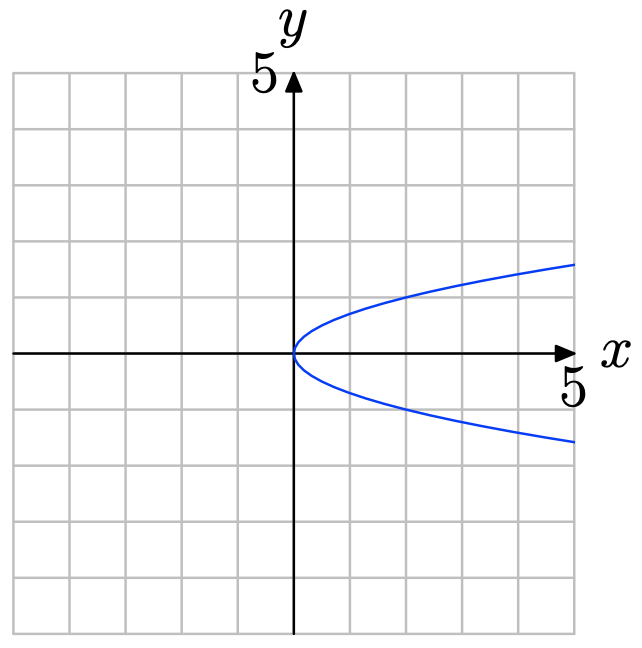
i. Make a copy of the graph on a sheet of graph paper and apply the vertical line test.
ii. Write a complete sentence stating whether or not the graph represents a function. Explain the reason for your response.
- Answer
-
Note that in the figure below a vertical line cuts the graph more than once. Therefore, the graph does not represent the graph of a function.
- Answer
-
No vertical line cuts the graph more than once (see figure below). Therefore, the graph represents a function.
- Answer
-
Note that in the figure below a vertical line cuts the graph more than once. Therefore, the graph does not represent the graph of a function.
In Exercises \(\PageIndex{7}\)-\(\PageIndex{12}\), perform each of the following tasks.
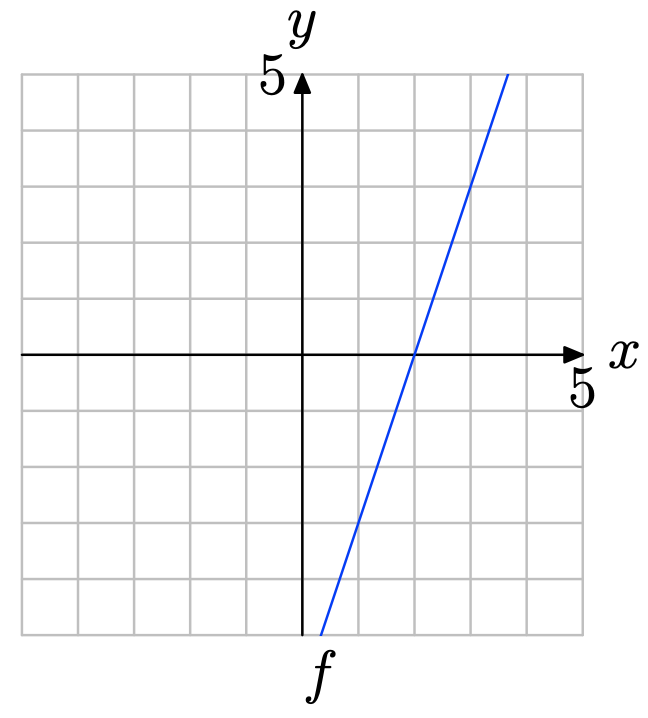
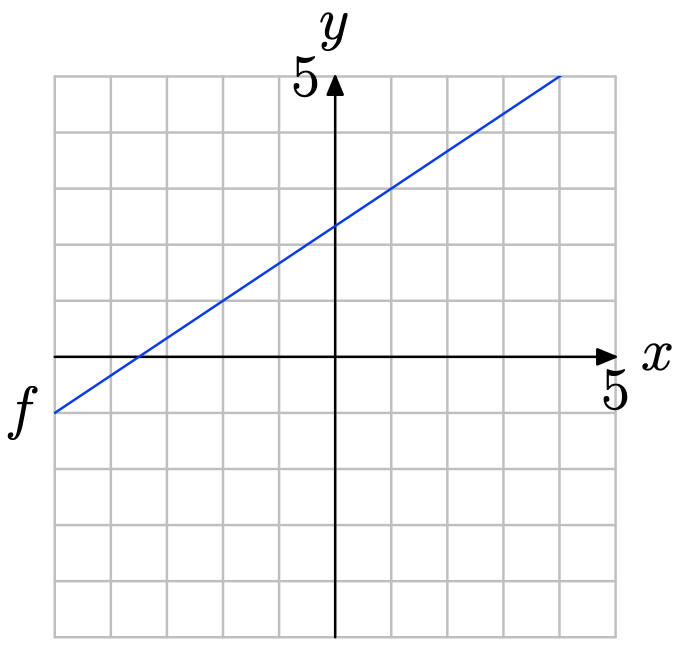
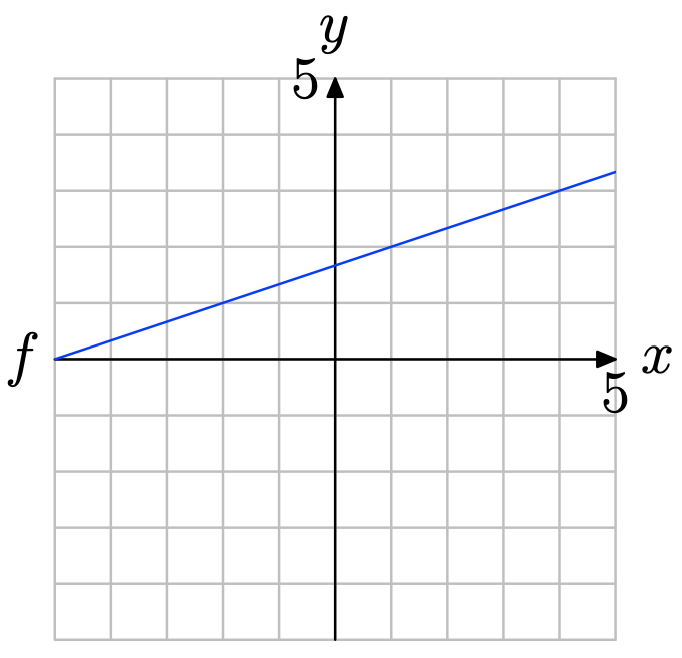
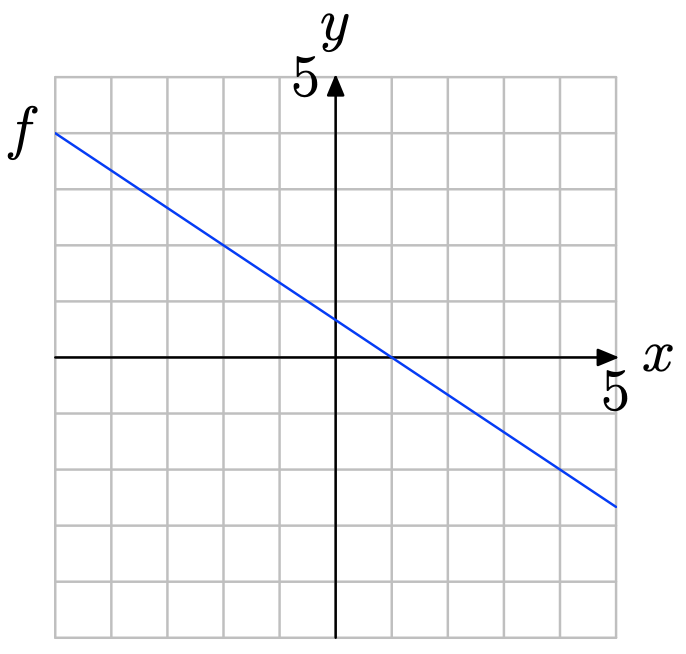
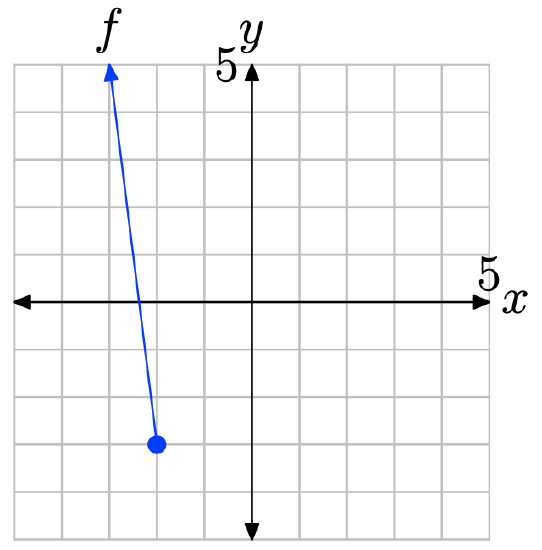
i. Make an exact copy of the graph of the function f on a sheet of graph paper. Label and scale each axis. Remember to draw all lines with a ruler.
ii. Use the technique of Examples 3 and 4 in the narrative to evaluate the function at the given value. Draw and label the arrows as shown in Figures 4 and 5 in the narrative.
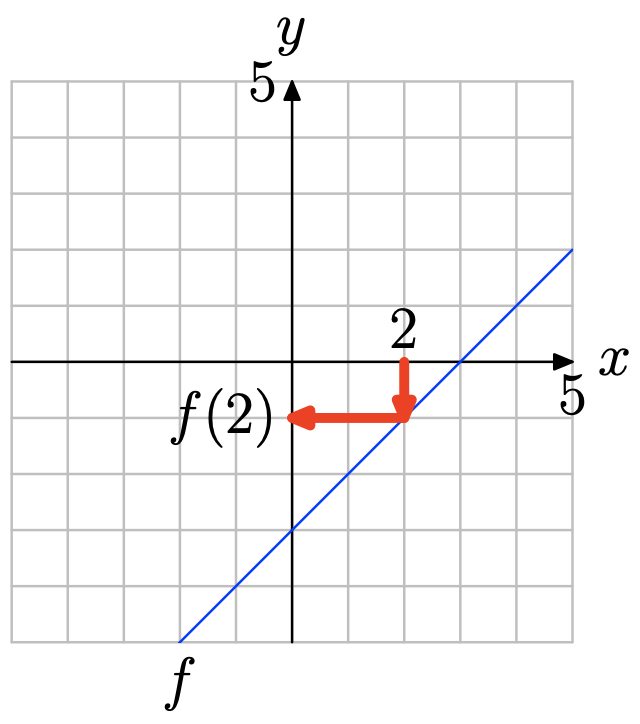
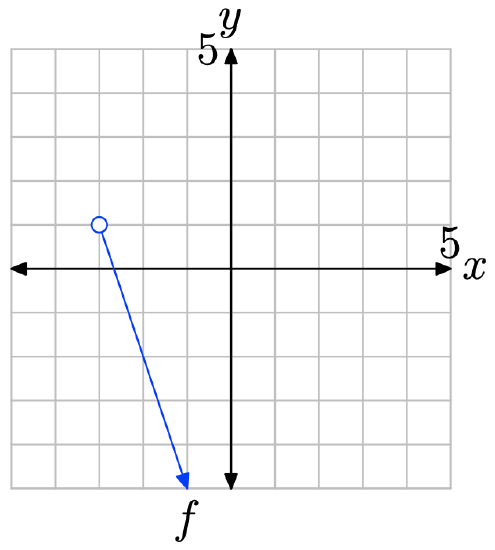
Use the graph of f to determine f(2).
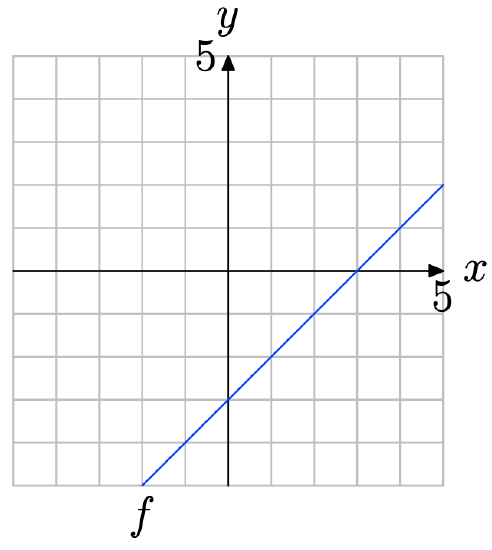
- Answer
-
Locate x = 2 on the x-axis (see figure below), draw a vertical arrow to the graph of f, then a horizontal arrow to the y-axis. Thus, f(2) = −1.
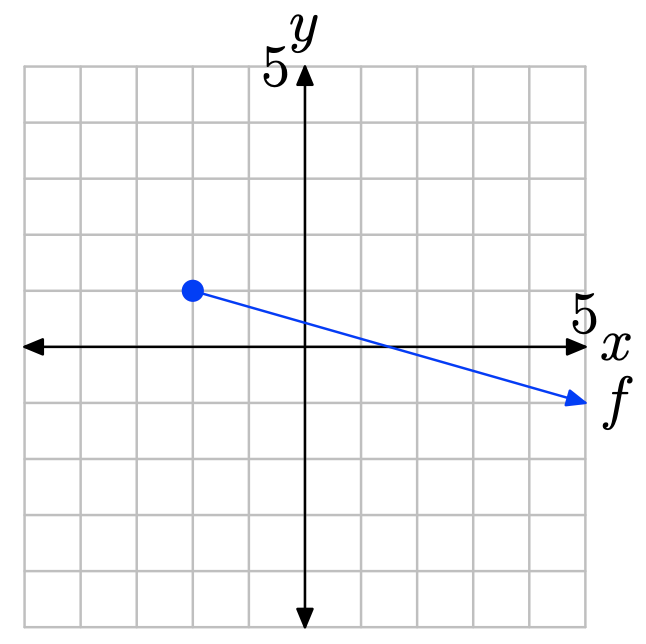
Use the graph of f to determine f(3).
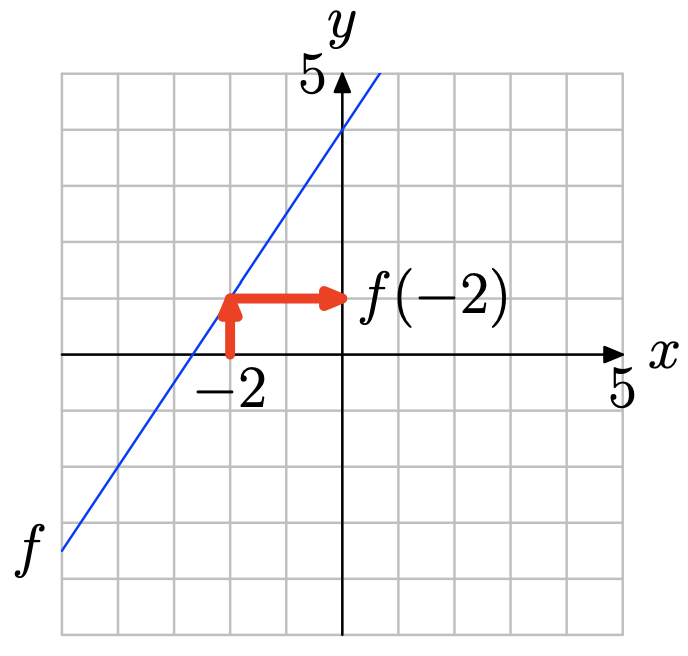
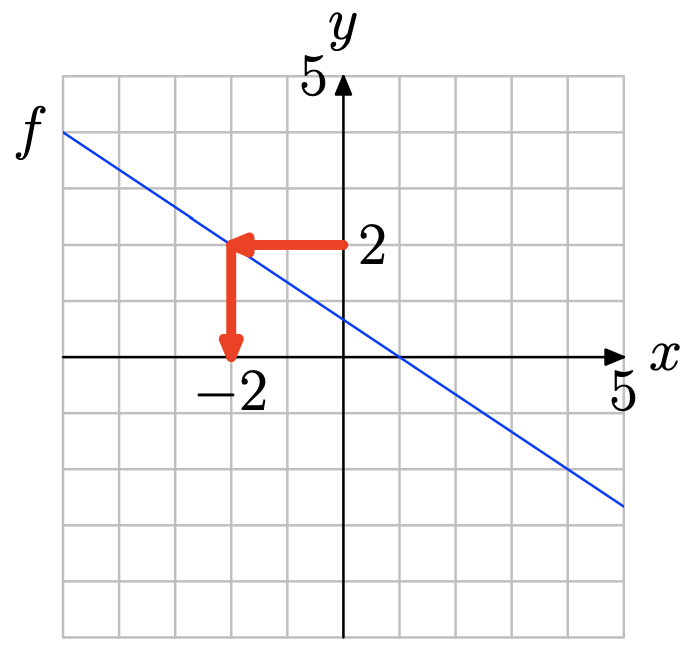
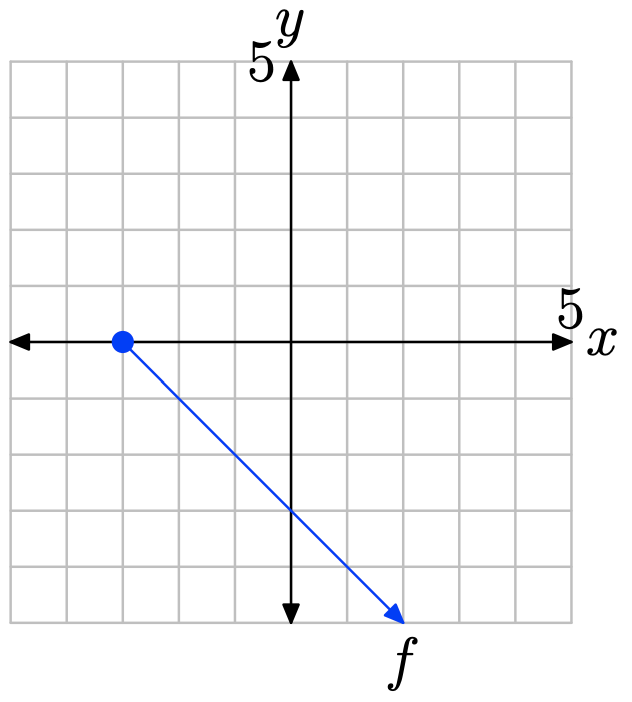
Use the graph of f to determine f(−2).
- Answer
-
Locate x = −2 on the x-axis (see figure below), draw a vertical arrow to the graph of f, then a horizontal arrow to the y-axis. Thus, f(−2) = 1.
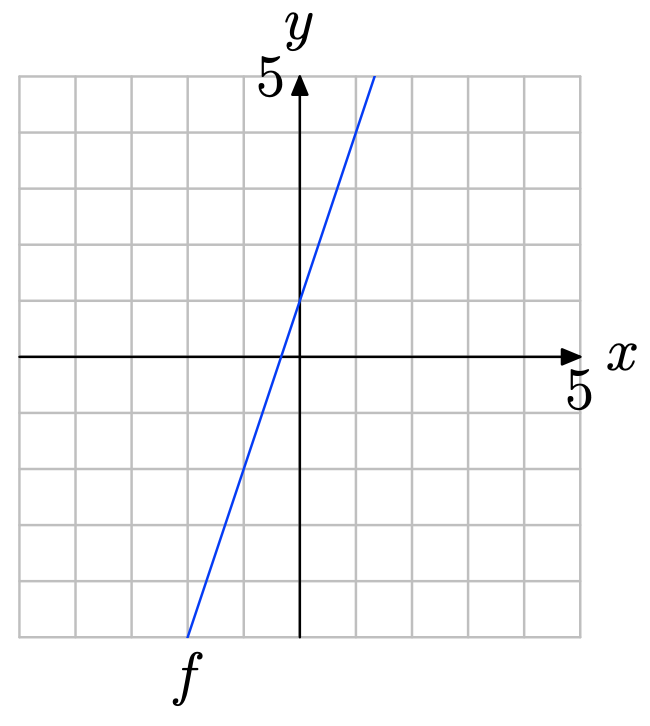
Use the graph of f to determine f(1).
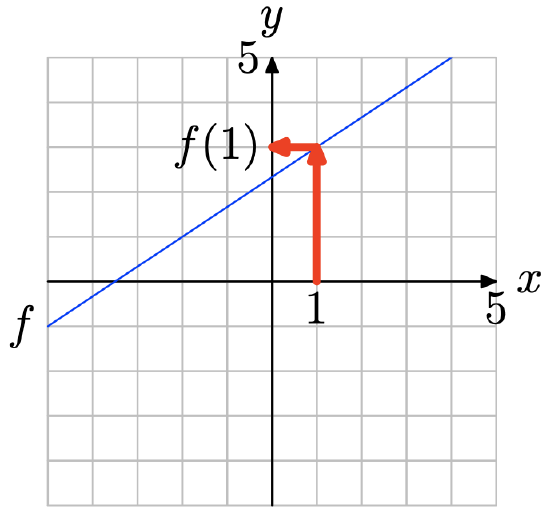
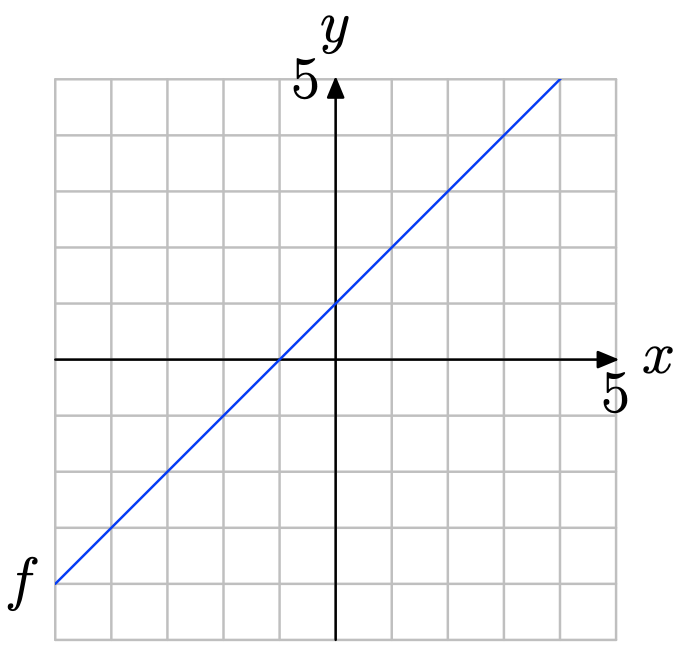
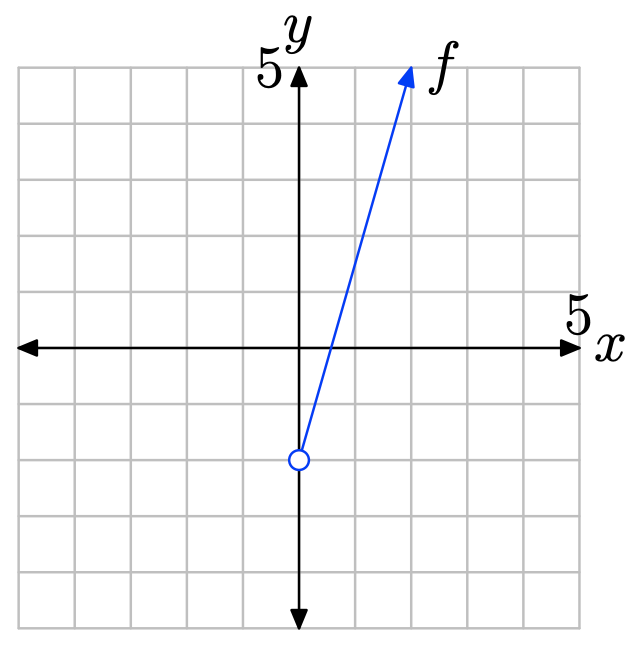
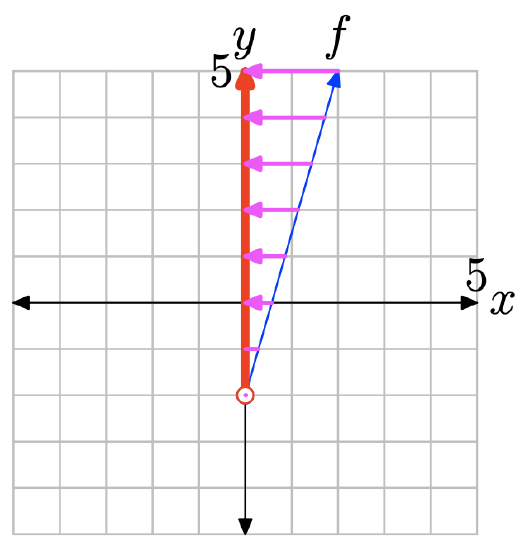
Use the graph of f to determine f(1).
- Answer
-
Locate x = 1 on the x-axis (see figure below), draw a vertical arrow to the graph of f, then a horizontal arrow to the y-axis. Thus, f(1) = 3.
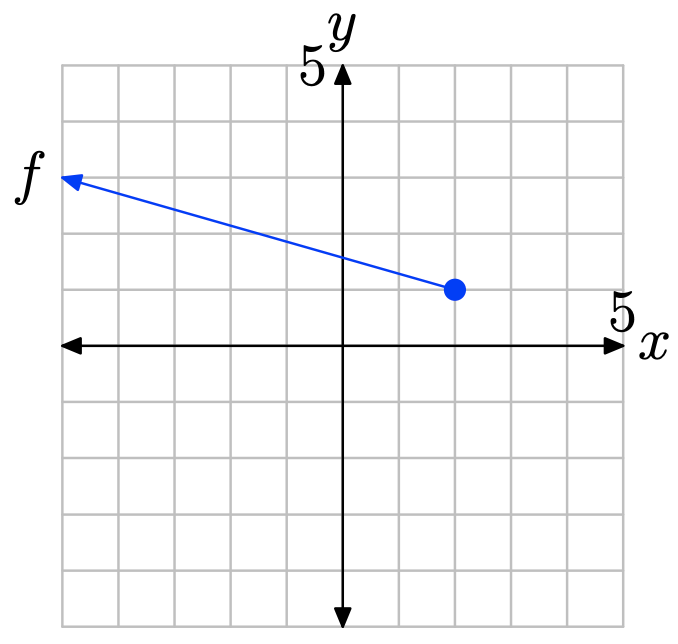
Use the graph of f to determine f(−2).
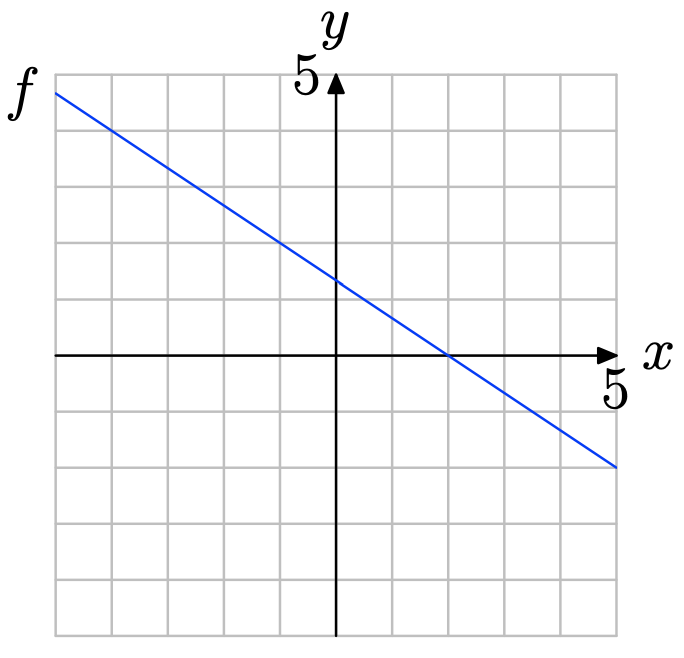
In Exercises \(\PageIndex{13}\)-\(\PageIndex{18}\), perform each of the following tasks.
i. Make an exact copy of the graph of the function f on a sheet of graph paper. Label and scale each axis. Remember to draw all lines with a ruler.
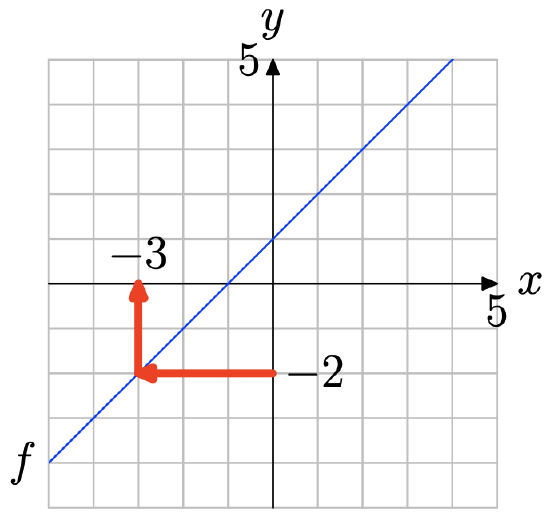
ii. Use the technique of Example 5 in the narrative to find the value of x that maps onto the given value. Draw and label the arrows as shown in Figure 6 in the narrative.
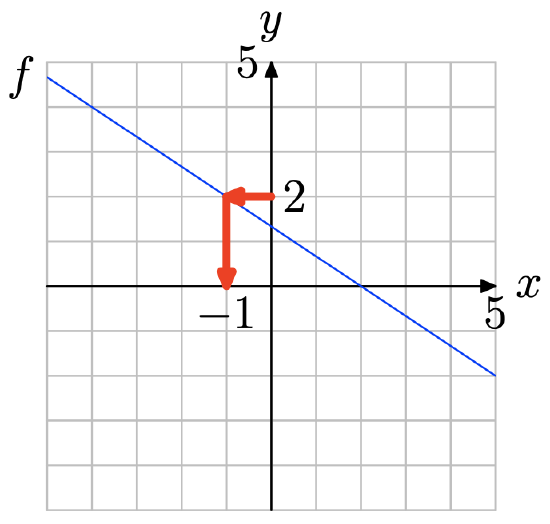
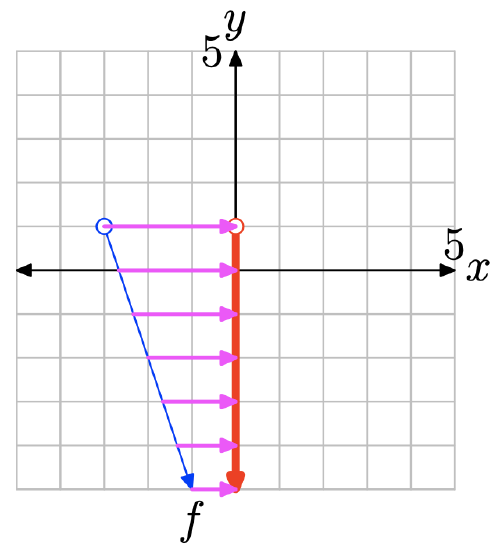
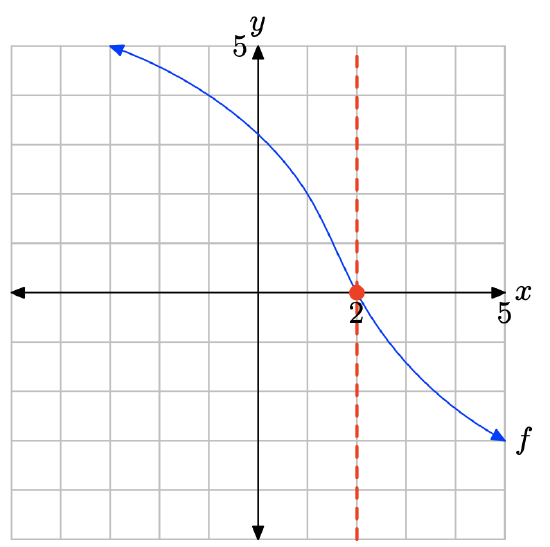
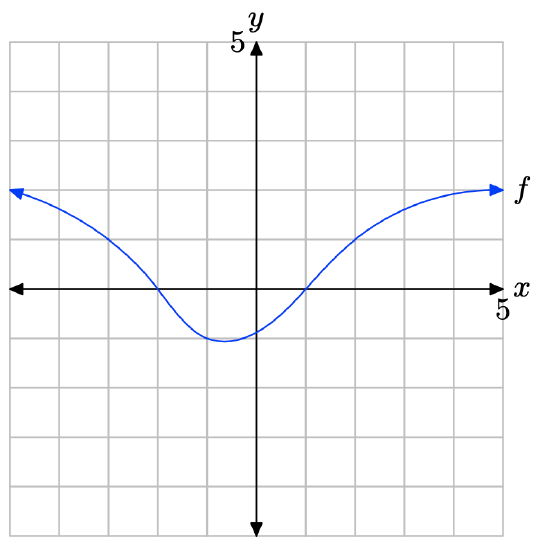
Use the graph of f to solve the equation f(x) = −2.
- Answer
-
Locate y = −2 on the y-axis (see figure below), draw a horizontal arrow to the graph of f, then a vertical arrow to the y-axis. Thus, the solution of f(x) = −2 is x = −3.
Use the graph of f to solve the equation f(x) = 1.
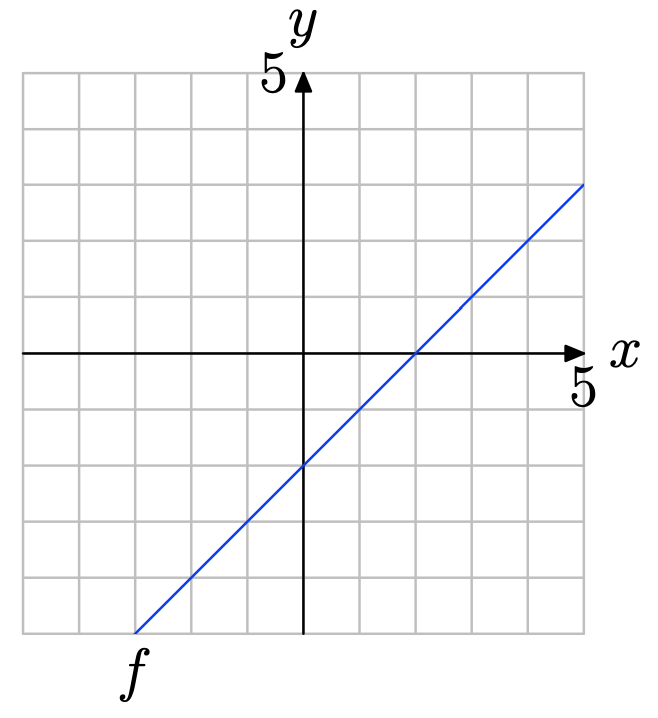
Use the graph of f to solve the equation f(x) = 2
- Answer
-
Locate y = 2 on the y-axis (see figure below), draw a horizontal arrow to the graph of f, then a vertical arrow to the y-axis. Thus, the solution of f(x) = 2 is x = −2.
Use the graph of f to solve the equation f(x) = −2.
Use the graph of f to solve the equation f(x) = 2.
- Answer
-
Locate y = 2 on the y-axis (see figure below), draw a horizontal arrow to the graph of f, then a vertical arrow to the y-axis. Thus, the solution of f(x) = 2 is x = −1.
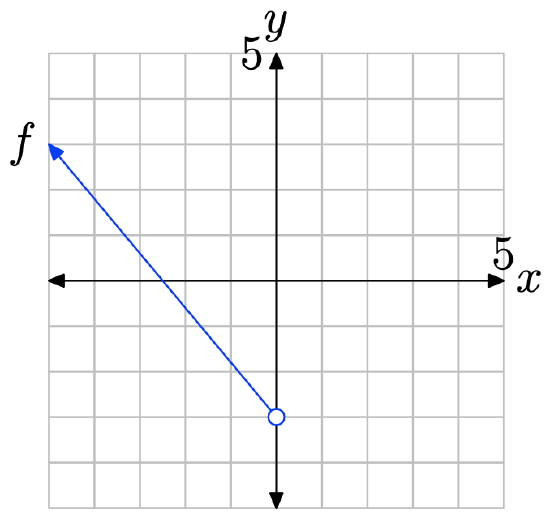
Use the graph of f to solve the equation f(x) = −3.
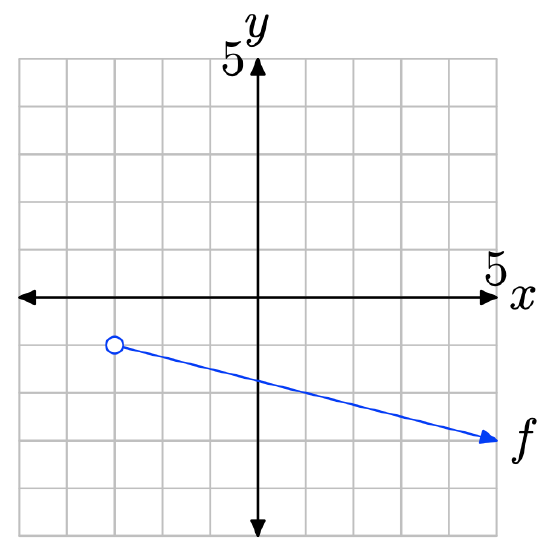
In the Exercises \(\PageIndex{19}\)-\(\PageIndex{22}\), perform each of the following tasks.
i. Make a copy of the graph of f on a sheet of graph paper. Label and scale each axis.
ii. Using a different colored pen or pencil, project each point on the graph of f onto the x-axis. Shade the resulting domain on the x-axis.
iii. Use both set-builder and interval notation to describe the domain.
- Answer
-
To find the domain of the function, project the graph of f onto the x-axis. Note that all values of x that lie to the right of −3 lie in shadow and are hence in the domain of f. Therefore, the domain is best described with the notation \(\{x : x > −3\} = (−3,\infty)\).
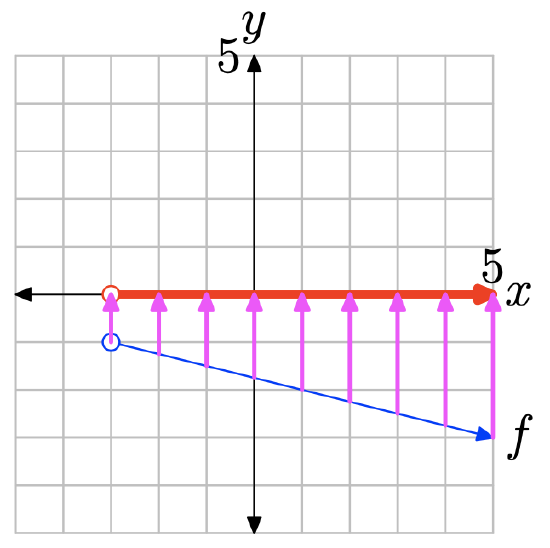
- Answer
-
To find the domain of the function, project the graph of f onto the x-axis. Note that all values of x that lie to the left of 0 lie in shadow and are hence in the domain of f. Therefore, the domain is best described with the interval notation \(\{x : x < 0\} = (−\infty, 0)\).
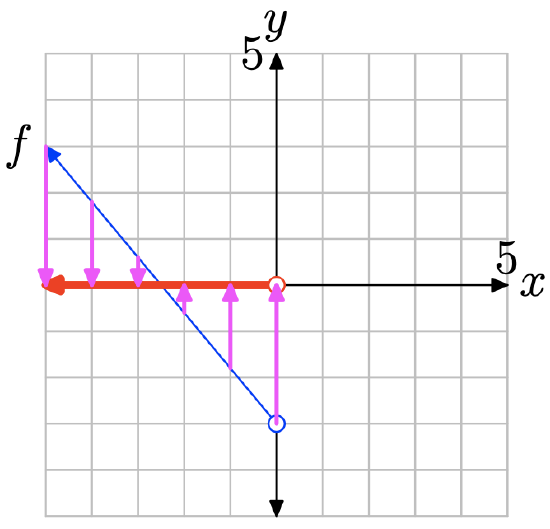
In Exercises \(\PageIndex{23}\)-\(\PageIndex{26}\), perform each of the following tasks.
i. Make a copy of the graph of f on a sheet of graph paper. Label and scale each axis.
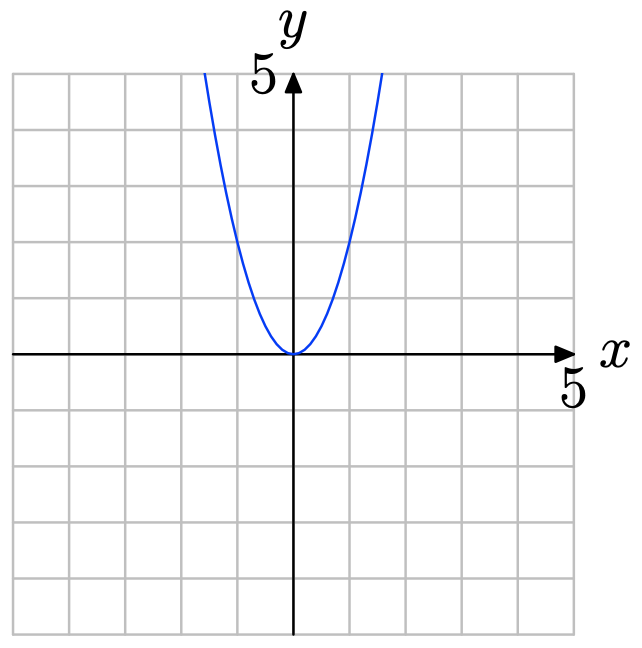
ii. Using a different colored pen or pencil, project each point on the graph of f onto the y-axis. Shade the resulting range on the y-axis. iii. Use both set-builder and interval notation to describe the range.
- Answer
-
To find the range of the function, project the graph of f onto the y-axis. Note that all values of y that lie below 1 lie in shadow and are hence in the range of f. Therefore, the range is best described with the interval notation \(\{y : y < 1\} = (−\infty, 1)\).
- Answer
-
To find the range of the function, project the graph of f onto the y-axis. Note that all values of y that lie above −2 lie in shadow and are hence in the range of f. Therefore, the range is best described with the interval notation \(\{y : y > −2\} = (−2,\infty)\).
In Exercises \(\PageIndex{27}\)-\(\PageIndex{30}\), perform each of the following tasks.
i. Use your graphing calculator to draw the graph of the given function. Make a reasonably accurate copy of the image in your viewing screen on your homework paper. Label and scale each axis with the WINDOW parameters xmin, xmax, ymin, and ymax. Label the graph with its equation.
ii. Using a colored pencil, project each point on the graph onto the x-axis; i.e., shade the domain on the x-axis. Use interval and set-builder notation to describe the domain.
iii. Use a purely algebraic technique, as demonstrated in Example 8 in the narrative, to find the domain. Compare this result with that found in part (ii).
iv. Using a different colored pencil, project each point on the graph onto the y-axis; i.e., shade the range on the y-axis. Use interval and set-builder notation to describe the range.
\(f(x) = \sqrt{x + 5}\).
- Answer
-
Load the function \(f(x) = \sqrt{x + 5}\) into Y1 as shown in (a). Select 6:ZStandrd from the ZOOM menu to produce the graph in (b).
Copy the image in (b) onto your homework paper, then project the domain and range onto the x- and y-axes, as shown in (c) and (d), respectively.
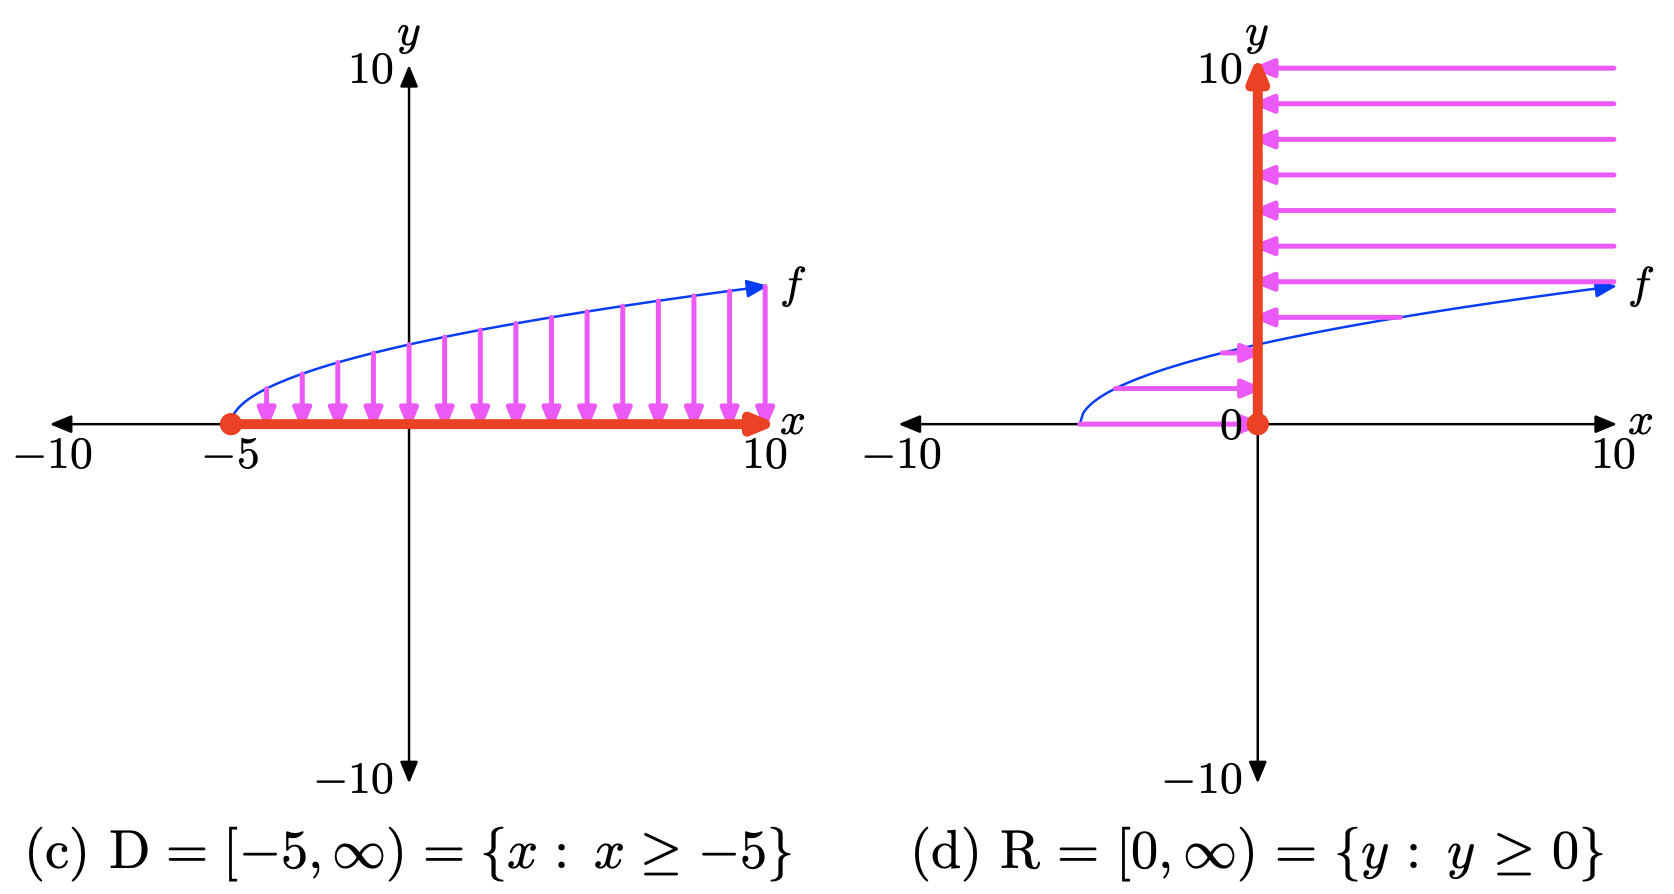
To find the domain algebraically, note that you cannot take the square root of a negative number, so the expression under the radical in \(f(x) = \sqrt{x + 5}\), namely x+5, must either be positive or zero (nonnegative). That is,
\[x + 5 \geq 0 \nonumber \]
or equivalently,
\[x\geq -5 \nonumber \]
Thus, the domain of f is Domain = \([−5,\infty)\), or in set-builder notation, Domain = \({x : x \geq −5}\).
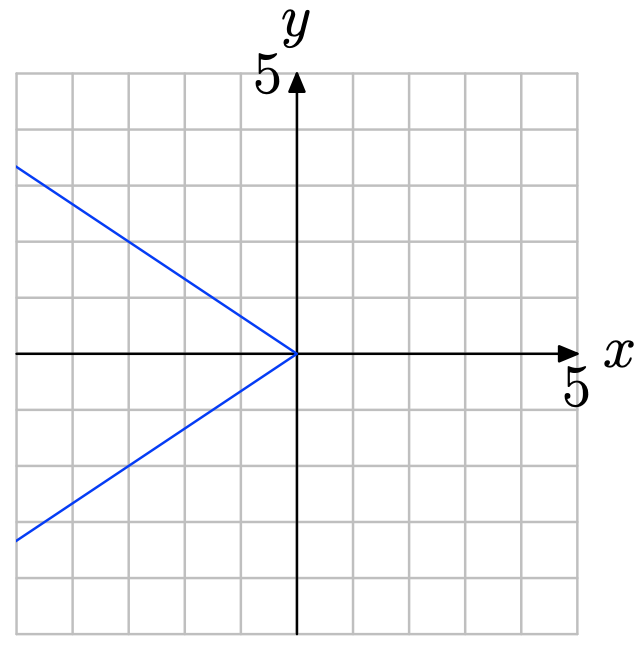
\(f(x) = \sqrt{5-x}\)
\(f(x) = − \sqrt{4 − x}\).
- Answer
-
Load the function \(f(x) = − \sqrt{4 − x}\). into Y1 as shown in (a). Select 6:ZStandrd from the ZOOM menu to produce the graph in (b).
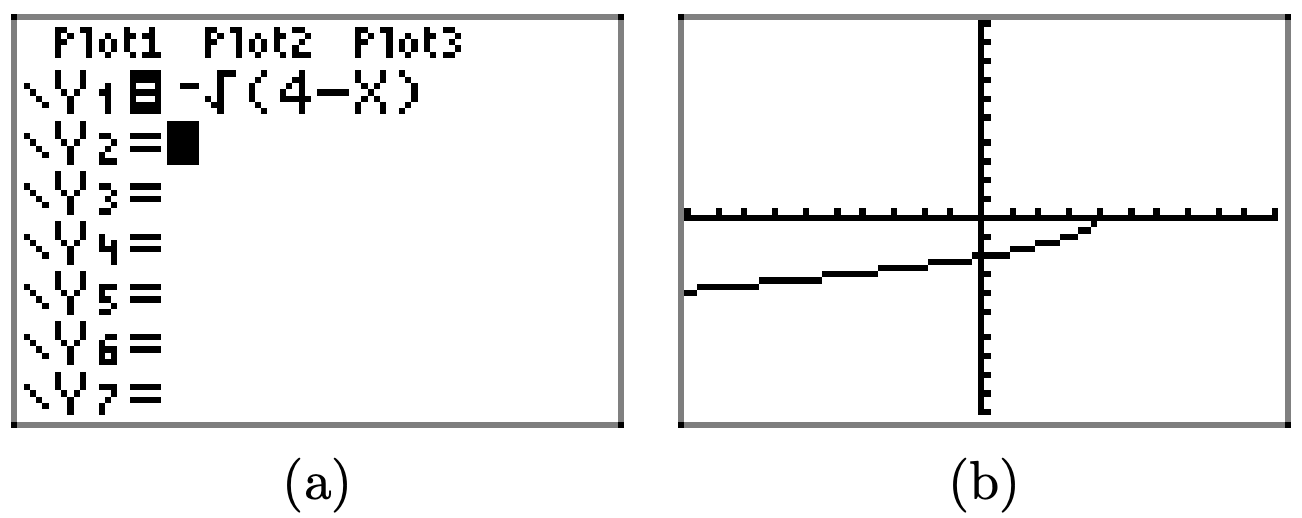
Copy the image in (b) onto your homework paper, then project the domain and range onto the x- and y-axes, as shown in (c) and (d), respectively.
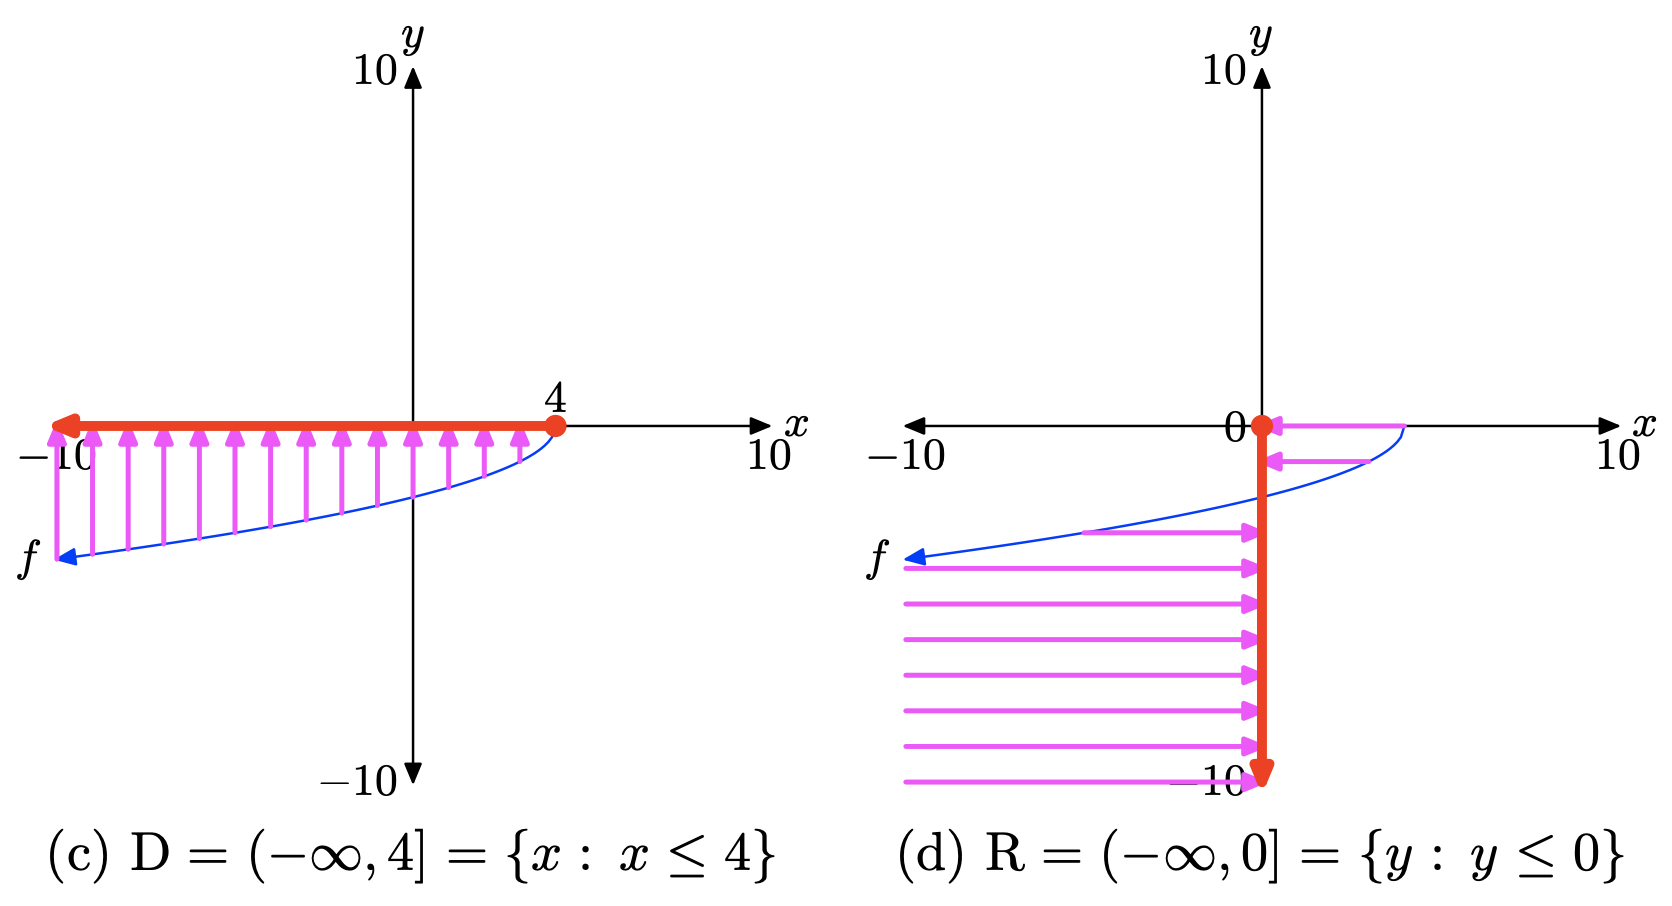
To find the domain algebraically, note that you cannot take the square root of a negative number, so the expression under the radical in \(f(x) = − \sqrt{4 − x}\), namely 4−x, must either be positive or zero (nonnegative). That is,
\[4-x\geq 0 \nonumber \]
or equivalently,
\[-x \geq -4 \\ x\leq 4 \nonumber \]
Thus, the domain of f is Domain = \((\infty, 4]\), or in set-builder notation, Domain = \(\{x : x \leq 4\}\).
\(f(x) = − \sqrt{x + 4}\)
2.4 Exercises
In Exercises \(\PageIndex{1}\)-\(\PageIndex{6}\), you are given the definition of two functions f and g. Compare the functions, as in Example 1 of the narrative, at the given values of x.
f(x) = x+2, g(x) = 4−x at x = −3, 1, and 2.
- Answer
-
We’re given that f(x) = x + 2 and g(x) = 4 − x. At x = −3,
\[f(−3) = −3 + 2 = −1 \\ g(−3) = 4 − (−3) = 7 \nonumber \]
Therefore, f(−3) < g(−3). At x = 1,
\[f(1) = 1 + 2 = 3 \\ g(1) = 4 − 1 = 3. \nonumber \]
Therefore, f(1) = g(1). At x = 2,
\[f(2) = 2 + 2 = 4 \\ g(2) = 4 − 2 = 2. \nonumber \]
Therefore, f(2) > g(2).
f(x) = 2x − 3, g(x) = 3 − x at x = −4, 2, and 5.
f(x) = 3−x, g(x) = x+9 at x = −4, −3, and −2.
- Answer
-
We’re given that f(x) = 3 − x and g(x) = x + 9. At x = −4,
\[f(−4) = 3 − (−4) = 7 \\ g(−4) = −4 + 9 = 5 \nonumber \]
Therefore, f(−4) > g(−4). At x = −3,
\[f(−3) = 3 − (−3) = 6 \\ g(−3) = −3 + 9 = 6 \nonumber \]
Therefore, f(−3) = g(−3). At x = −2,
\[f(−2) = 3 − (−2) = 5 \\ g(−2) = −2 + 9 = 7 \nonumber \]
Therefore, f(−2) < g(−2).
\(f(x) = x^2\), g(x) = 4x + 5 at x = −2, 1, and 6.
\(f(x) = x^2\), g(x) = −3x − 2 at x = −3, −1, and 0.
- Answer
-
We’re given that \(f(x) = x^2\) and g(x) = −3x − 2. At x = −3,
\[f(−3) = (−3)2 = 9 \\ g(−3) = −3(−3) − 2 = 7 \nonumber \]
Therefore, f(−3) > g(−3). At x = −1,
\[f(−1) = (−1)2 = 1 \\ g(−1) = −3(−1) − 2 = 1 \nonumber \]
Therefore, f(−1) = g(−1). At x = 0,
\[f(0) = (0)2 = 0 \\ g(0) = −3(0) − 2 = −2 \nonumber \]
Therefore, f(0) > g(0).
f(x) = |x|, g(x) = 4 − x at x = 1, 2, and 3.
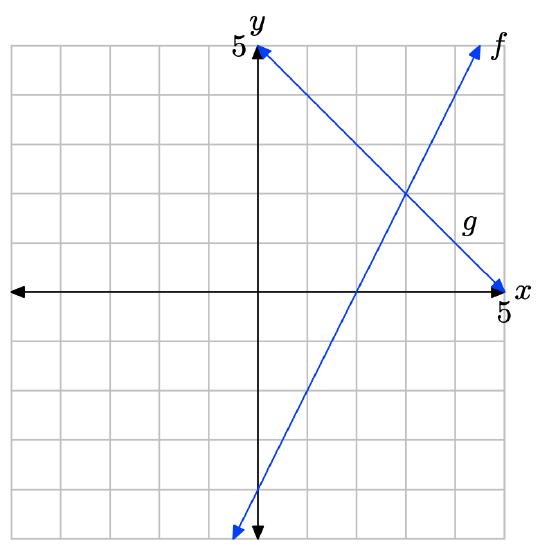
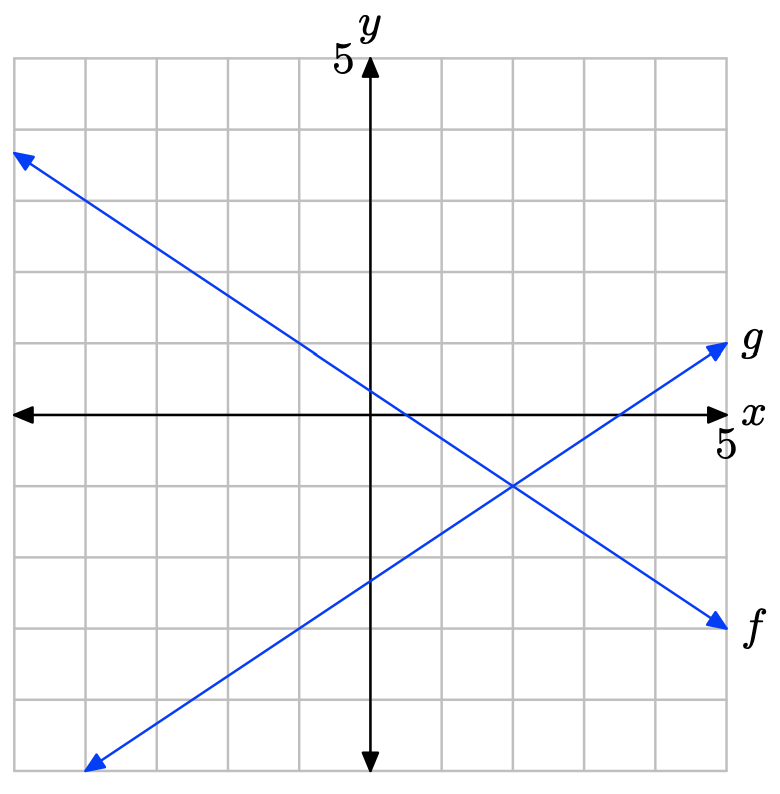
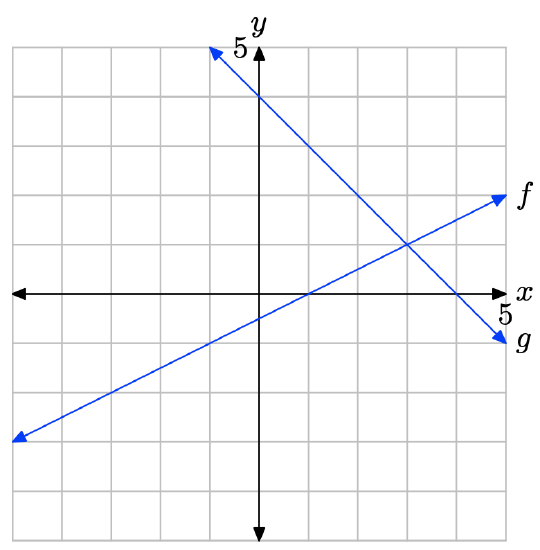
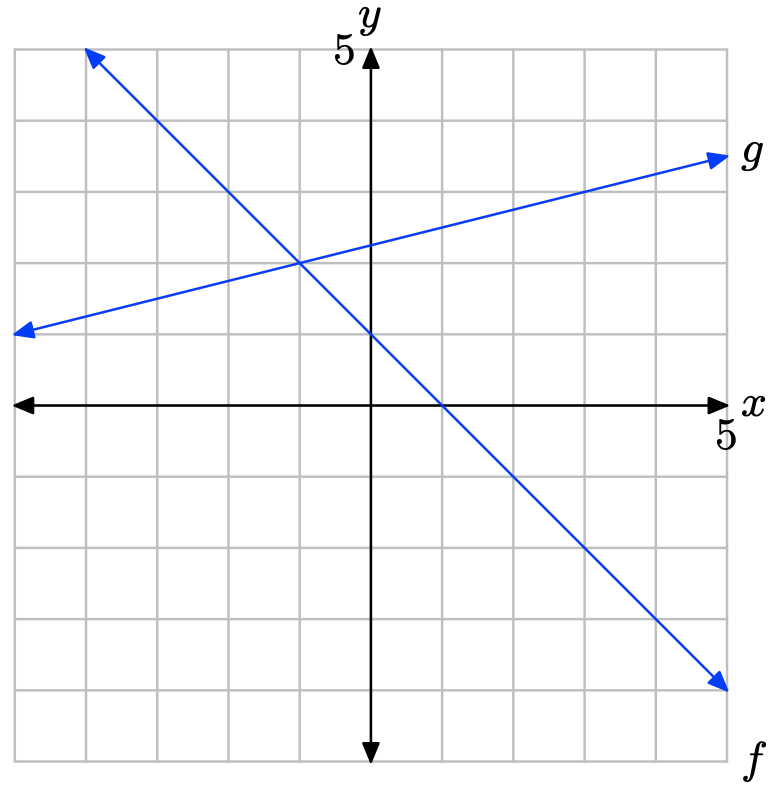
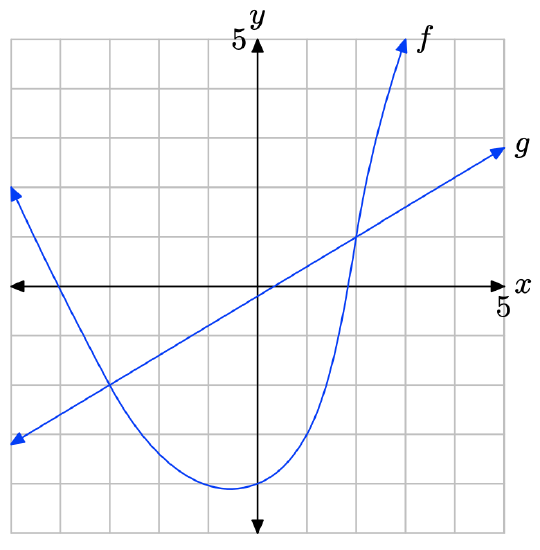
In Exercises \(\PageIndex{7}\)-\(\PageIndex{12}\), perform each of the following tasks. Remember to use a ruler to draw all lines.
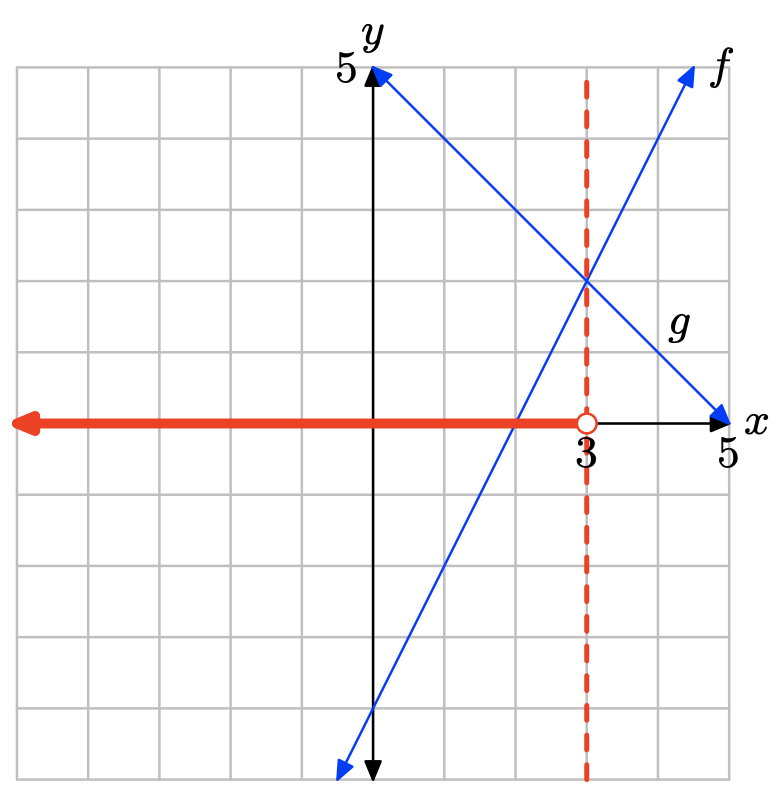
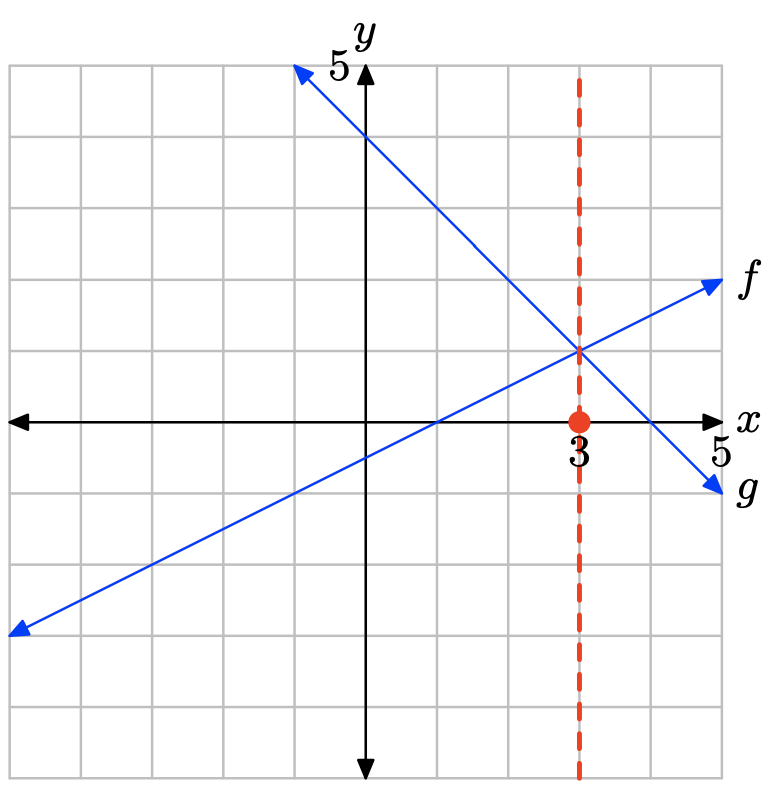
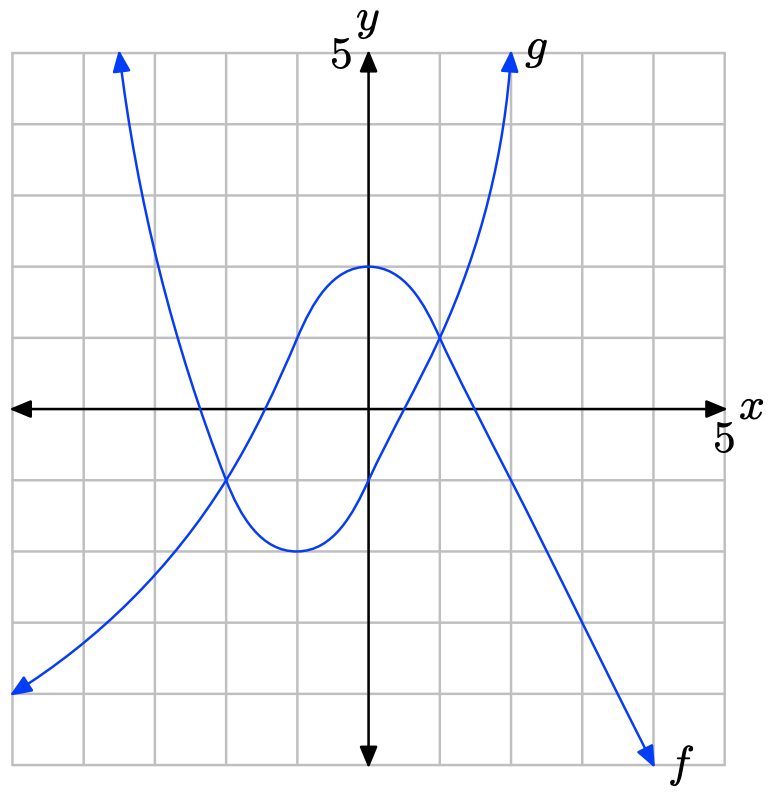
i. Make an accurate copy of the image on graph paper (label each equation, label and scale each axis), drop a dashed vertical line through the point of intersection, then label and shade the solution of f(x) = g(x) on the x-axis.
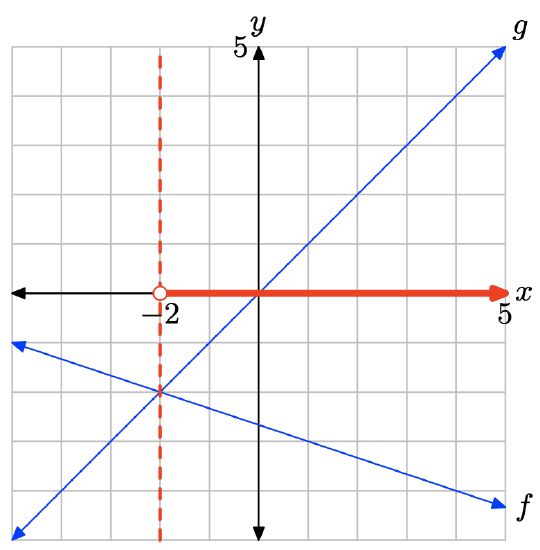
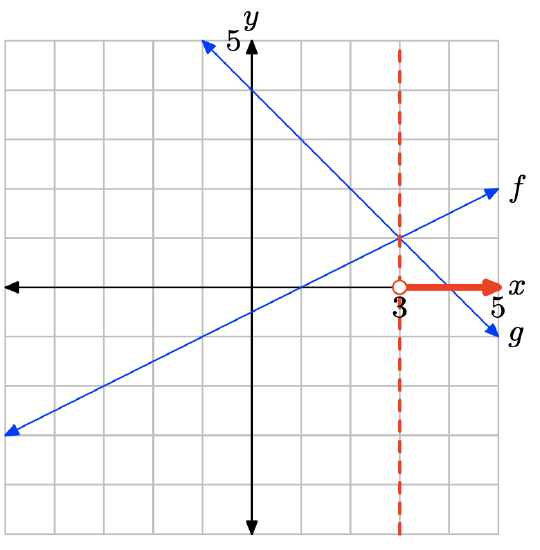
ii. Make a second copy of the image on graph paper, drop a dashed, vertical line through the point of intersection, then label and shade the solution of f(x) > g(x) on the x-axis. Use set-builder and interval notation to describe your solution set.
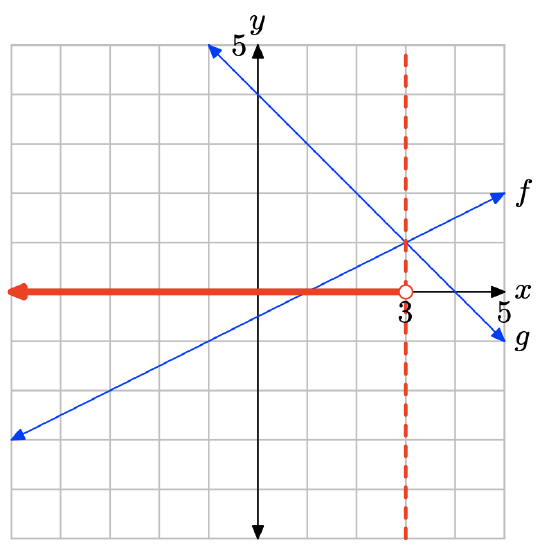
iii. Make a third copy of the image on graph paper, drop a dashed, vertical line through the point of intersection, then label and shade the solution of f(x) < g(x) on the x-axis. Use setbuilder and interval notation to describe your solution set.
- Answer
-
The graph of f intersects the graph of g at x = 3. The solution of f(x) = g(x) is x = 3.
The graph of f lies above the graph of g to the right of x = 3. The solution of f(x) > g(x) is \((3,\infty) = \{x : x > 3\}\).
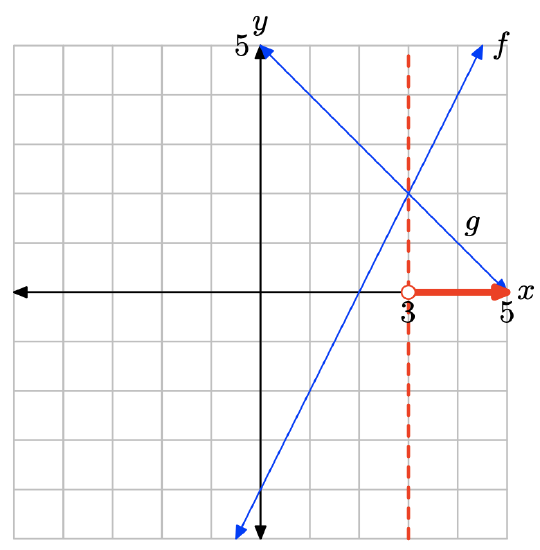
The graph of f lies below the graph of g to the left of x = 3. The solution of f(x) < g(x) is \((−\infty, 3) = \{x : x < 3\}\).
- Answer
-
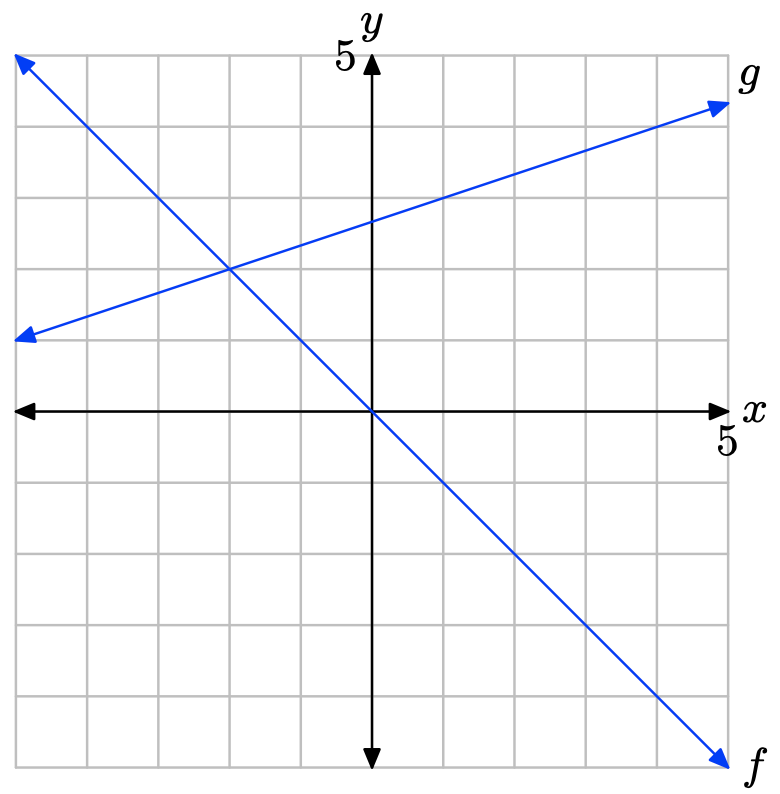
The graph of f intersects the graph of g at x = −2. The solution of f(x) = g(x) is x = −2.
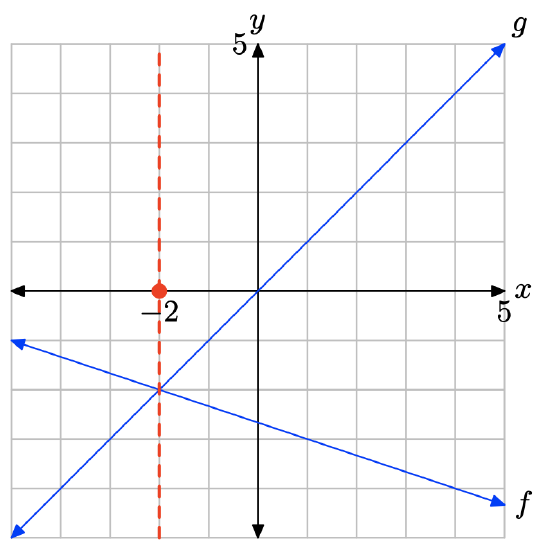
The graph of f lies above the graph of g to the left of x = −2. The solution of f(x) > g(x) is \((−\infty, −2) = \{x : x < −2\}\).
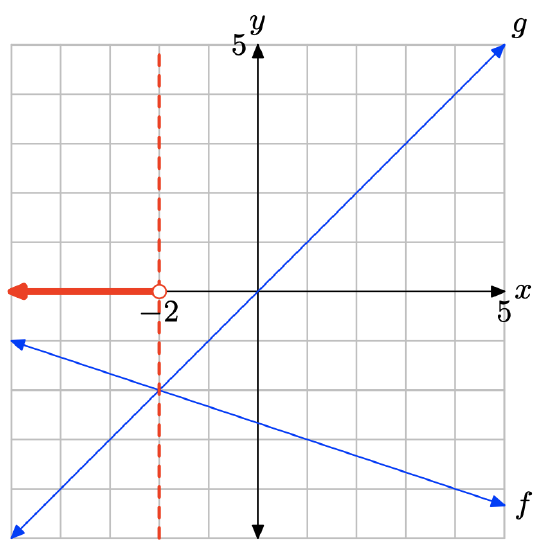
The graph of f lies below the graph of g to the right of x = −2. The solution of f(x) < g(x) is \((−2,\infty) = {\x : x > −2\}\).
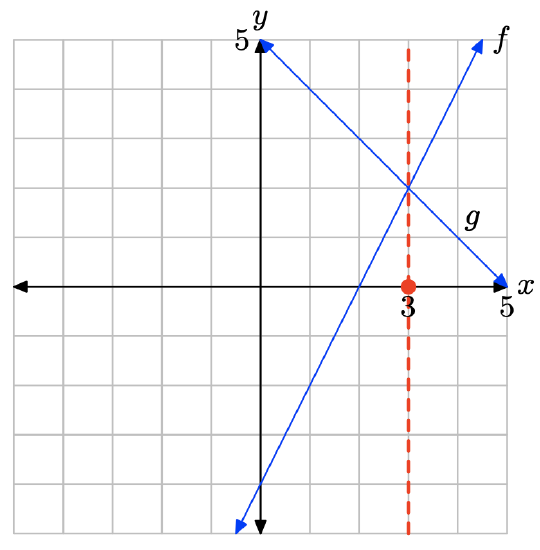
- Answer
-
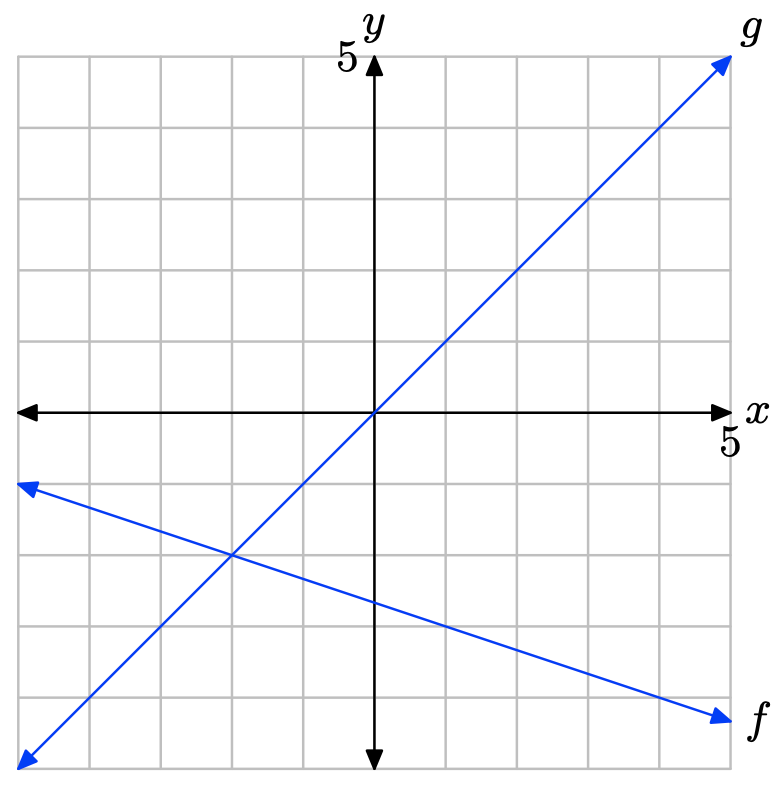
The graph of f intersects the graph of g at x = 3. The solution of f(x) = g(x) is x = 3.
The graph of f is above the graph of g to the right of x = 3. The solution of f(x) > g(x) is \((3,\infty) = \{x : x > 3\}\).
The graph of f is below the graph of g to the left of x = 3. The solution of f(x) < g(x) is \((−\infty, 3) = \{x : x < 3\}\).
In Exercises \(\PageIndex{13}\)-\(\PageIndex{16}\), perform each of the following tasks. Remember to use a ruler to draw all lines.
i. Make an accurate copy of the image on graph paper, drop dashed, vertical lines through the points of intersection, then label and shade the solution of \(f(x) \geq g(x)\) on the x-axis. Use set-builder and interval notation to describe your solution set.
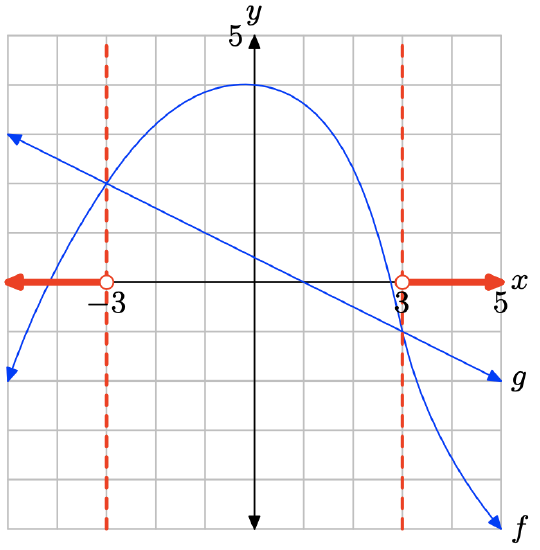
ii. Make a second copy of the image on graph paper, drop dashed, vertical lines through the points of intersection, then label and shade the solution of f(x) < g(x) on the x-axis. Use set-builder and interval notation to describe your solution set.
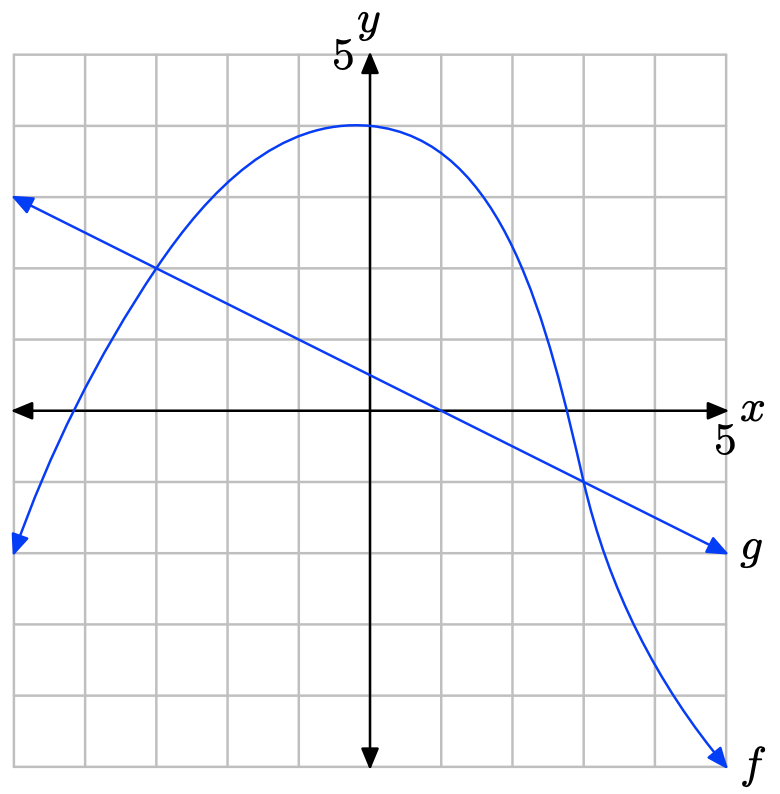
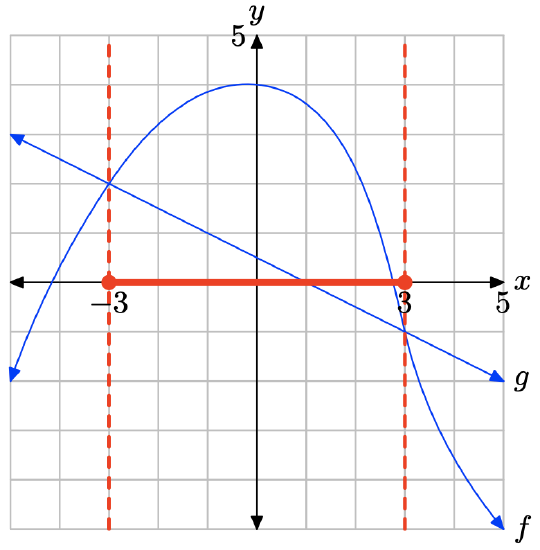
- Answer
-
The graph of f intersects the graph of g at x = −3 and x = 3. The graph of f lies above the graph of g for values of x that lie between −3 and 3. Therefore, the solution of \(f(x) \geq g(x)\) is \([−3, 3] = \{x : −3 \leq x \leq 3\}\).
The graph of f is below the graph of g for values of x that lie to the left of −3 or to the right of 3. Therefore, the solution of f(x) < g(x) is \((−\infty, −3) \cup (3,\infty)\) or \(\{x : x < −3 or x > 3\}\).
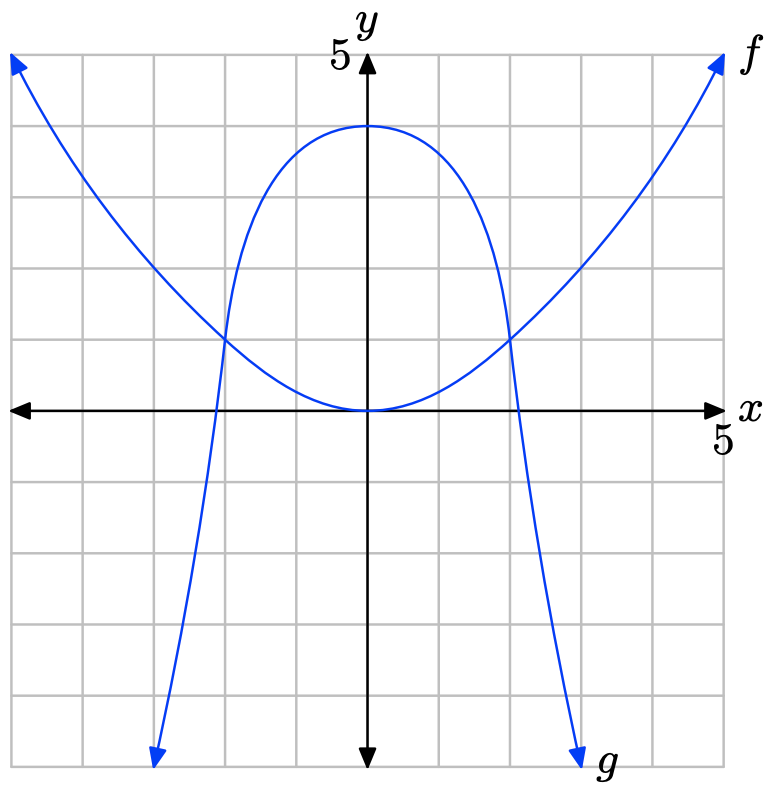
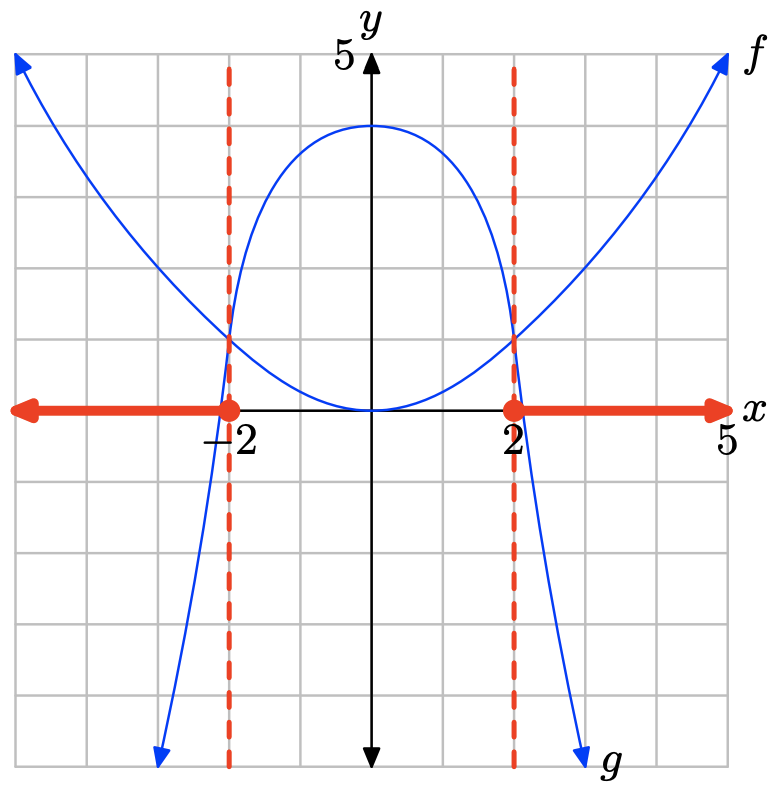
- Answer
-
The graph of f intersects the graph of g at x = −2 and at x = 2. The graph of f lies above the graph of g for all values of x that lie to the left of −2 or to the right of 2. Therefore, the solution of \(f(x) \geq g(x)\) is \((−\infty, −2] \cup [2,\infty)\) or \(\{x : x \leq −2 or x \geq 2\}\).
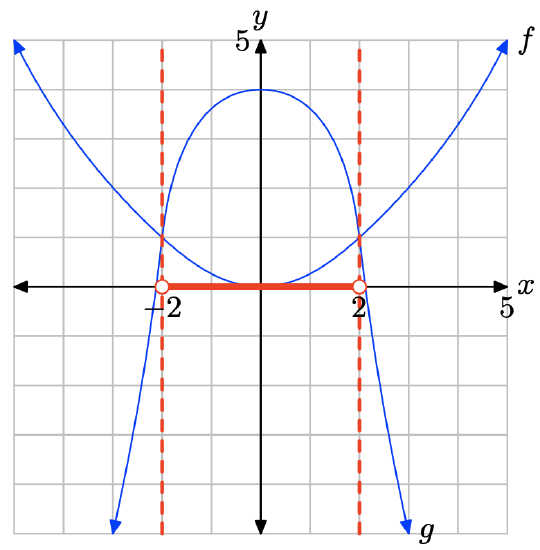
The graph of f lies below the graph of g for values of x that lie between −2 and 2. Therefore, the solution of f(x) < g(x) is \((−2, 2) = \{x : −2 < x < 2\}\).
In Exercises \(\PageIndex{17}\)-\(\PageIndex{20}\), perform each of the following tasks. Remember to use a ruler to draw all lines.
i. Load each side of the equation into the Y= menu of your calculator. Adjust the WINDOW parameters so that the point of intersection of the graphs is visible in the viewing window. Use the intersect utility in the CALC menu of your calculator to determine the x-coordinate of the point of intersection.
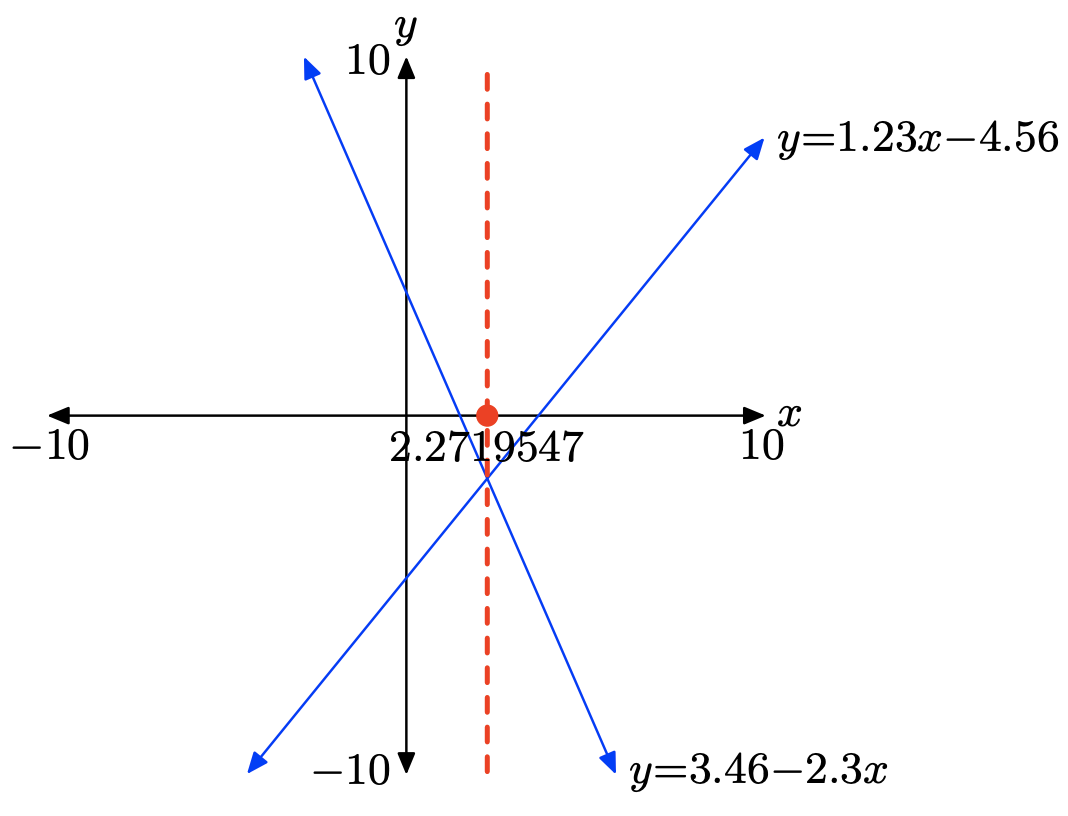
ii. Make an accurate copy of the image in your viewing window on your homework paper. Label and scale each axis with xmin, xmax, ymin, and ymax, and label each graph with its equation.
iii. Draw a dashed, vertical line through the point of intersection. Shade and label the solution of the equation on the x-axis.
1.23x − 4.56 = 3.46 − 2.3x
- Answer
-
To solve the equation 1.23x − 4.56 = 3.46 − 2.3x graphically, start by loading the left- and right-hand sides of the equation into Y1 and Y2, respectively, as shown in (a). Use the intersect utility in the CALC menu to determine the point of intersection, as shown in (c).
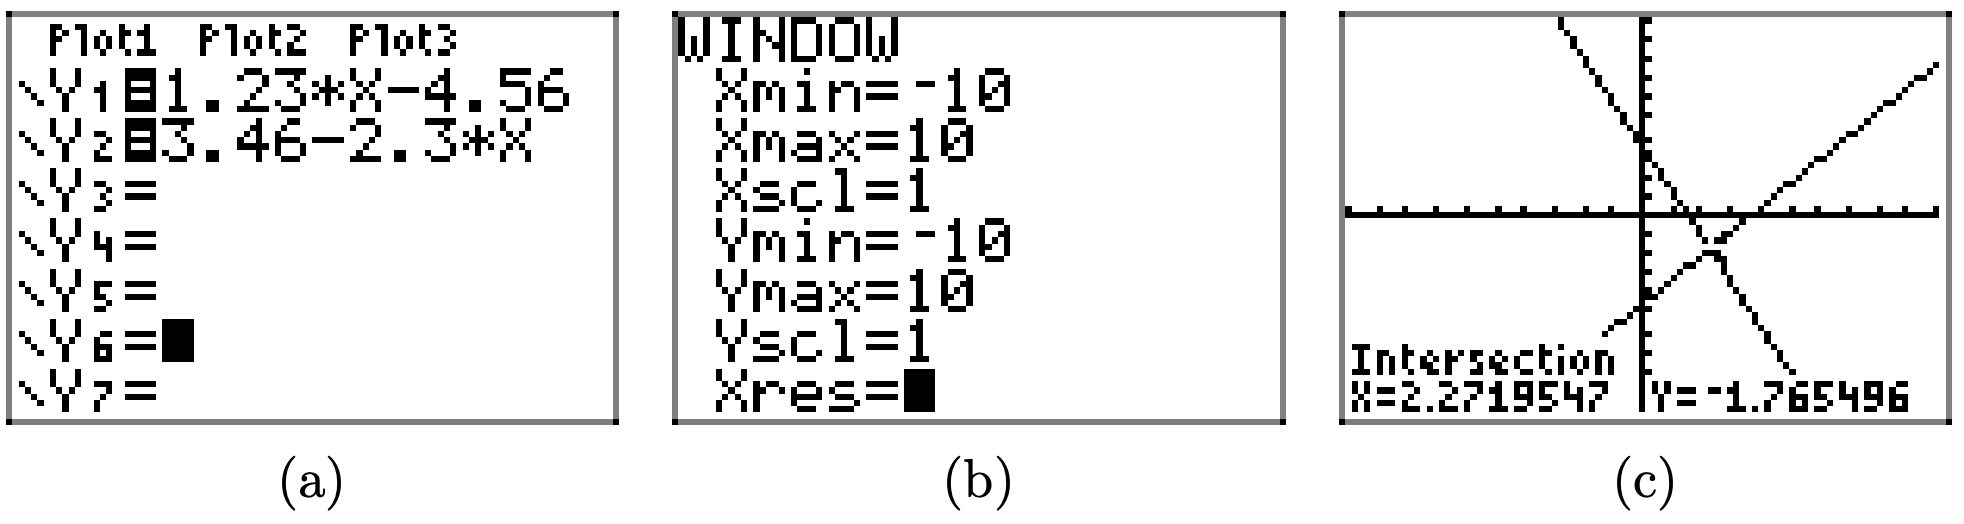
Therefore, the solution of the equation is x = 2.2719547, which is shaded on the x-axis in the image that follows. Answers may vary due to roundoff error.
2.23x − 1.56 = 5.46 − 3.3x
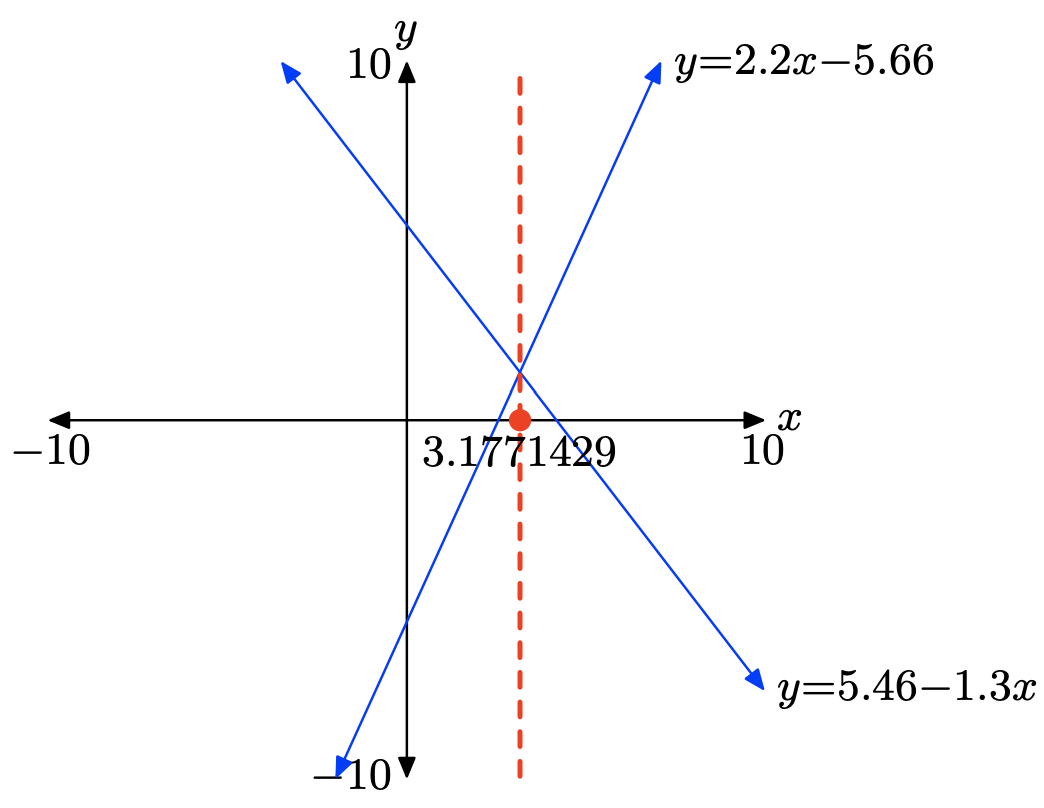
5.46 − 1.3x = 2.2x − 5.66
- Answer
-
To solve the equation 5.46 − 1.3x = 2.2x − 5.66 graphically, start by loading the left- and right-hand sides of the equation into Y1 and Y2, respectively, as shown in (a). Use the intersect utility in the CALC menu to determine the point of intersection, as shown in (c).
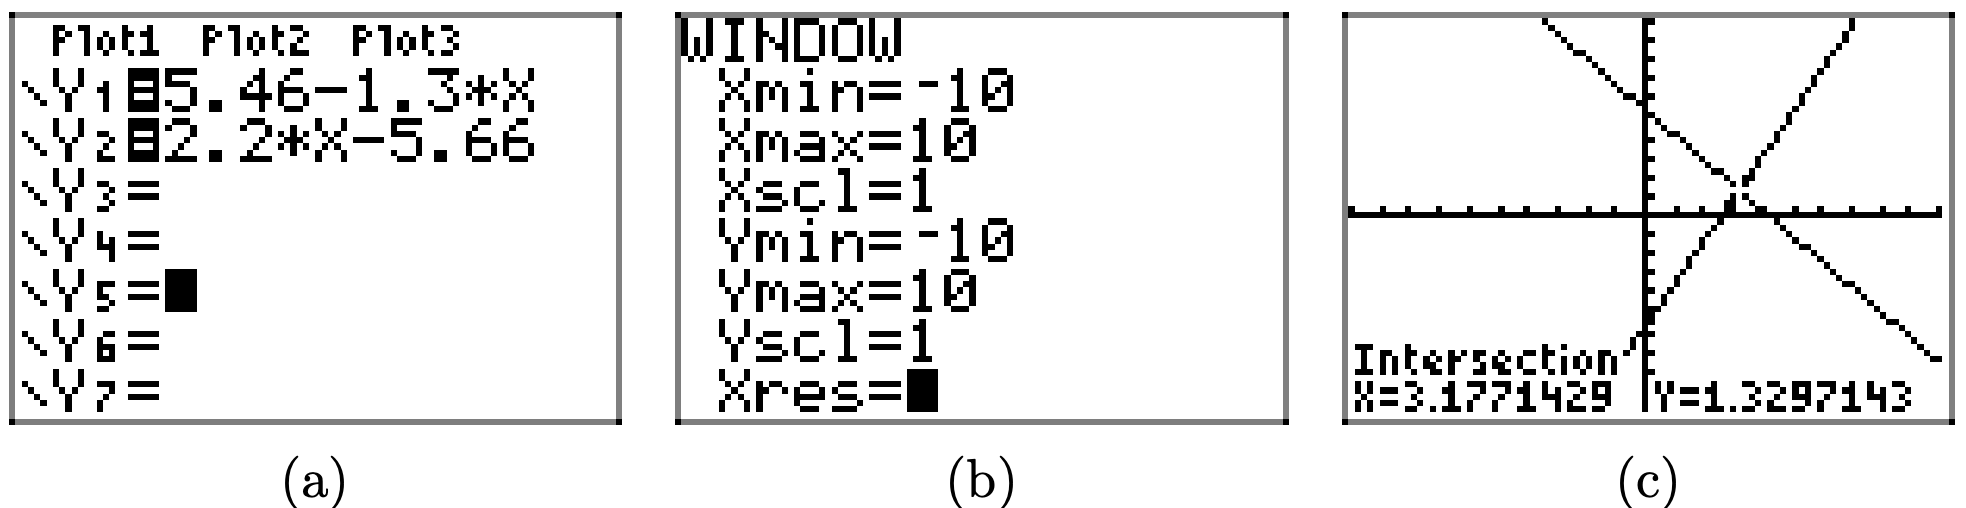
Therefore, the solution of the equation is x = 3.1771429, which is shaded on the x-axis in the image that follows. Answers may vary due to roundoff error.
2.46 − 1.4x = 1.2x − 2.66
In Exercises \(\PageIndex{21}\)-\(\PageIndex{26}\), perform each of the following tasks. Remember to use a ruler to draw all lines.
i. Load each side of the inequality into the Y= menu of your calculator. Adjust the WINDOW parameters so that the point(s) of intersection of the graphs is visible in the viewing window. Use the intersect utility in the CALC menu of your calculator to determine the coordinates of the point(s) of intersection.
ii. Make an accurate copy of the image in your viewing window on your homework paper. Label and scale each axis with xmin, xmax, ymin, and ymax, and label each graph with its equation.
iii. Draw a dashed, vertical line through the point(s) of intersection. Shade and label the solution of the inequality on the x-axis. Use both set-builder and interval notation to describe the solution set.
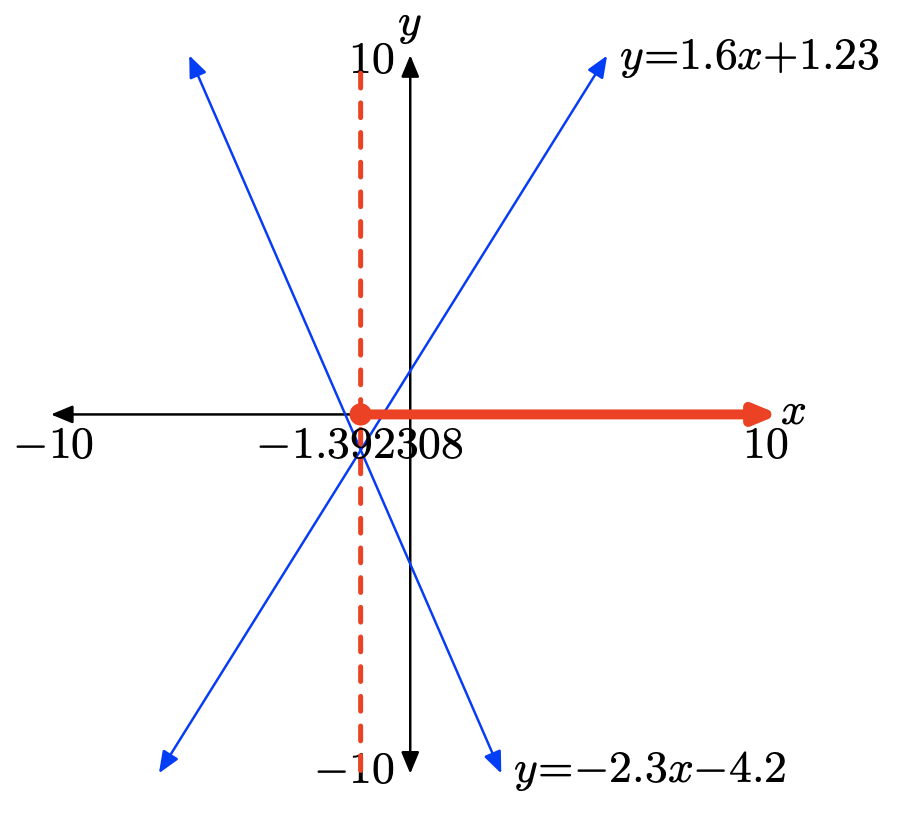
\(1.6x + 1.23 \geq −2.3x − 4.2\)
- Answer
-
To solve the inequality \(1.6x+1.23 \geq −2.3x−4.2\) graphically, start by loading the left- and right-hand sides of the inequality into Y1 and Y2, respectively, as shown in (a). Use the intersect utility in the CALC menu to determine the point of intersection, as shown in (c).
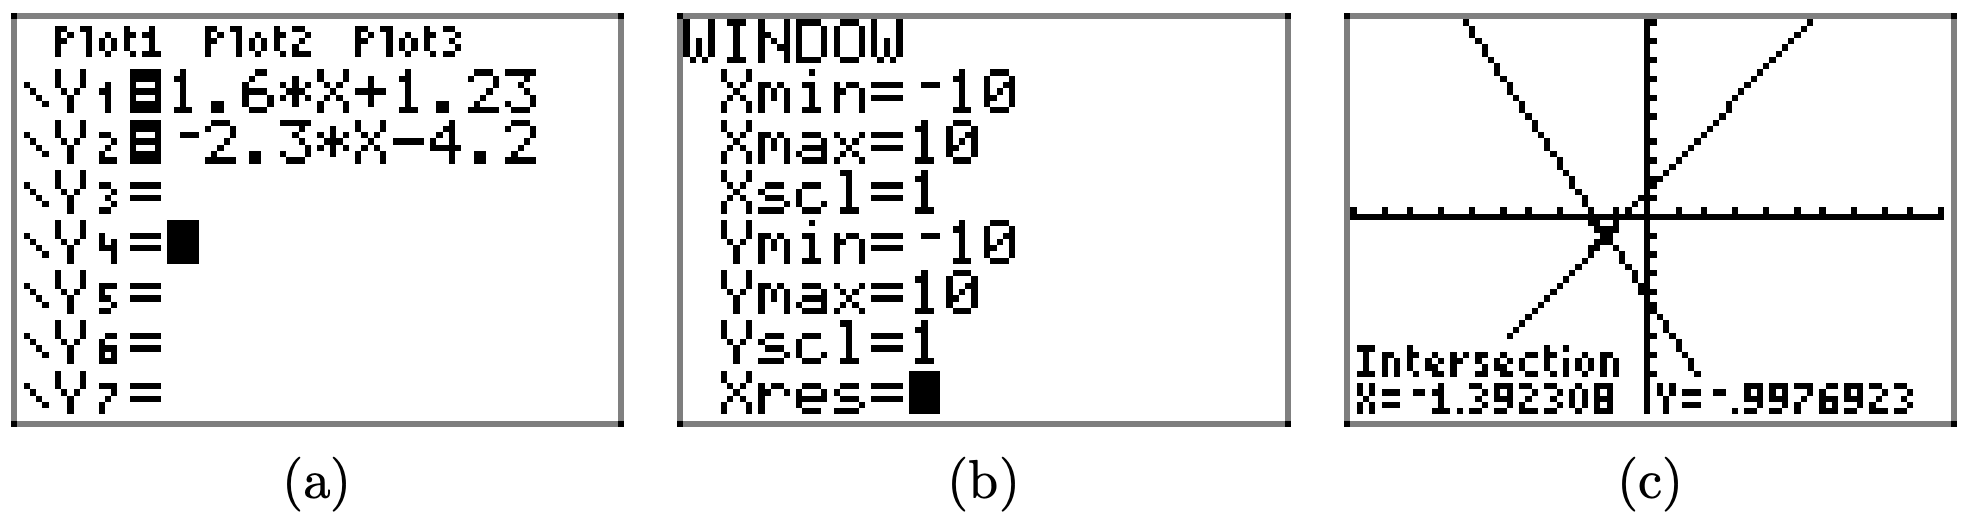
The two graphs intersect at x = −1.392308. The graph of y = 1.6x + 1.23 is above the graph of y = −2.3x−4.2 for all values of x that lie to the right of −1.392308. Therefore, the solution of \(1.6x + 1.23 \geq −2.3x − 4.2\) is \([−1.392308,\infty) = \{x : x \geq −1.392308\}\).
1.24x + 5.6 < 1.2 − 0.52x
0.15x − 0.23 > 8.2 − 0.6x
- Answer
-
To solve the inequality 0.15x − 0.23 > 8.2 − 0.6x graphically, start by loading the left- and right-hand sides of the inequality into Y1 and Y2, respectively, as shown in (a). Adjust the viewing window as shown in (b). Use the intersect utility in the CALC menu to determine the point of intersection, as shown in (c).
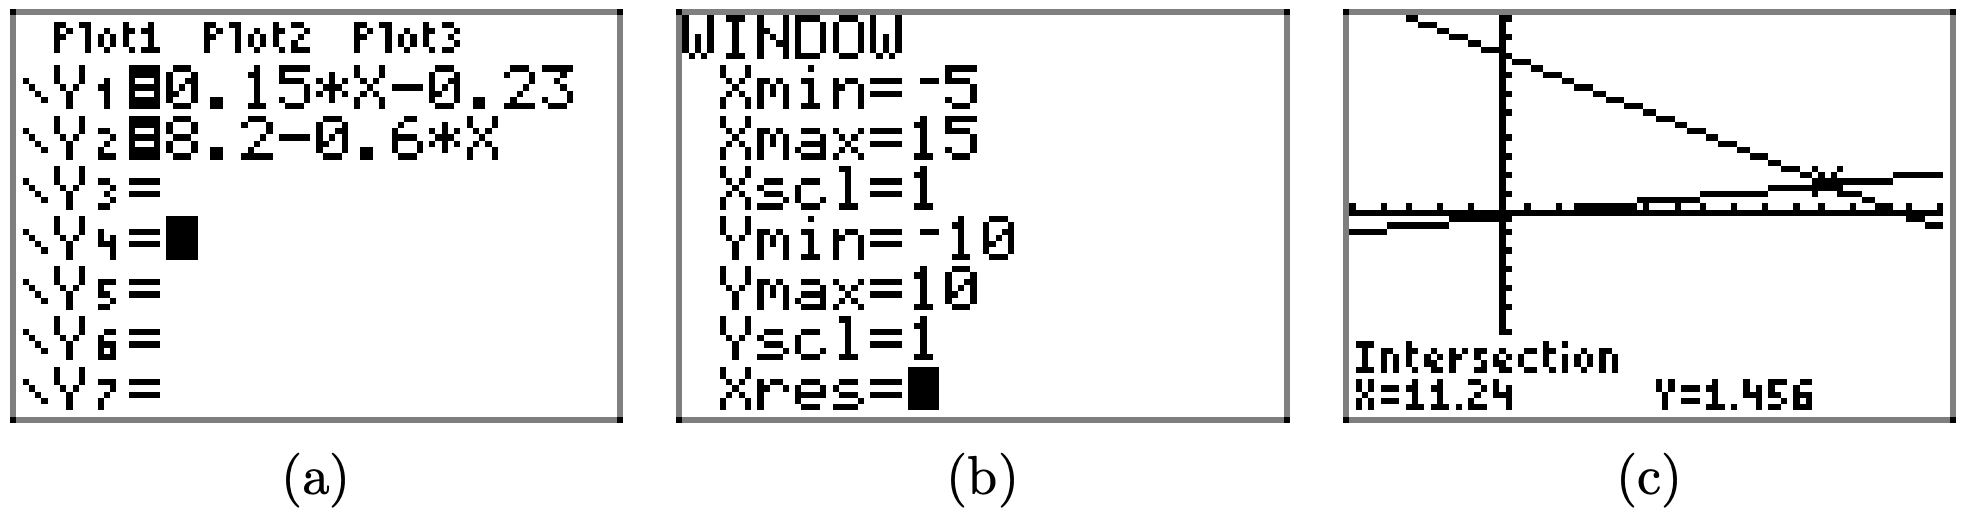
The graph of y = 0.15x − 0.23 is above the graph of y = 8.2 − 0.6x for all values of x that lie to the right of 11.24. Therefore, the solution of 0.15x − 0.23 > 8.2 − 0.6x is \((11.24,\infty) = \{x : x > 11.24\}\)

\(−1.23x − 9.76 \leq 1.44x + 22.8\)
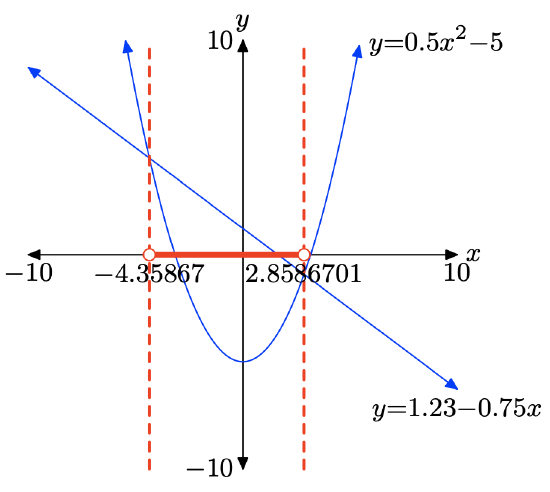
\(0.5x^2 − 5 < 1.23 − 0.75x\)
- Answer
-
To solve the inequality \(0.5x^2 − 5 < 1.23 − 0.75x\) graphically, start by loading the left- and right-hand sides of the inequality into Y1 and Y2, respectively, as shown in (a). Use the intersect utility in the CALC menu to determine the points of intersection, as shown in (b) and (c).
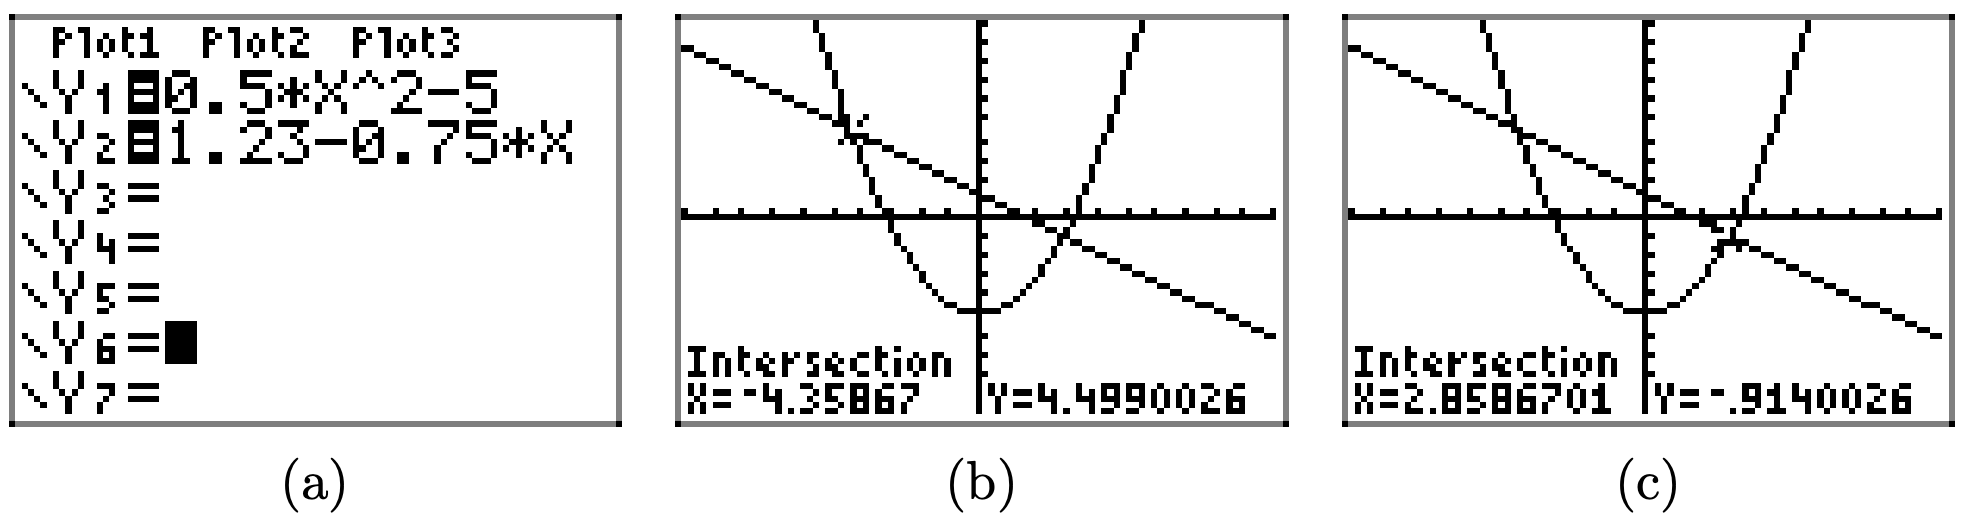
The graph of y = 0.5x2−5 is below the graph of y = 1.23−0.75x for all values of x that lie between −4.35867 and 2.8586701. Therefore, the solution of \(0.5x^2−5 < 1.23−0.75x\) is (−4.35867, 2.8586701) or {x : −4.35867 < x < 2.8586701}.
\(4 − 0.5x^2 \leq 0.72x − 1.34\)
In Exercises \(\PageIndex{27}\)-\(\PageIndex{30}\), perform each of the following tasks. Remember to use a ruler to draw all lines.
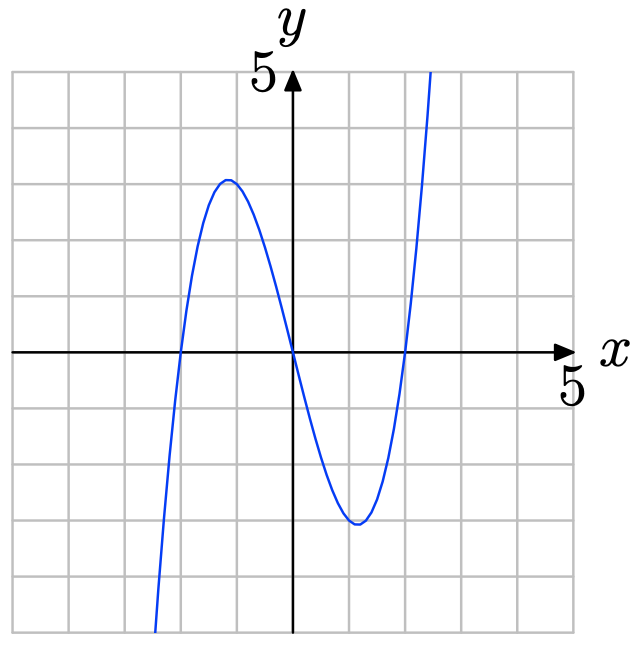
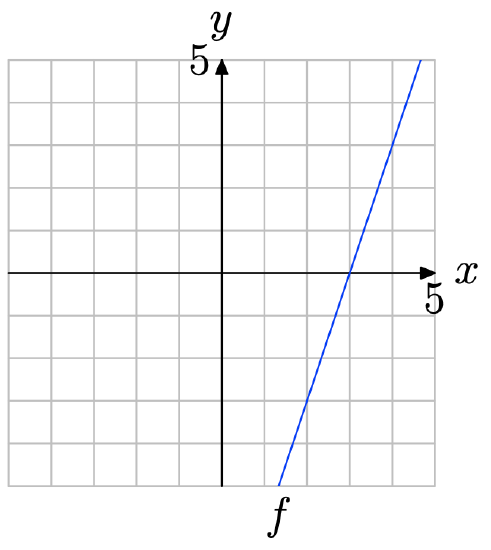
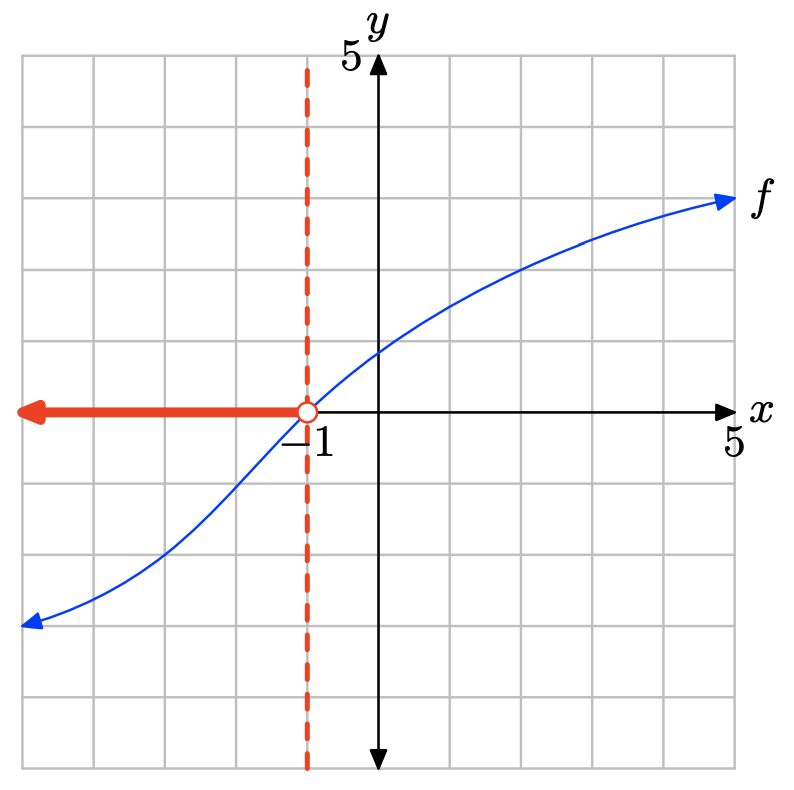
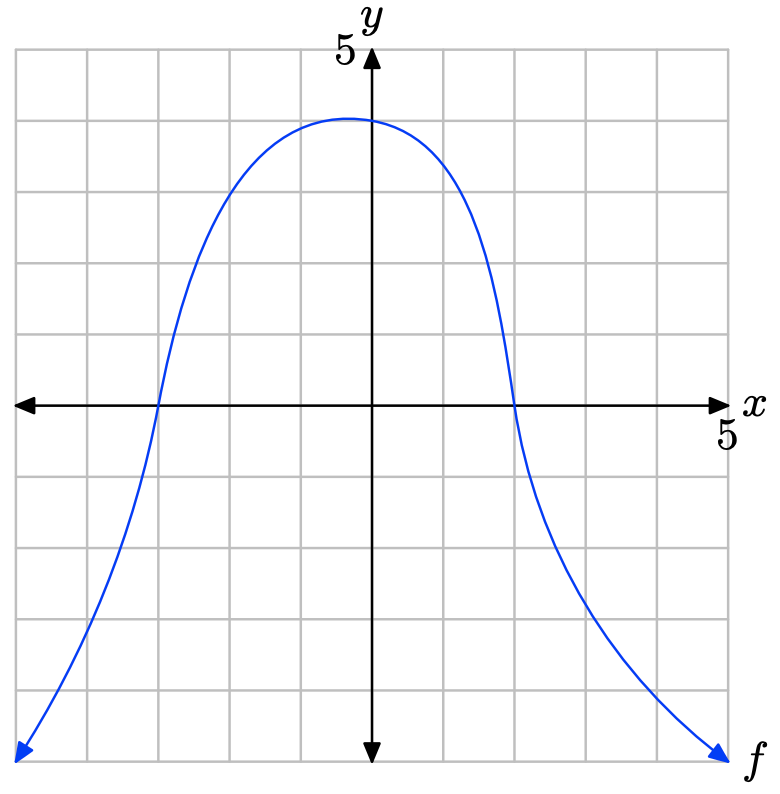
i. Make an accurate copy of the image on graph paper (label the graph with the letter f and label and scale each axis), drop a dashed vertical line through the x-intercept of the graph of f, then label and shade the solution of f(x) = 0 on the x-axis. Use set-builder notation to describe your solution.
ii. Make a second copy of the image on graph paper, drop a dashed, vertical line through the x-intercept of the graph of f, then label and shade the solution of f(x) > 0 on the x-axis. Use set-builder and interval notation to describe your solution set.
iii. Make a third copy of the image on graph paper, drop a dashed, vertical line through the x-intercept of the graph of f, then label and shade the solution of f(x) < 0 on the x-axis. Use set-builder and interval notation to describe your solution set.
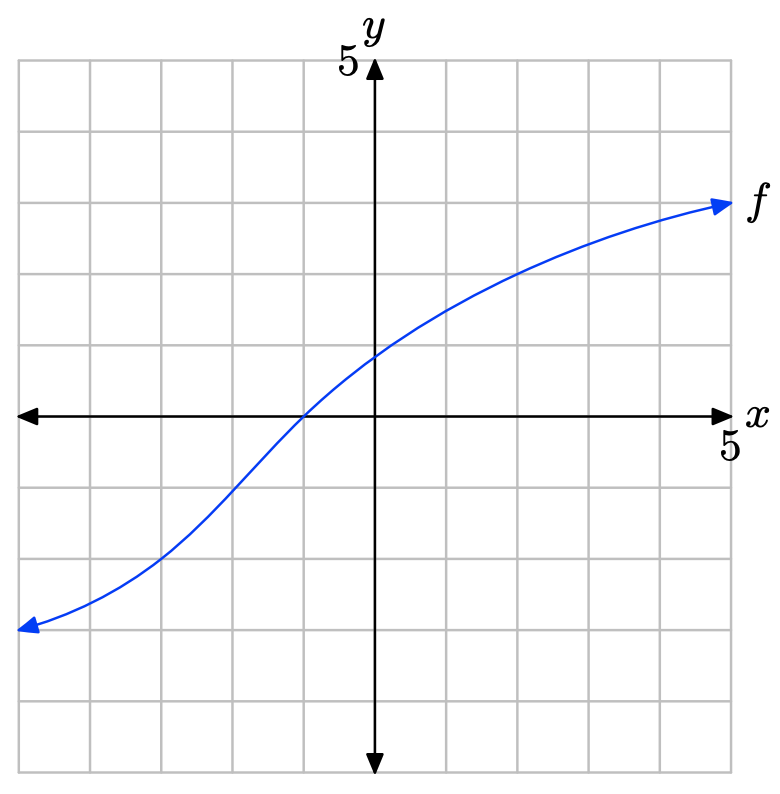
- Answer
-
The graph of f intercepts the x-axis at x = −1. Therefore, the solution of f(x) = 0 is x = −1.
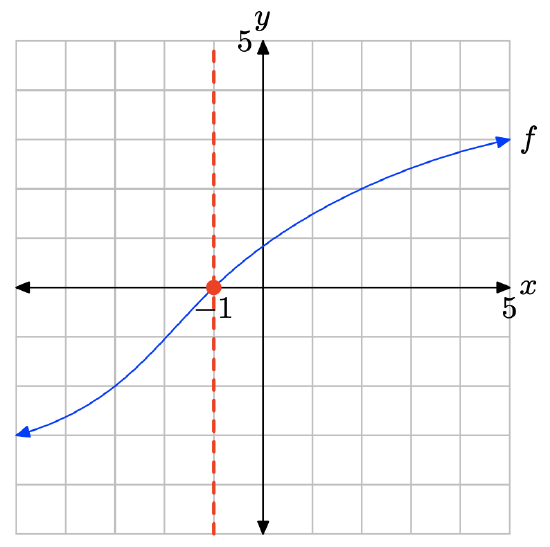
The graph of f lies above the x-axis for all values of x that lie to the right of −1. Therefore, the solution of f(x) > 0 is \((−1,\infty) = \{x : x > −1\}\).
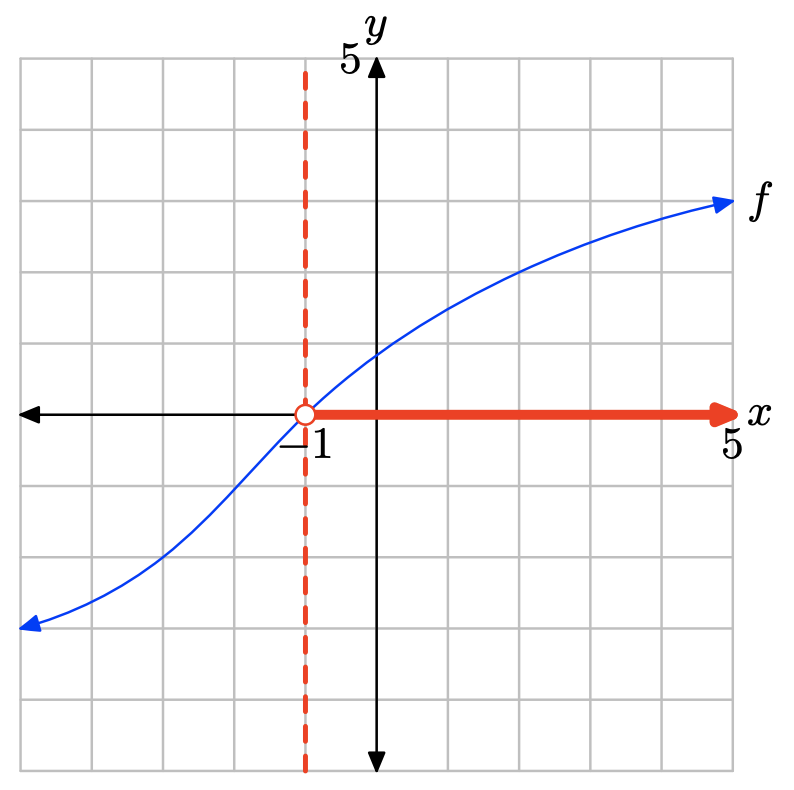
The graph of f lies below the x-axis for all values of x that lie to the left of −1. Therefore, the solution of f(x) < 0 is \((−\infty, −1) = \{x : x < −1\}\)
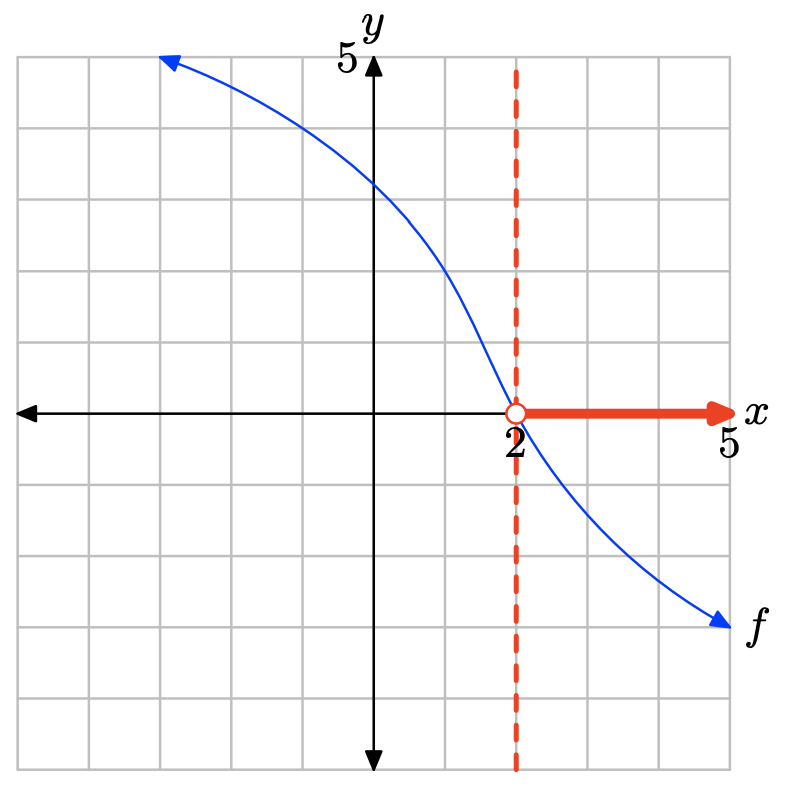
- Answer
-
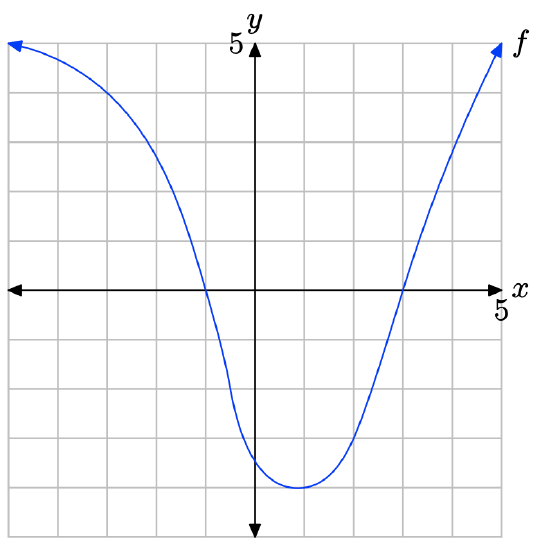
The graph of f intercepts the x-axis at x = 2. Therefore, the solution of f(x) = 0 is x = 2.
The graph of f lies above the x-axis for all values of x that lie to the left of x = 2. Therefore, the solution of f(x) > 0 is \((−\infty, 2) = \{x : x < 2\}\).
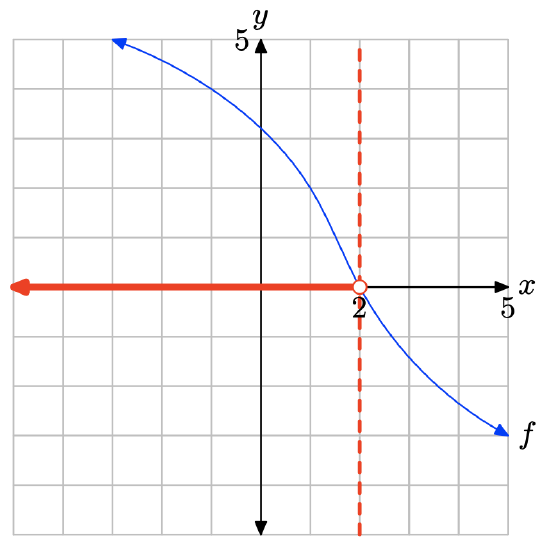
The graph of f lies below the x-axis for all values of x that lie to the right of x = 2. Therefore, the solution of f(x) < 0 is \((2,\infty) = \{x : x > 2\}\)
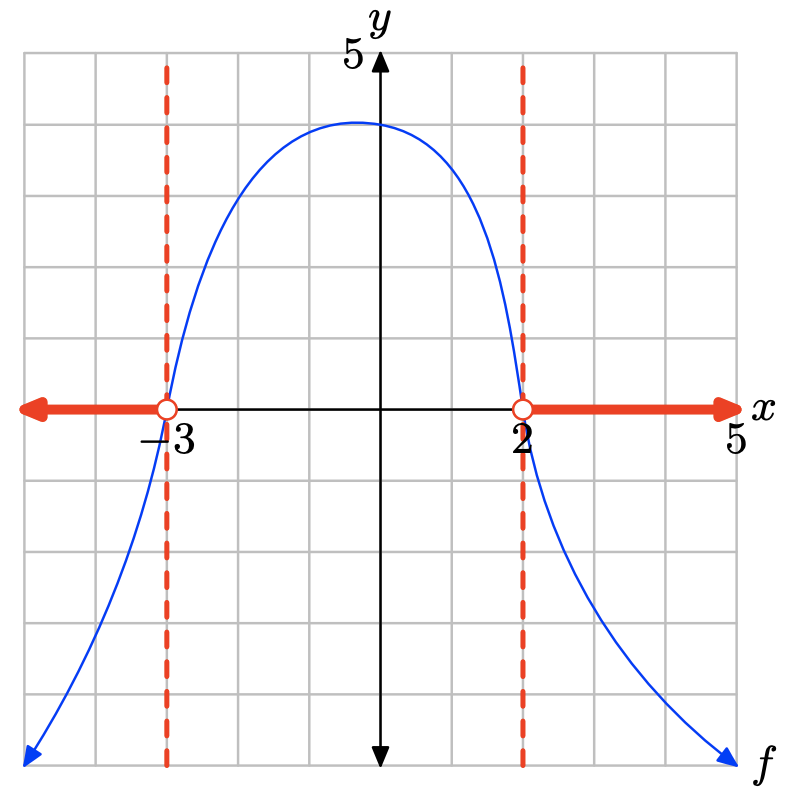
In Exercises \(\PageIndex{31}\)-\(\PageIndex{34}\), perform each of the following tasks. Remember to use a ruler to draw all lines.
i. Make an accurate copy of the image on graph paper, drop dashed, vertical lines through the x-intercepts, then label and shade the solution of \(f(x) \geq 0\) on the x-axis. Use set-builder and interval notation to describe your solution set.
ii. Make a second copy of the image on graph paper, drop dashed, vertical lines through the x-intercepts, then label and shade the solution of f(x) < 0 on the x-axis. Use set-builder and interval notation to describe your solution set.
- Answer
-
The graph of f intercepts the x-axis at x = −3 and x = 2. The graph of f lies above the x-axis for all values of x that lie between x = −3 and x = 2. Therefore, the solution of \(f(x) \geq 0\) is \([−3, 2] = \{x : −3 \leq x \leq 2\}\).
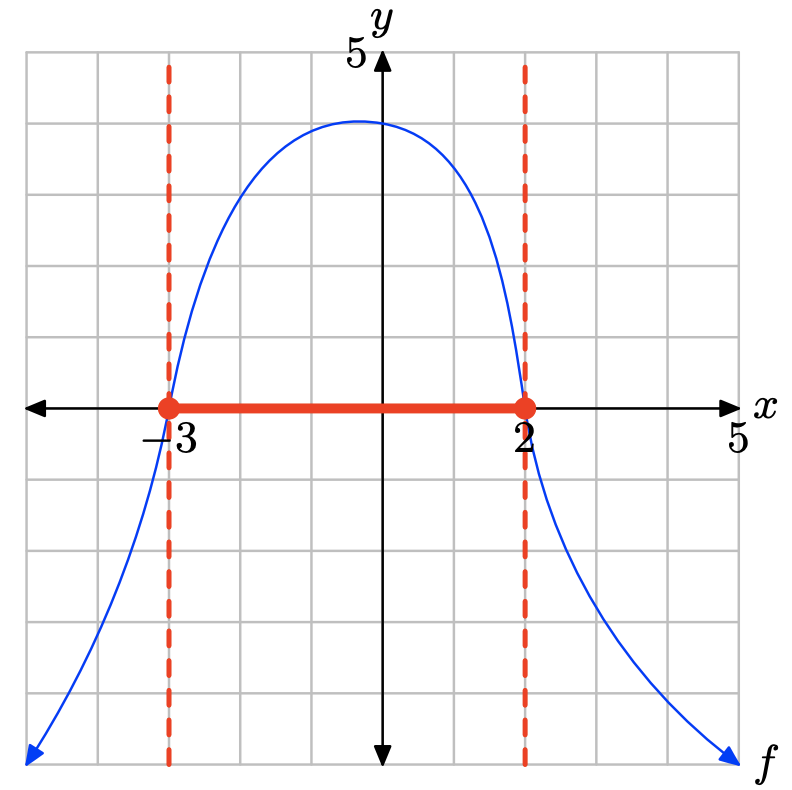
The graph of f lies below the x-axis for all values of x that lie to the left of x = −3 or to the right of x = 2. Therefore, the solution of f(x) < 0 is \((−\infty, −3) \cup (2,\infty) = \{x : x < −3 or x > 2\}\).
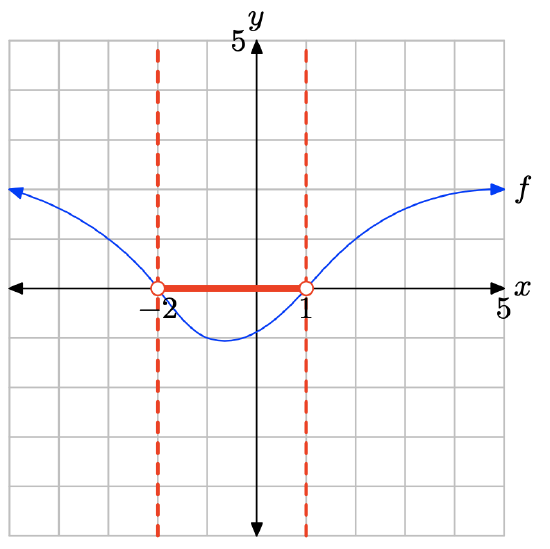
- Answer
-
The graph of f intercepts the x-axis at x = −2 and x = 1. The graph of f lies above the x-axis for all values of x that lie to the left x = −2 or to the right of x = 1. Therefore, the solution of \(f(x) \geq 0\) is \((−\infty, −2] \cup [1,\infty) = \{x : x \leq −2 or x \geq 1\}\).
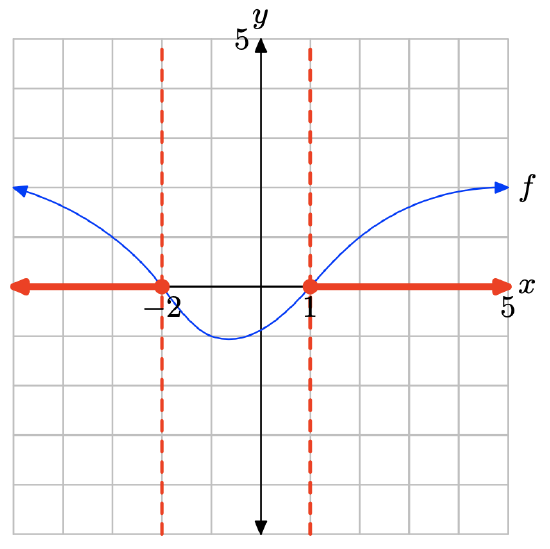
The graph of f lies below the x-axis for all values of x that lie between x = −2 and x = 1. Therefore, the solution of f(x) < 0 is \((−2, 1) = \{x : −2 < x < 1\}\).
In Exercises \(\PageIndex{35}\)-\(\PageIndex{38}\), perform each of the following tasks. Remember to use a ruler to draw all lines.
i. Load the given function f into the Y= menu of your calculator. Adjust the WINDOW parameters so that the x-intercept(s) of the graph of f is visible in the viewing window. Use the zero utility in the CALC menu of your calculator to determine the coordinates of the x-intercept(s) of the graph of f.
ii. Make an accurate copy of the image in your viewing window on your homework paper. Label and scale each axis with xmin, xmax, ymin, and ymax, and label the graph with its equation.
iii. Draw a dashed, vertical line through the x-intercept(s). Shade and label the solution of the inequality f(x) > 0 on the x-axis. Use both set-builder and interval notation to describe the solution set.
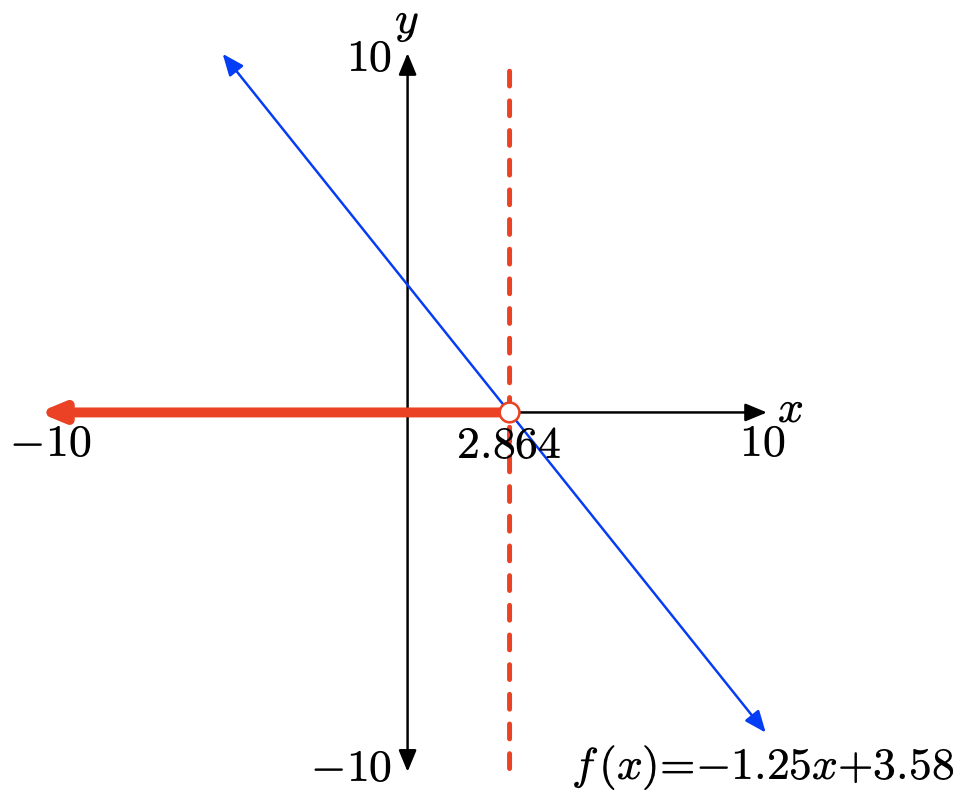
f(x) = −1.25x + 3.58
- Answer
-
To solve the inequality f(x) > 0 graphically, start by loading f(x) = −1.25x+3.58 into Y1. Use the zero utility in the CALC menu to determine the zero of f, as shown in (c).
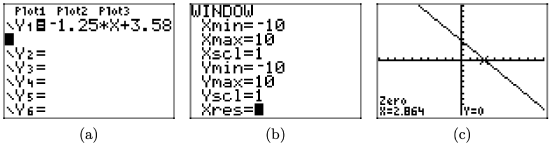
The graph of f lies above the x-axis for all values of x that lie to the left of x = 2.864. Therefore, the solution of f(x) > 0 is \((−\infty, 2.864) = \{x : x < 2.864\}\). Answers may vary due to round-off error.
f(x) = 1.34x − 4.52
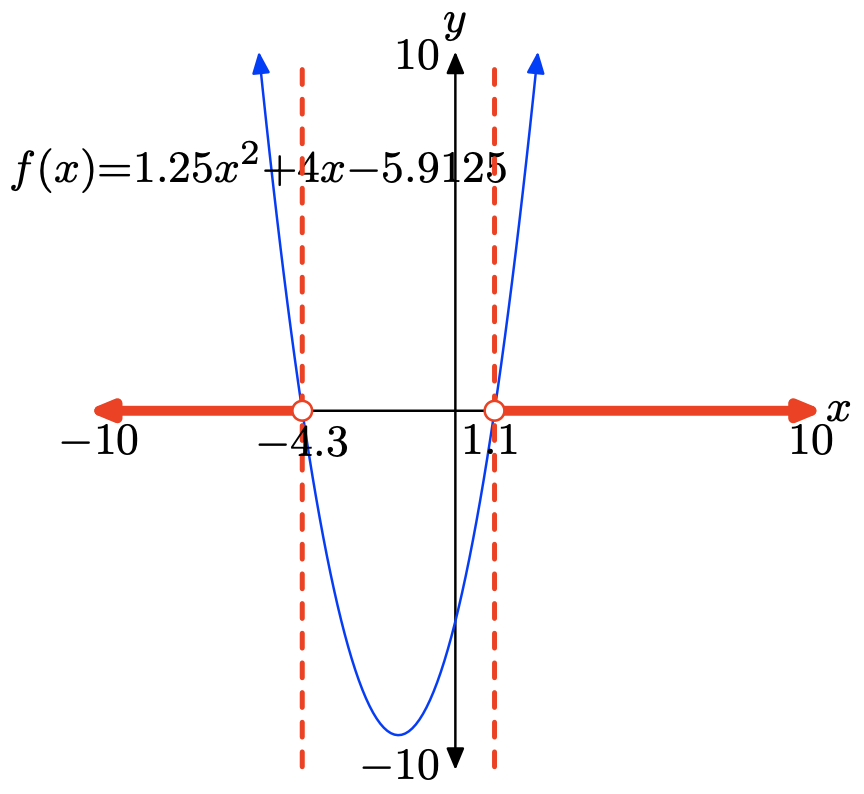
\(f(x) = 1.25x^2 + 4x − 5.9125\)
- Answer
-
To solve the inequality f(x) > 0 graphically, start by loading \(f(x) = 1.25x^2 + 4x − 5.9125\) into Y1. Use the zero utility in the CALC menu to determine the zeros of f, as shown in (b) and (c).
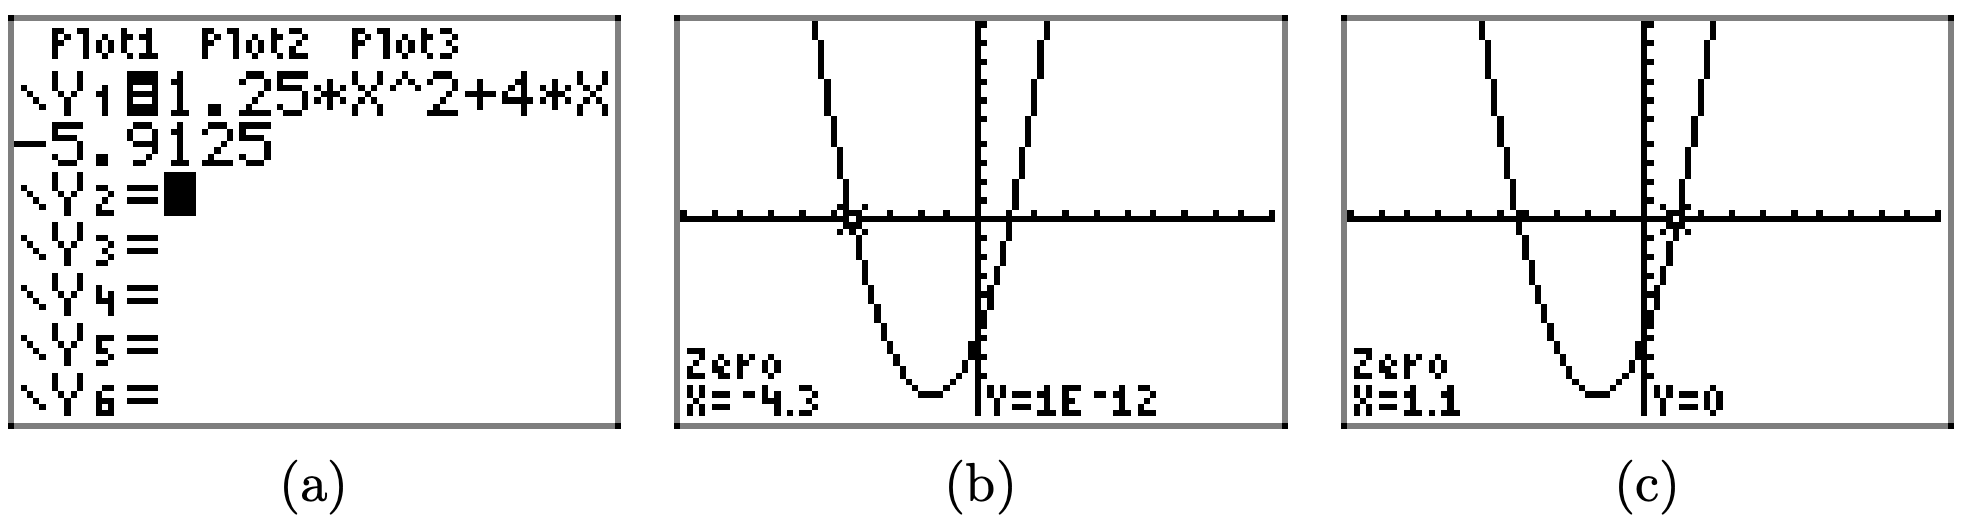
The graph of f lies above the x-axis for all values of x that lie to the left of x = −4.3 or to the right of x = 1.1. Therefore, the solution of f(x) > 0 is \((−\infty, −4.3) \cup (1.1,\infty)\) or \(\{x : x < −4.3 or x > 1.1\}\). Answers may vary due to round-off error.
\(f(x) = −1.32x^2 − 3.96x + 5.9532\)
In Exercises \(\PageIndex{39}\)-\(\PageIndex{42}\), perform each of the following tasks. Remember to use a ruler to draw all lines.
i. Load the given function f into the Y= menu of your calculator. Adjust the WINDOW parameters so that the x-intercept(s) of the graph of f is visible in the viewing window. Use the zero utility in the CALC menu of your calculator to determine the coordinates of the x-intercept(s) of the graph of f.
ii. Make an accurate copy of the image in your viewing window on your homework paper. Label and scale each axis with xmin, xmax, ymin, and ymax, and label the graph with its equation.
iii. Draw a dashed, vertical line through the x-intercept(s). Shade and label the solution of the inequality \(f(x) \leq 0\) on the x-axis. Use both set-builder and interval notation to describe the solution set.
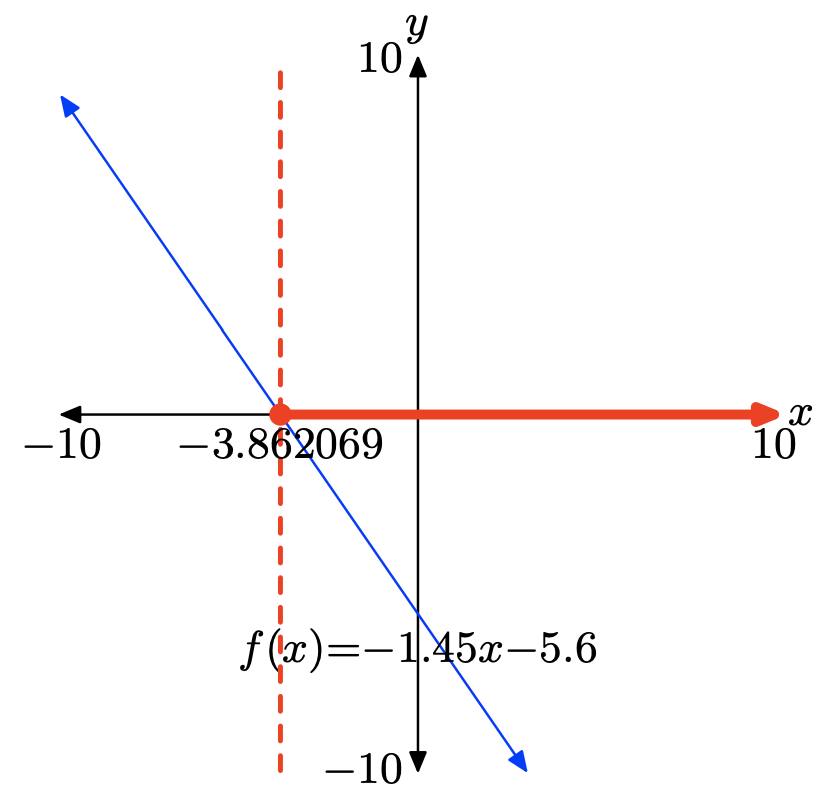
f(x) = −1.45x − 5.6
- Answer
-
To solve the inequality \(f(x) \leq 0\) graphically, start by loading f(x) = −1.45x−5.6 into Y1. Use the zero utility in the CALC menu to determine the zero of f, as shown in (c).
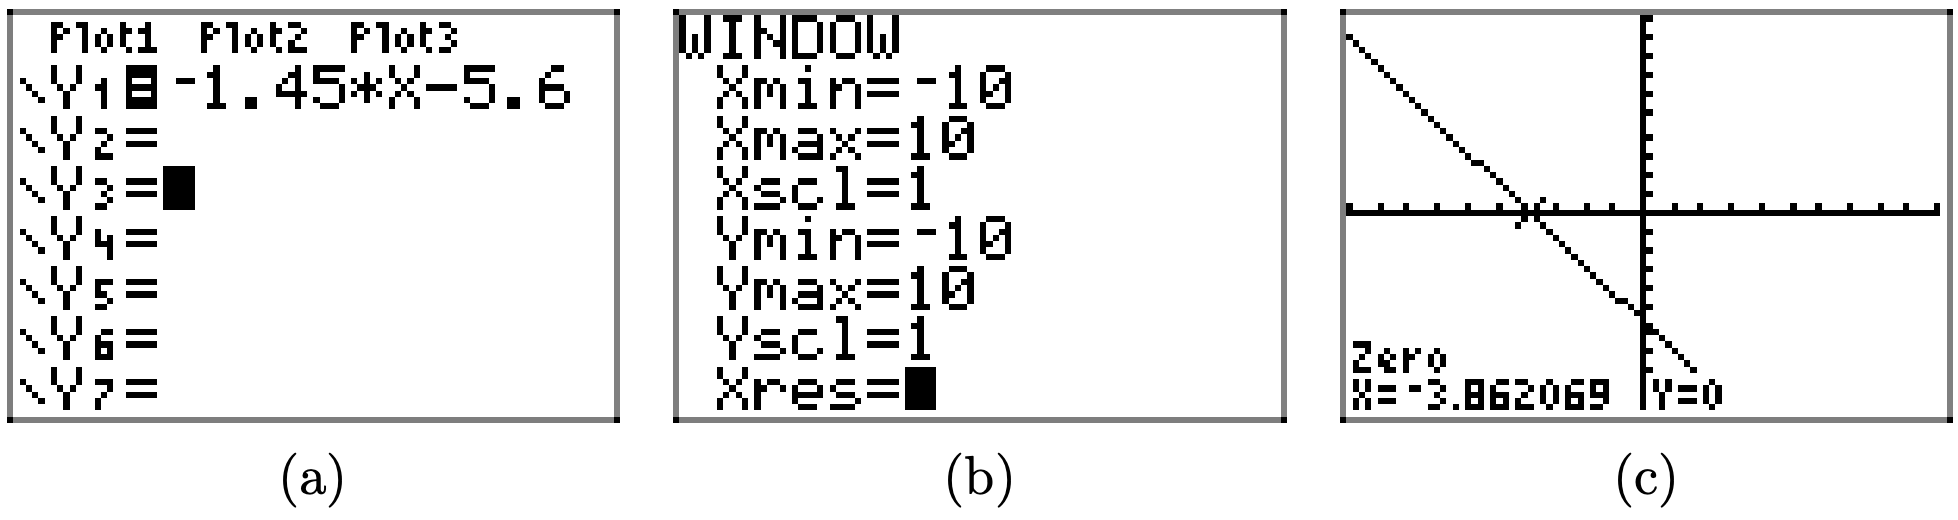
The graph of f intercepts the x-axis at x = −3.862069. The graph of f lies below the x-axis for all values of x that lie to the right of x = −3.862069. Therefore, the solution of \(f(x) \leq 0\) is \([−3.862069,\infty) = \{x : x \geq −3.862069\}\). Answers may vary due to roundoff error.
f(x) = 1.35x + 8.6
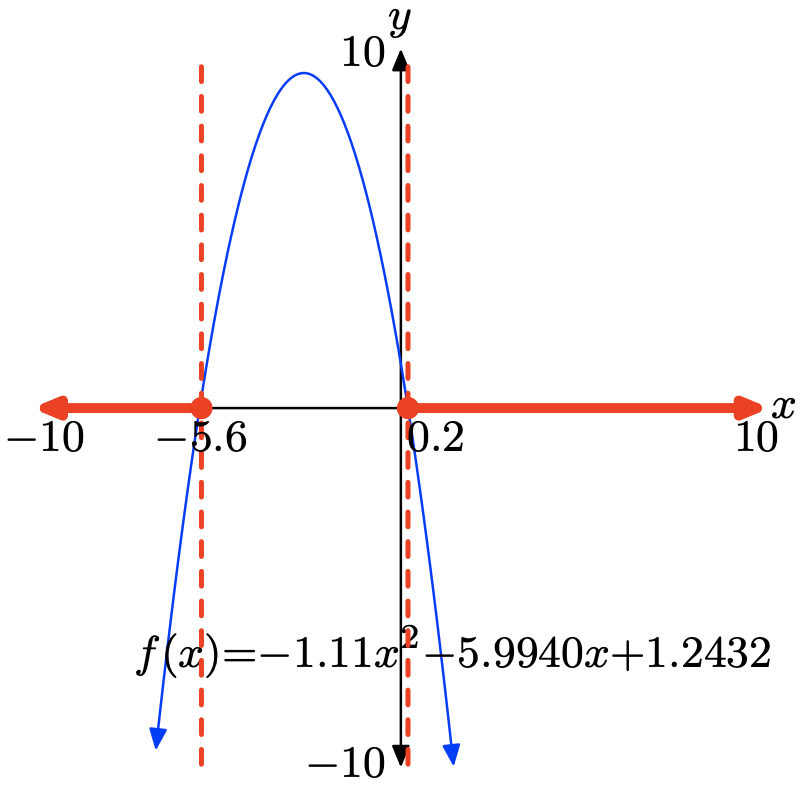
\(f(x) = −1.11x^2 −5.9940x+1.2432\)
- Answer
-
To solve the inequality \(f(x) \leq 0\) graphically, start by loading \(f(x) = −1.11x^2 − 5.9940x+1.2432\) into Y1. Use the zero utility in the CALC menu to determine the zeros of f, as shown in (b) and (c).
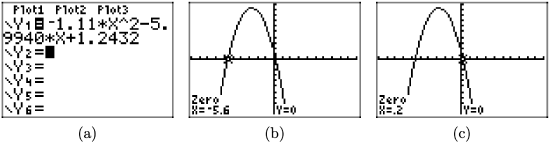
The graph of f intercepts the x-axis at x = −5.6 and x = 0.2. The graph of f lies below the x-axis for all values of x that lie to the left of x = −5.6 or to the right of x = 0.2. Therefore, the solution of \(f(x) \leq 0\) is \((−\infty, −5.6] \cup [0.2,\infty)\) or \(\{x : x \leq −5.6 or x \geq 0.2\}\). Answers may vary due to roundoff error.
\(f(x) = 1.22x^2 − 6.3440x + 1.3176\)
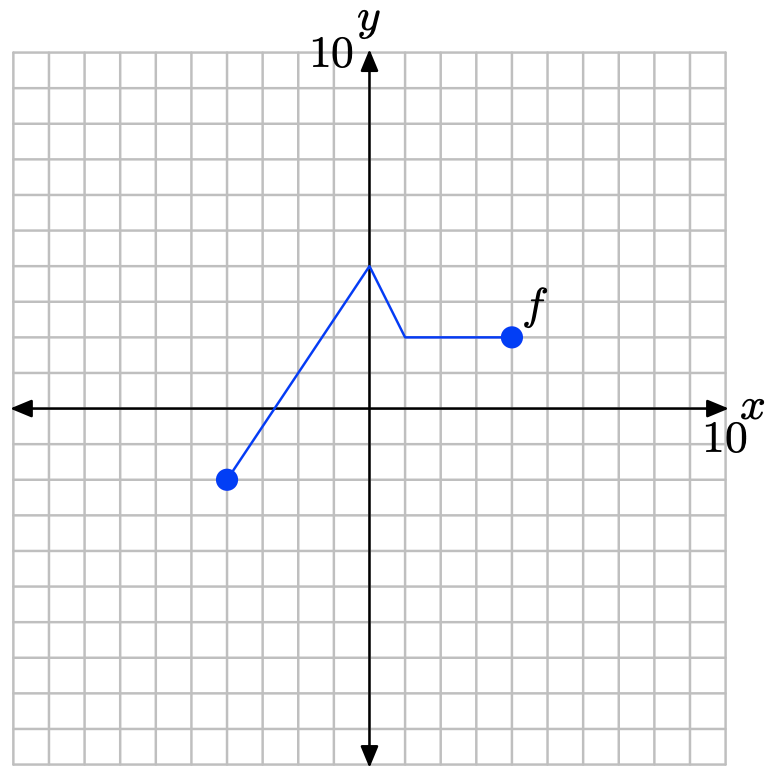
2.5 Exercises
Pictured below is the graph of a function f.
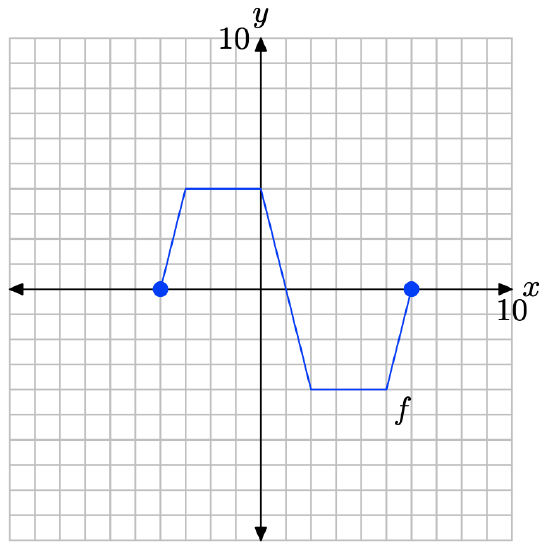
The table that follows evaluates the function f in the plot at key values of x. Notice the horizontal format, where the first point in the table is the ordered pair (−4, 0).
| x | -4 | -3 | 0 | 2 | 5 | 6 |
| f(x) | 0 | 4 | 4 | -4 | -4 | 0 |
Use the graph and the table to complete each of following tasks for Exercises \(\PageIndex{1}\) - \(\PageIndex{10}\).
i. Set up a coordinate system on graph paper. Label and scale each axis, then copy and label the original graph of f onto your coordinate system. Remember to draw all lines with a ruler.
ii. Use the original table to help complete the table for the given function in the exercise.
iii. Using a different colored pencil, plot the data from your completed table on the same coordinate system as the original graph of f. Use these points to help complete the graph of the given function in the exercise, then label this graph with its equation given in the exercise.
y= 2f(x).
| x | -4 | -3 | 0 | 2 | 5 | 6 |
| y |
- Answer
-
The original function table.
x -4 -3 0 2 5 6 f(x) 0 4 4 -4 -4 0
Evaluate the function y = 2f(x) at x = −4, −3, 0, 2, 5, and 6.
\[y= 2f(−4) = 2(0) = 0 \\ y = 2f(−3) = 2(4) = 8 \\ y = 2f(0) = 2(4) = 8 \\ y = 2f(2) = 2(−4) = −8 \\ y = 2f(5) = 2(−4) = −8 \\ y = 2f(6) = 2(0) = 0 \nonumber \]
Points satisfying y = 2f(x).
| x | -4 | -3 | 0 | 2 | 5 | 6 |
| y | 0 | 8 | 8 | -8 | -8 | 0 |
Plot the points in the table to get the graph of y = 2f(x).
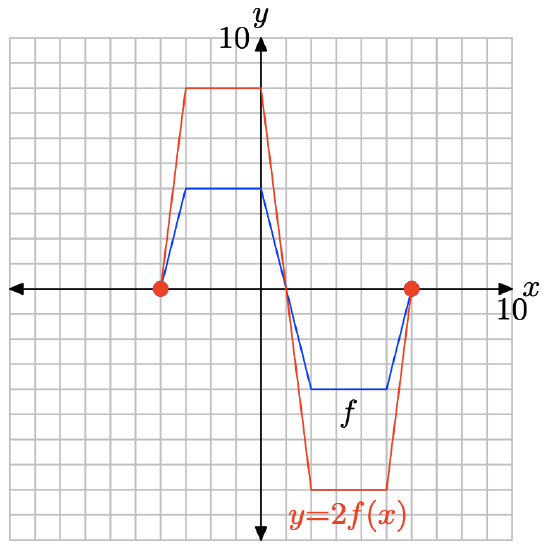
Note that multiplying by 2, as in y = 2f(x), stretches the graph of y = f(x) vertically by a factor of 2.
y = (1/2)f(x).
| x | -4 | -3 | 0 | 2 | 5 | 6 |
| y |
y = −f(x).
| x | -4 | -3 | 0 | 2 | 5 | 6 |
| y |
- Answer
-
The original function table.
x -4 -3 0 2 5 6 f(x) 0 4 4 -4 -4 0
Evaluate the function y = −f(x) at x = −4, −3, 0, 2, 5, and 6.
\[y = −f(−4) = −(0) = 0 \\ y = −f(−3) = −(4) = −4 \\ y = −f(0) = −(4) = −4 \\ y = −f(2) = −(−4) = 4 \\ y = −f(5) = −(−4) = 4 \\ y = −f(6) = −(0) = 0 \nonumber \]
Points satisfying y = −f(x).
| x | -4 | -3 | 0 | 2 | 5 | 6 |
| y | 0 | -4 | -4 | 4 | 4 | 0 |
Plot the points in the table to get the graph of y = −f(x).
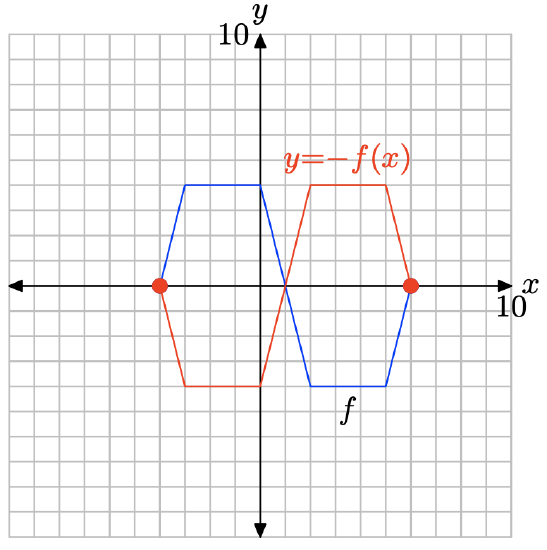
Note that negating the function, as in y = −f(x), reflects the graph of y = f(x) across the x-axis.
y = f(x) − 2.
| x | -4 | -3 | 0 | 2 | 5 | 6 |
| y |
y = f(x) + 4.
| x | -4 | -3 | 0 | 2 | 5 | 6 |
| y |
- Answer
-
The original function table.
x -4 -3 0 2 5 6 f(x) 0 4 4 -4 -4 0
Evaluate the function y = f(x) + 4 at x = −4, −3, 0, 2, 5, and 6.
\[y = f(−4) + 4 = (0) + 4 = 4 \\y = f(−3) + 4 = (4) + 4 = 8 \\y = f(0) + 4 = (4) + 4 = 8 \\y = f(2) + 4 = (−4) + 4 = 0 \\y = f(5) + 4 = (−4) + 4 = 0 \\y = f(6) + 4 = (0) + 4 = 4 \nonumber \]
Points satisfying y = f(x) + 4.
| x | -4 | -3 | 0 | 2 | 5 | 6 |
| y | 4 | 8 | 8 | 0 | 0 | 4 |
Plot the points in the table to get the graph of y = f(x) + 4.
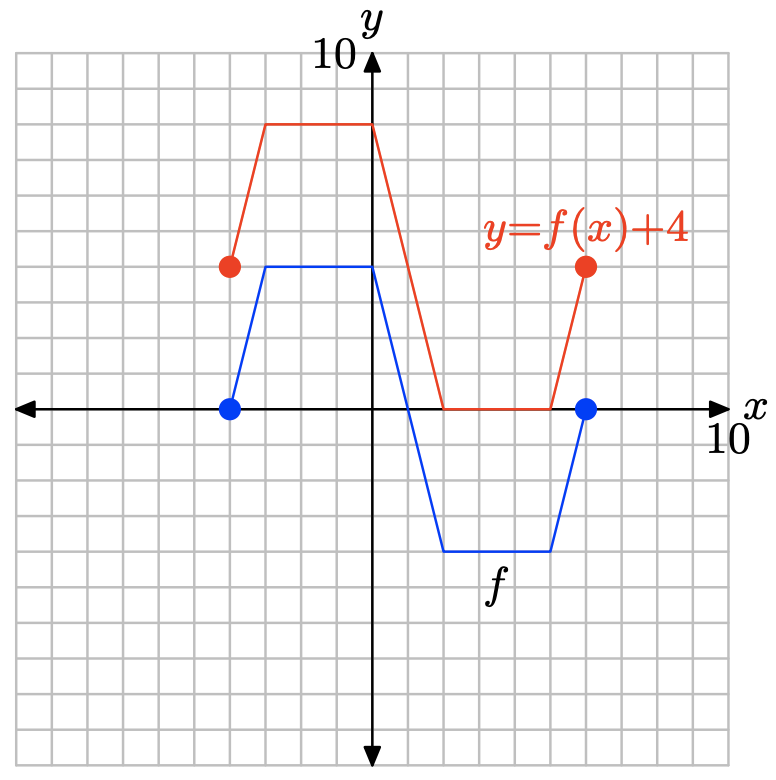
Note that adding 4, as in y = f(x) + 4, translates the graph of y = f(x) upwards 4 units.
y = −2f(x)
| x | -4 | -3 | 0 | 2 | 5 | 6 |
| y |
y = (−1/2)f(x)
| x | -4 | -3 | 0 | 2 | 5 | 6 |
| y |
- Answer
-
The original function table.
x -4 -3 0 2 5 6 f(x) 0 4 4 -4 -4 0
Evaluate the function y = (−1/2)f(x) at x = −4, −3, 0, 2, 5, and 6.
\[y = (−1/2)f(−4) = (−1/2)(0) = 0 \\ y = (−1/2)f(−3) = (−1/2)(4) = −2 \\ y = (−1/2)f(0) = (−1/2)(4) = −2 \\ y = (−1/2)f(2) = (−1/2)(−4) = 2 \\ y = (−1/2)f(5) = (−1/2)(−4) = 2 \\ y = (−1/2)f(6) = (−1/2)(0) = 0 \nonumber \]
Points satisfying y = (−1/2)f(x).
| x | -4 | -3 | 0 | 2 | 5 | 6 |
| y | 0 | -2 | -2 | 2 | 2 | 0 |
Plot the points in the table to get the graph of y = (−1/2)f(x).
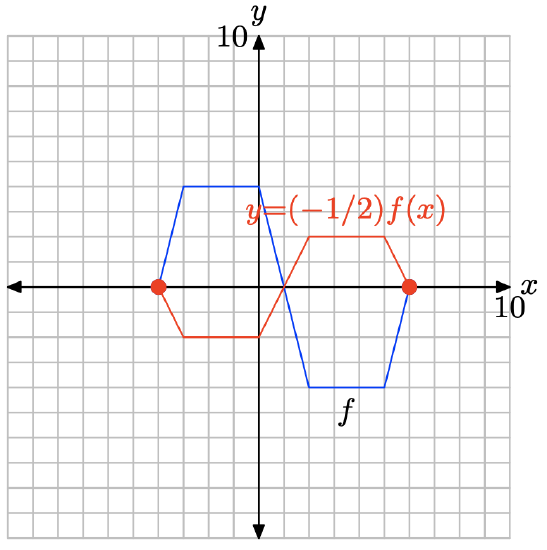
Note that multiplying by −1/2, as in y = (−1/2)f(x), compresses the graph of y = f(x) vertically by a factor of 2, then reflects the result across the x-axis.
y = −f(x) + 3.
| x | -4 | -3 | 0 | 2 | 5 | 6 |
| y |
y = −f(x) − 2
| x | -4 | -3 | 0 | 2 | 5 | 6 |
| y |
- Answer
-
The original function table.
x -4 -3 0 2 5 6 f(x) 0 4 4 -4 -4 0
Evaluate the function y = −f(x) − 2 at x = −4, −3, 0, 2, 5, and 6.
\[y = −f(−4) − 2 = −(0) − 2 = −2 \\ y = −f(−3) − 2 = −(4) − 2 = −6\\ y = −f(0) − 2 = −(4) − 2 = −6 \\y = −f(2) − 2 = −(−4) − 2 = 2 \\y = −f(5) − 2 = −(−4) − 2 = 2 \\y = −f(6) − 2 = −(0) − 2 = −2 \nonumber \]
Points satisfying y = −f(x) − 2.
| x | -4 | -3 | 0 | 2 | 5 | 6 |
| y | -2 | -6 | -6 | 2 | 2 | -2 |
Plot the points in the table to get the graph of y = −f(x) − 2.

Note that negating then subtracting 2, as in y = −f(x) − 2, first reflects the graph of y = f(x) across the x-axis, then translates the resulting reflection 2 units downward.
y = (−1/2)f(x) + 3
| x | -4 | -3 | 0 | 2 | 5 | 6 |
| y |
Use your graphing calculator to draw the graph of \(y = \sqrt{x}\). Then, draw the graph of \(y = \sqrt{x}\). In your own words, explain what you learned from this exercise.
- Answer
-
First, draw the graph of \(y = \sqrt{x}\).

The graph of \(y = -\sqrt{x}\) is a reflection of the graph of \(y = \sqrt{x}\) across the x-axis.
Negating a function appears to reflect the graph of the function across the x-axis.
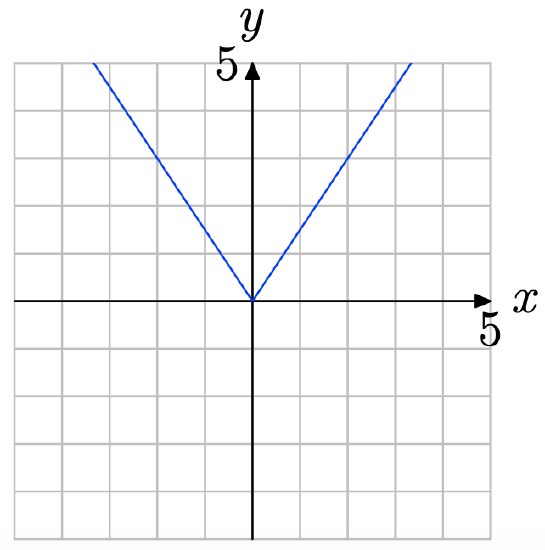
Use your graphing calculator to draw the graph of y = |x|. Then, draw the graph of y = −|x|. In your own words, explain what you learned from this exercise.
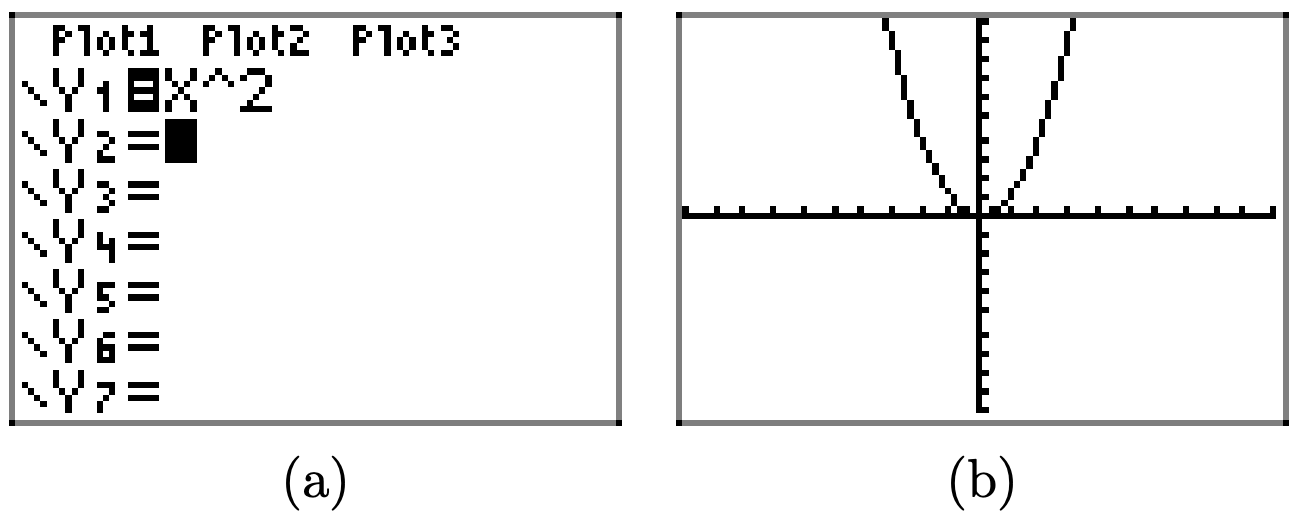
Use your graphing calculator to draw the graph of \(y = x^2\). Then, in succession, draw the graphs of \(y = x^2−2\), \(y = x^2−4\), and \(y = x^2 − 6\). In your own words, explain what you learned from this exercise.
- Answer
-
First, draw the graph of \(y = x^2\).
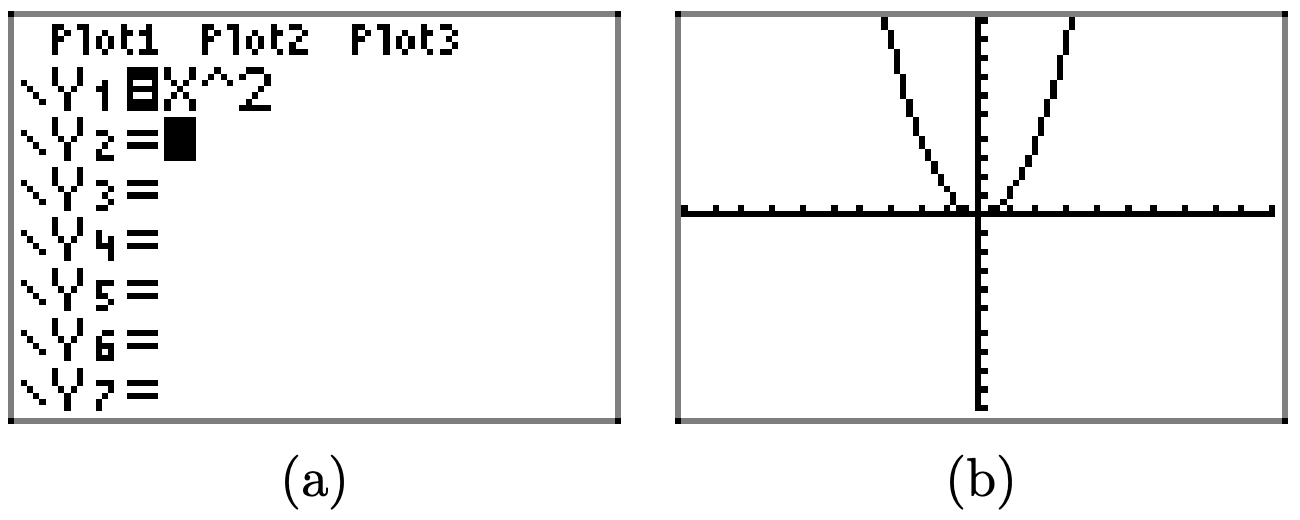
Subtracting 2 (as in \(y = x^2-2\)) translates the graph of \(y = x^2\) two units downward in the y-direction.

Similarly, subtracting 4 and 6 translates the graph of \(y = x^2\) four units and 6 units downward, respectively
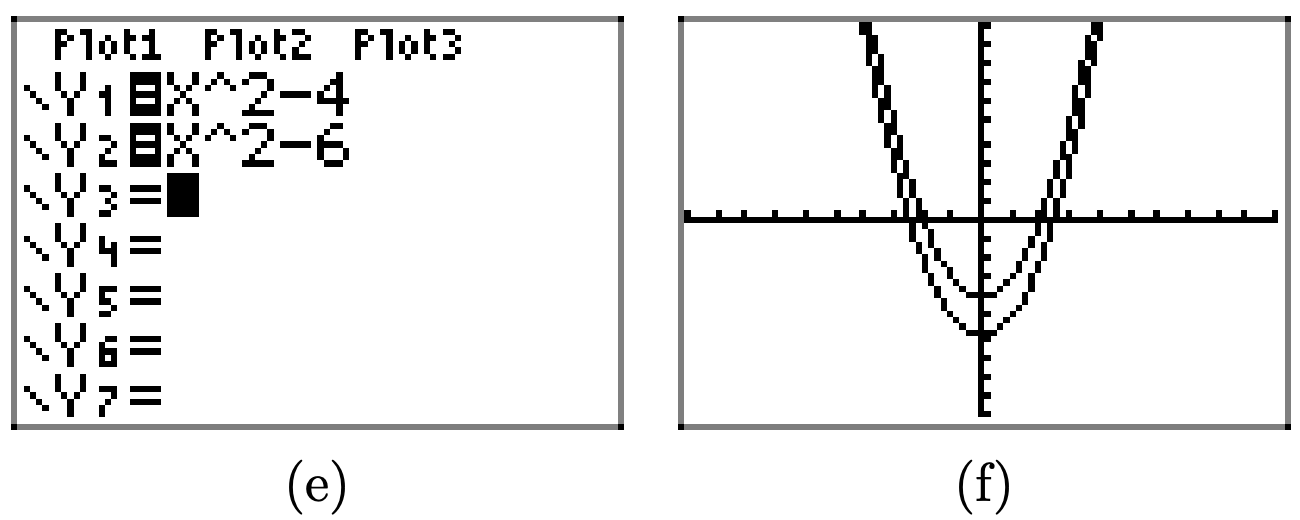
In general, if c is positive, then the graph of y = f(x) − c is obtained by translating the graph of y = f(x) downward c units.
Use your graphing calculator to draw the graph of \(y = x^2\). Then, in succession, draw the graphs of \(y = x^2+2\), \(y = x^2+4\), and \(y = x^2 + 6\). In your own words, explain what you learned from this exercise.
Use your graphing calculator to draw the graph of y = |x|. Then, in succession, draw the graphs of y = 2|x|, y = 3|x|, and y = 4|x|. In your own words, explain what you learned from this exercise.
- Answer
-
First, draw the graph of y = |x|.
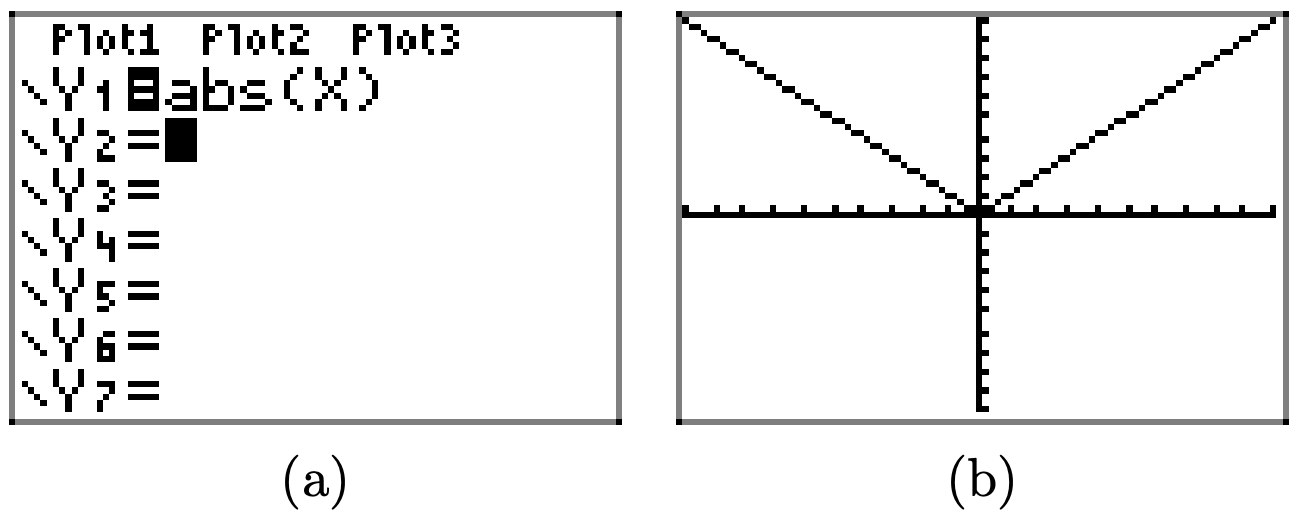
Multiplying by 2, as in y = 2|x|, stretches the graph of y = |x| vertically by a factor of 2.
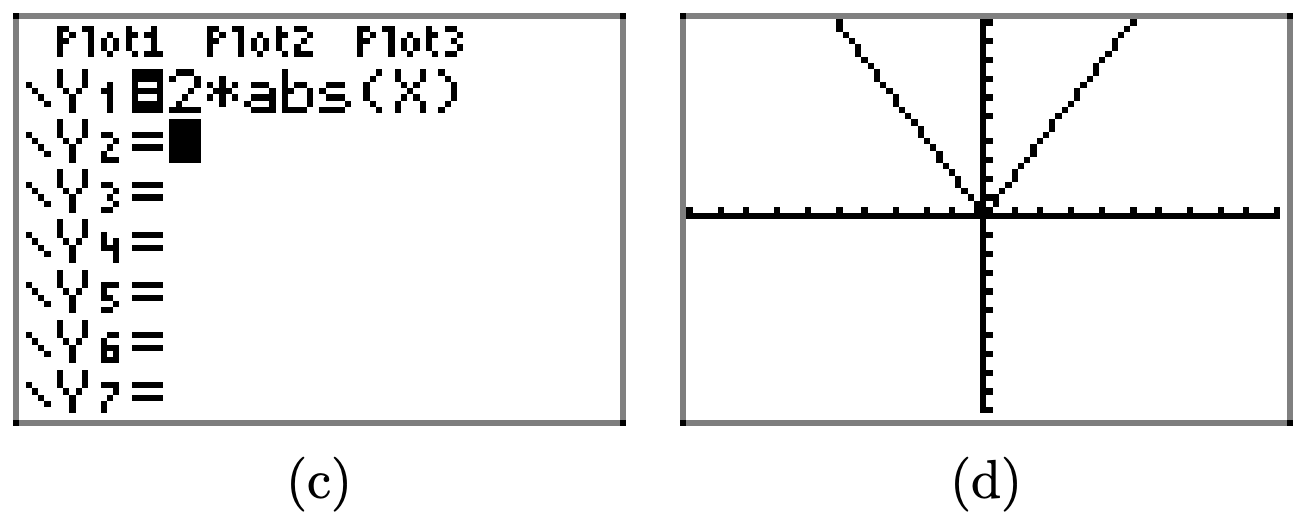
Similarly, multiplying by 3 and 4, as in y = 3|x| and y = 4|x|, stretches the graph of y = |x| vertically by factors of 3 and 4, respectively.
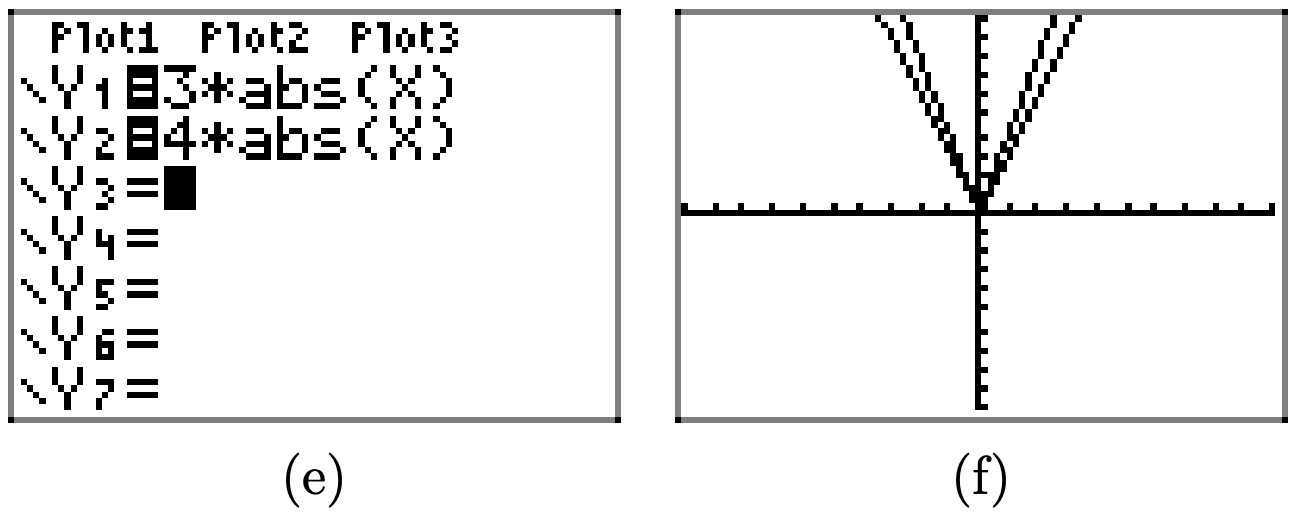
In general, if a > 1, then the graph of y = af(x) is obtained by stretching the graph of y = f(x) vertically by a factor of a.
Use your graphing calculator to draw the graph of y = |x|. Then, in succession, draw the graphs of y = (1/2)|x|, y = (1/3)|x|, and y = (1/4)|x|. In your own words, explain what you learned from this exercise.
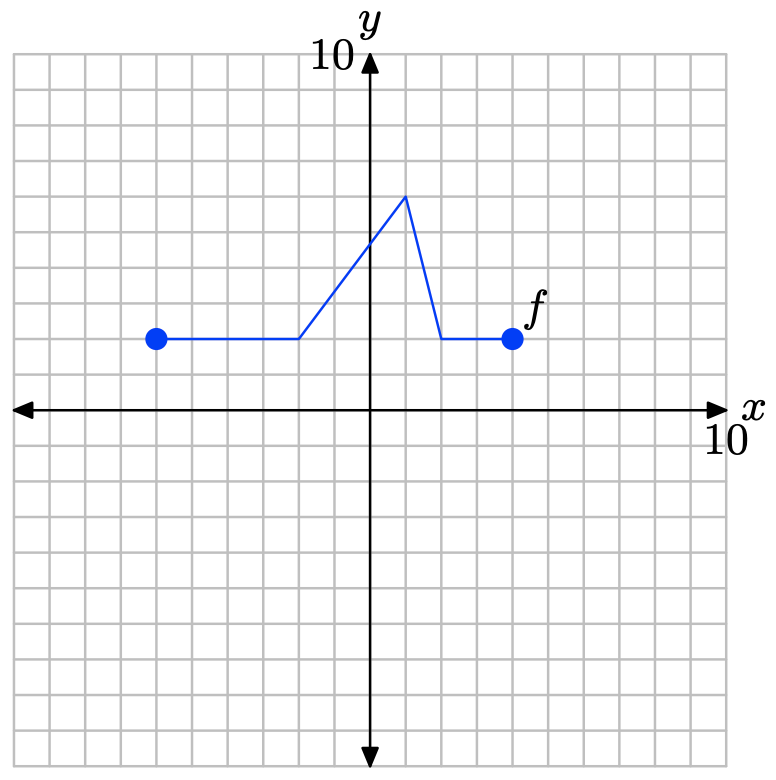
Pictured below is the graph of a function f. In Exercises \(\PageIndex{17}\)-\(\PageIndex{22}\), use this graph to perform each of the following tasks.
i. Set up a coordinate system on a sheet of graph paper. Label and scale each axis. Make an exact copy of the graph of f on your coordinate system. Remember to draw all lines with a ruler.
ii. In the narrative, a shadow box at the end of the section summarizes the concepts and technique of vertical scaling, vertical reflection, and vertical translation. Use the shortcut ideas presented in this summary shadow box to draw the graphs of the functions that follow without using tables.
iii. Use a different colored pencil to draw the graph of the function given in the exercise. Label this graph with its equation. Be sure that key points are accurately plotted. In each exercise, please plot exactly two plots per coordinate system, the graph of original function f and the graph of the function in the exercise.
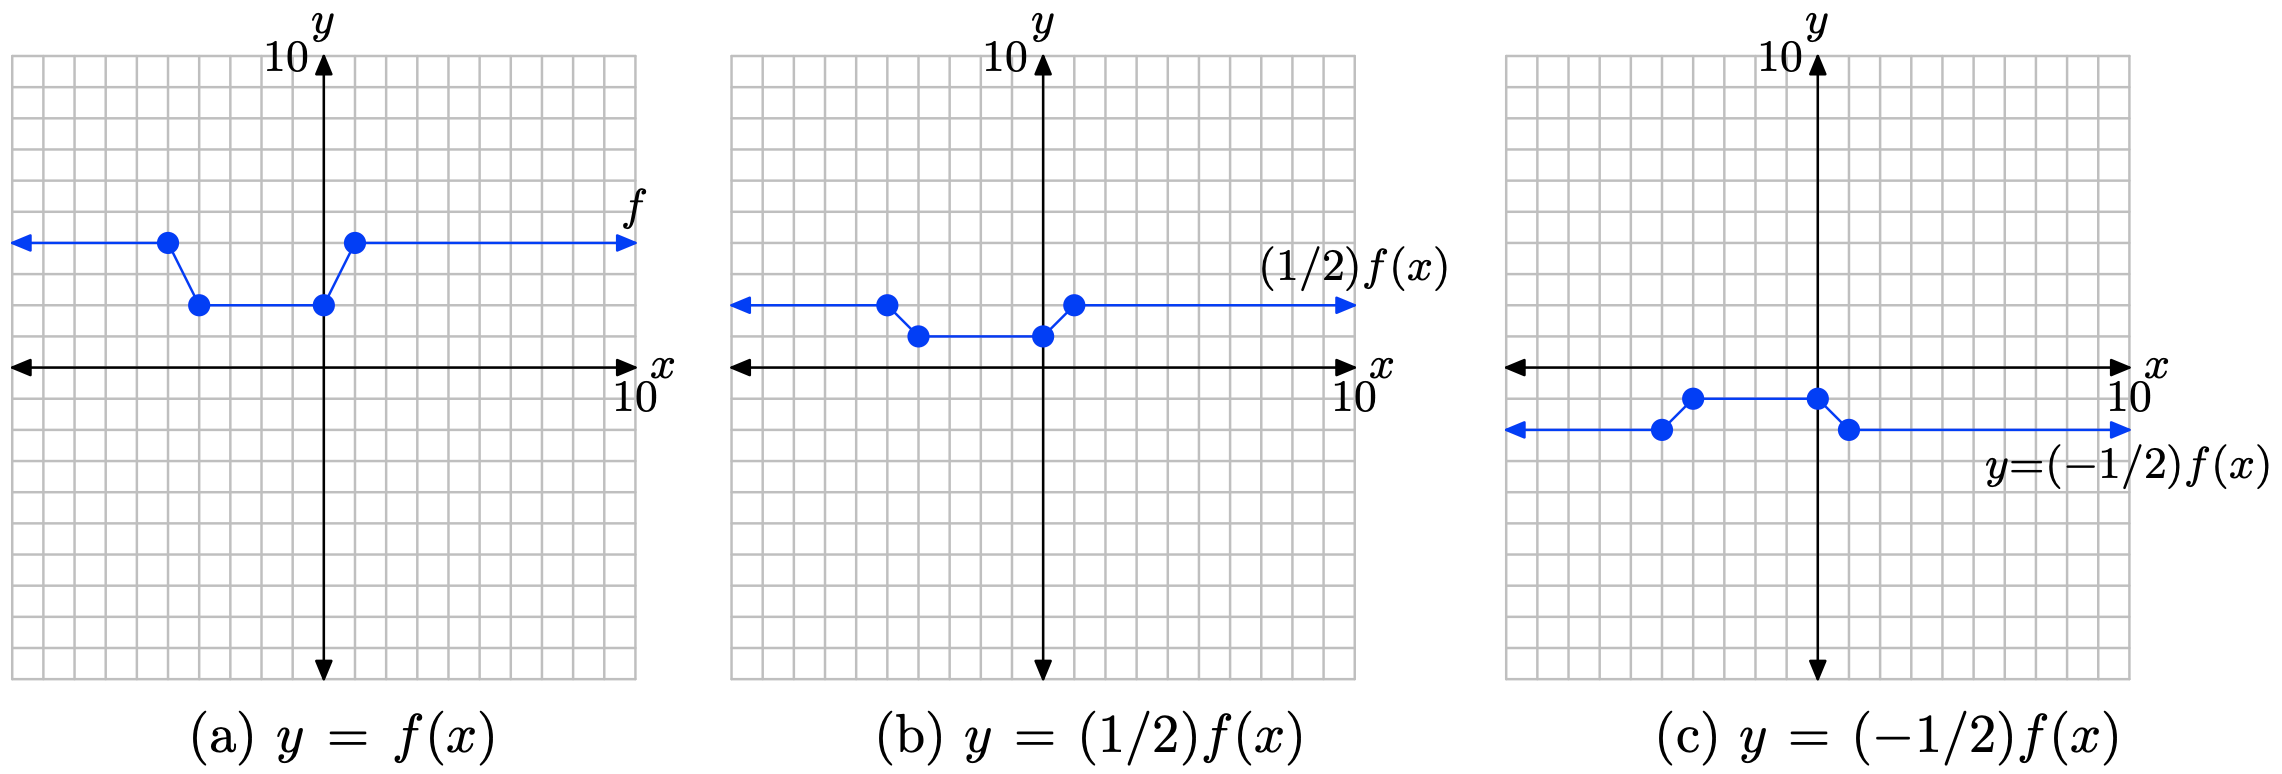
y = (1/2)f(x).
- Answer
-
To obtain the plot of y = (1/2)f(x), simply multiply the y-value of each point on the graph of y = f(x) by 1/2, keeping the x-value the same.
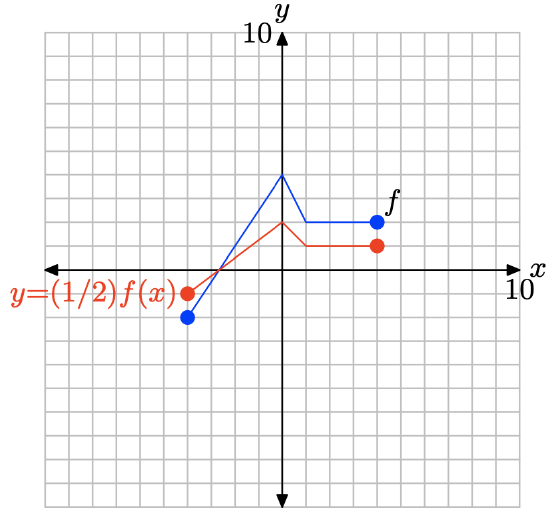
Note that multiplying by 1/2, as in y = (1/2)f(x), compresses the graph of y = f(x) vertically by a factor of 2.
y = 2f(x).
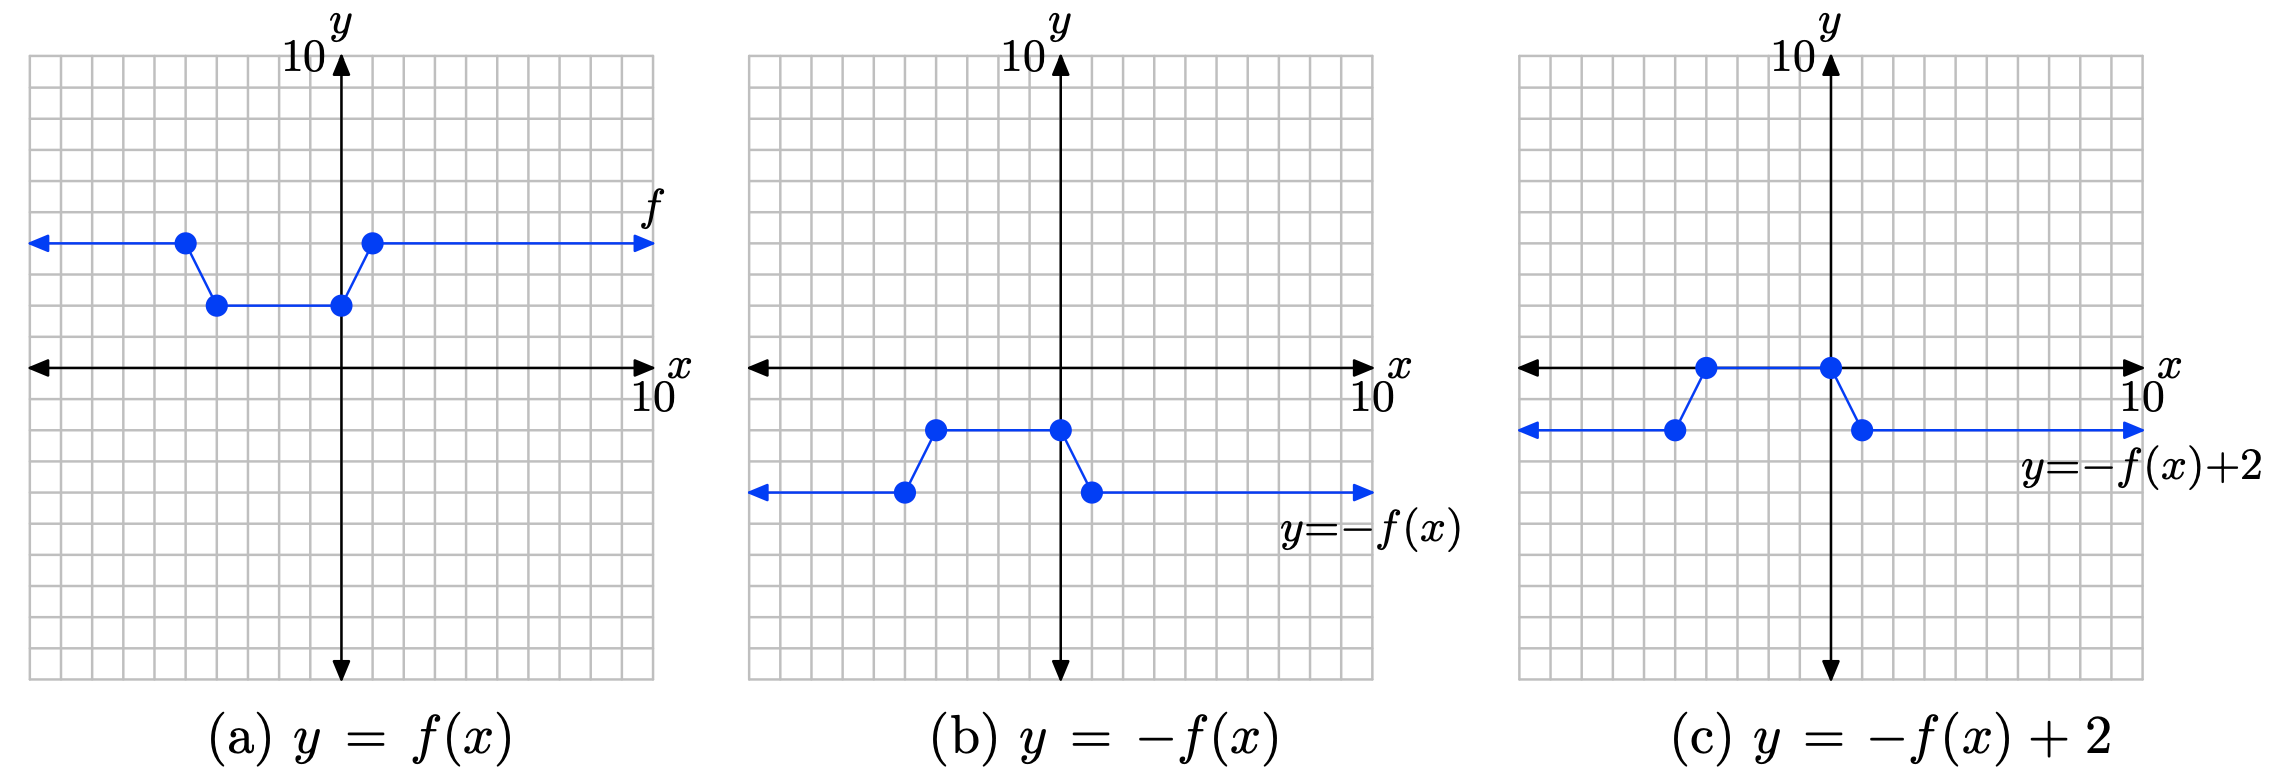
y= −f(x).
- Answer
-
To obtain the plot of y = −f(x), simply negate the y-value of each point on the graph of y = f(x).
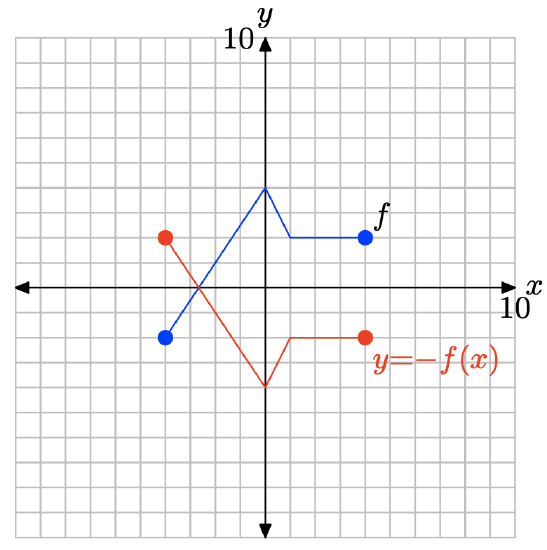
Note that negating, as in y = −f(x), reflects the graph of y = f(x) across the x-axis.
y = f(x) − 1
y = f(x) + 3.
- Answer
-
To obtain the plot of y = f(x) + 3, simply add 3 to the y-value of each point on the graph of y = f(x).
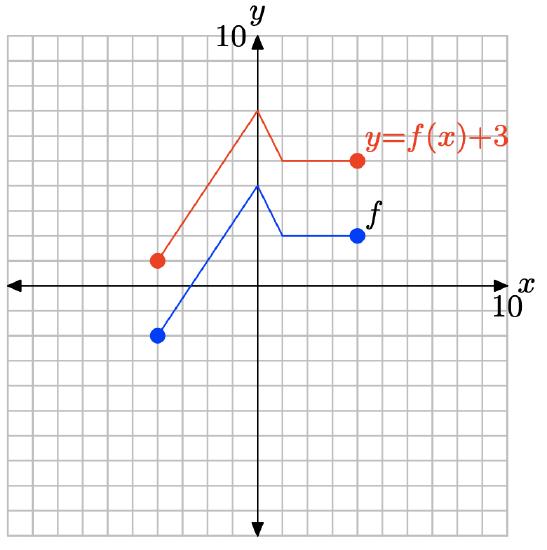
Note that adding 3, as in y = f(x) + 3, translates the graph of y = f(x) upwards 3 units.
y = f(x) − 4
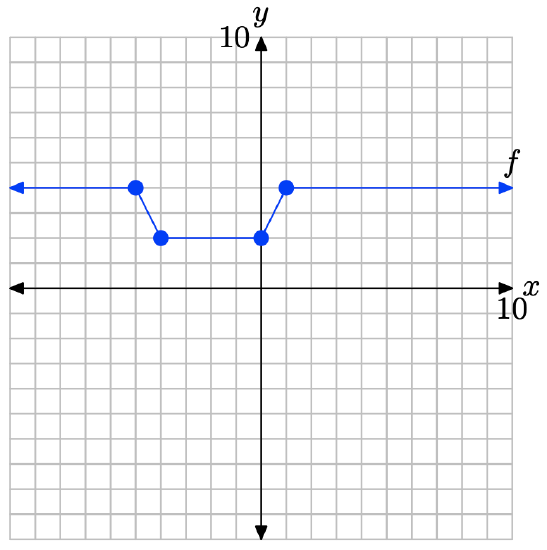
Pictured below is the graph of a function f. In Exercises \(\PageIndex{23}\)-\(\PageIndex{28}\), use this graph to perform each of the following tasks.
i. Set up a coordinate system on a sheet of graph paper. Label and scale each axis. Make an exact copy of the graph of f on your coordinate system. Remember to draw all lines with a ruler.
ii. In the narrative, a shadow box at the end of the section summarizes the concepts and technique of vertical scaling, vertical reflection, and vertical translation. Use the shortcut ideas presented in this summary shadow box to draw the graphs of the functions that follow without using tables.
iii. Use a different colored pencil to draw the graph of the function given in the exercise. Label this graph with its equation. Be sure that key points are accurately plotted. In each exercise, please plot exactly two plots per coordinate system, the graph of original function f and the graph of the function in the exercise.
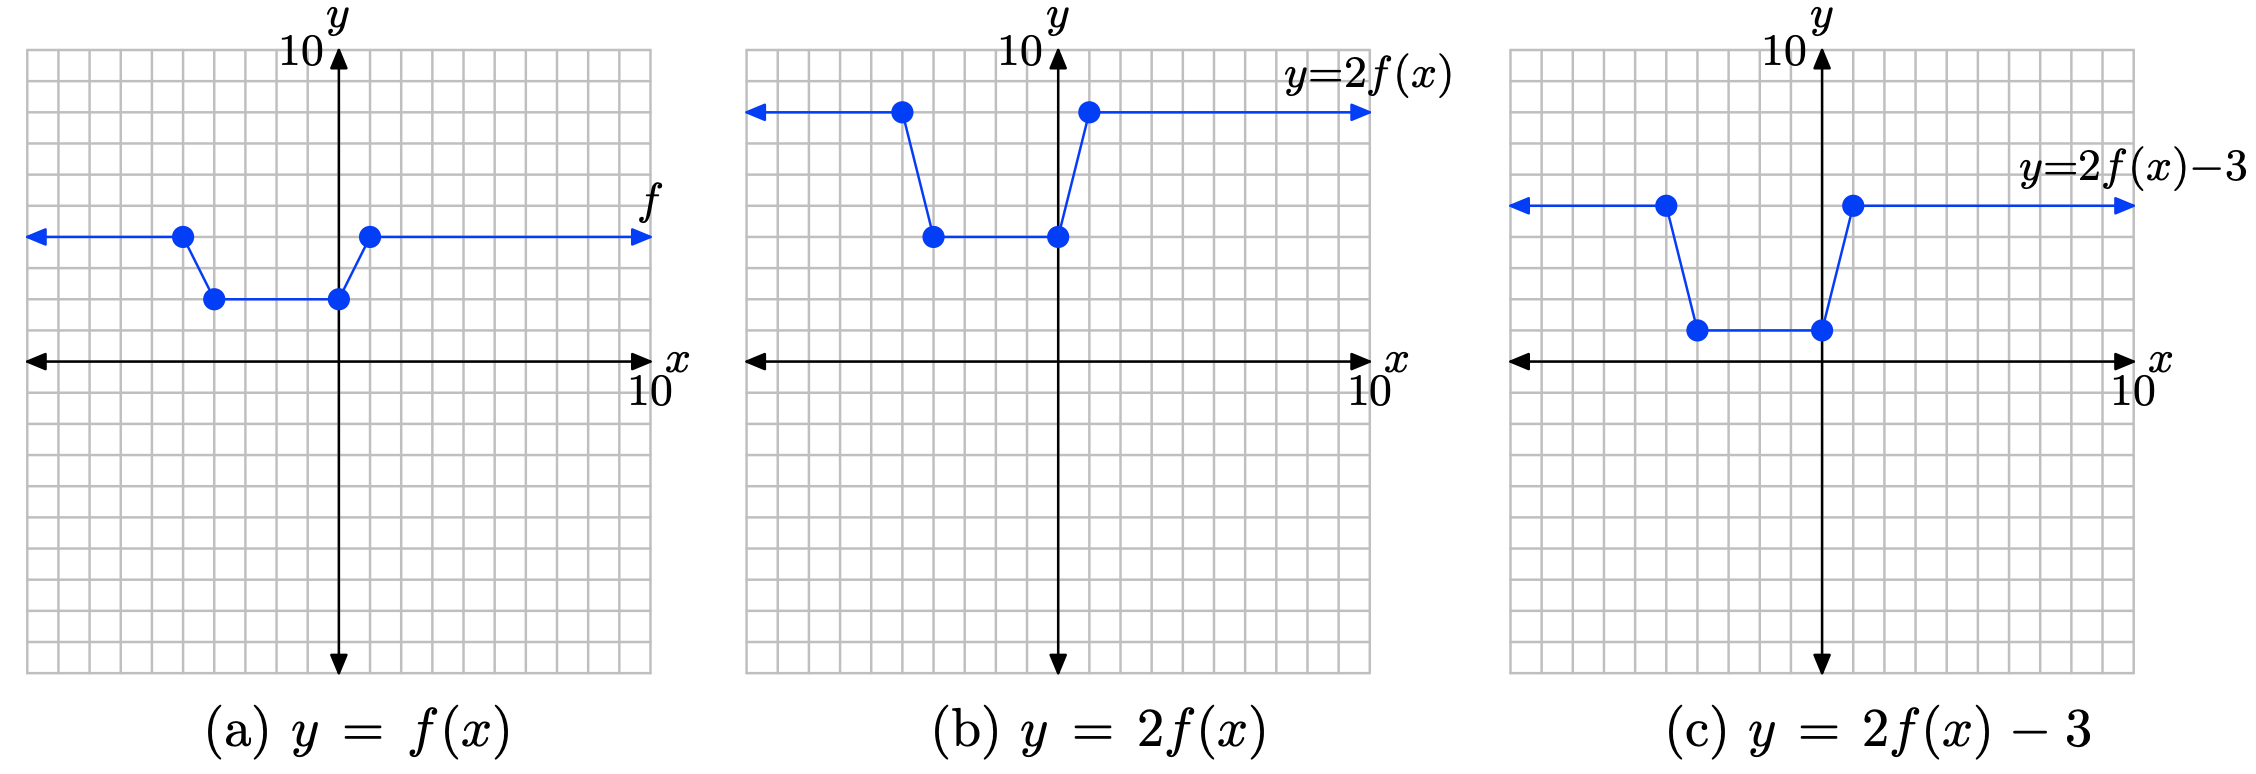
y = 2f(x)
- Answer
-
To obtain the plot of y = 2f(x), simply multiply the y-value of each point of y = f(x) by 2.
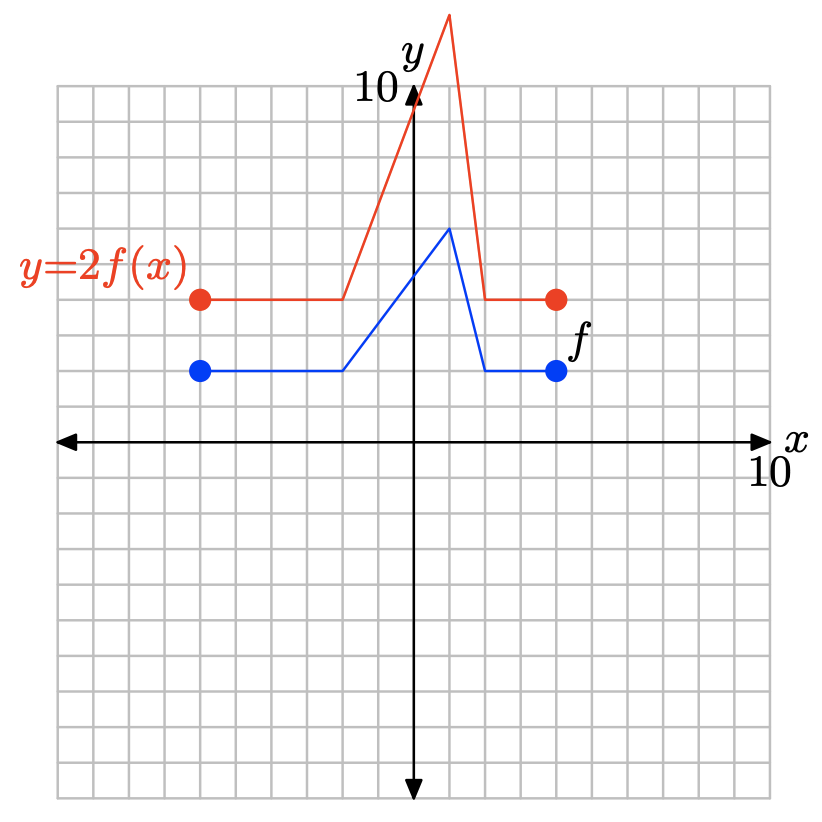
Note that multiplying by 2, as in y = 2f(x), stretches the graph of y = f(x) vertically by a factor of 2.
y = (1/2)f(x)
y = −f(x).
- Answer
-
To obtain the plot of y = −f(x), simply negate the y-value of each point on the graph of y = f(x).
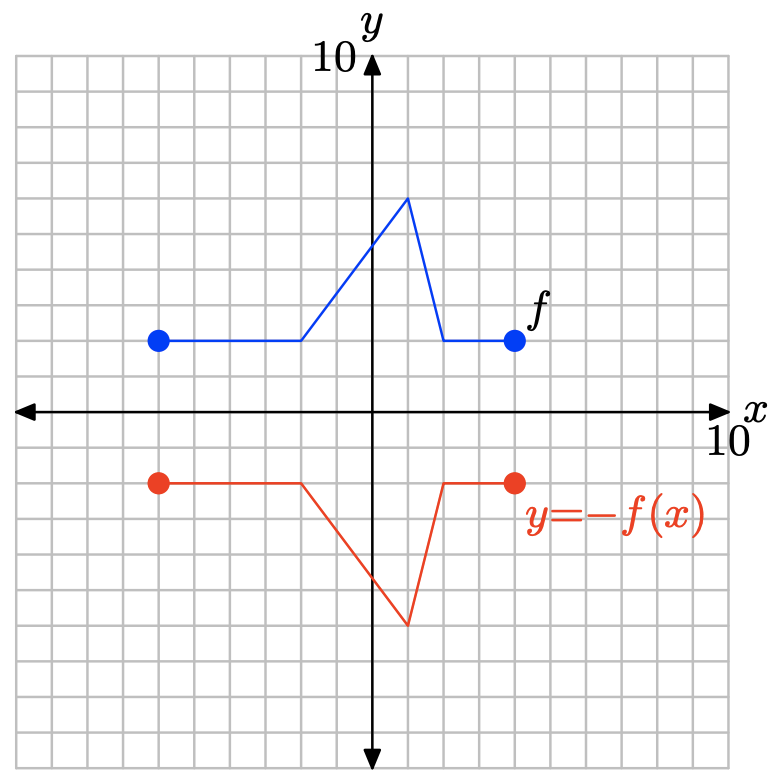
Note that negating a function, as in y = −f(x), reflects the graph of y = f(x) across the x-axis.
y = f(x) + 3
y = f(x) − 2
- Answer
-
To obtain the plot of y = f(x) − 2, simply subtract 2 from the y-value of each point on the graph of y = f(x).
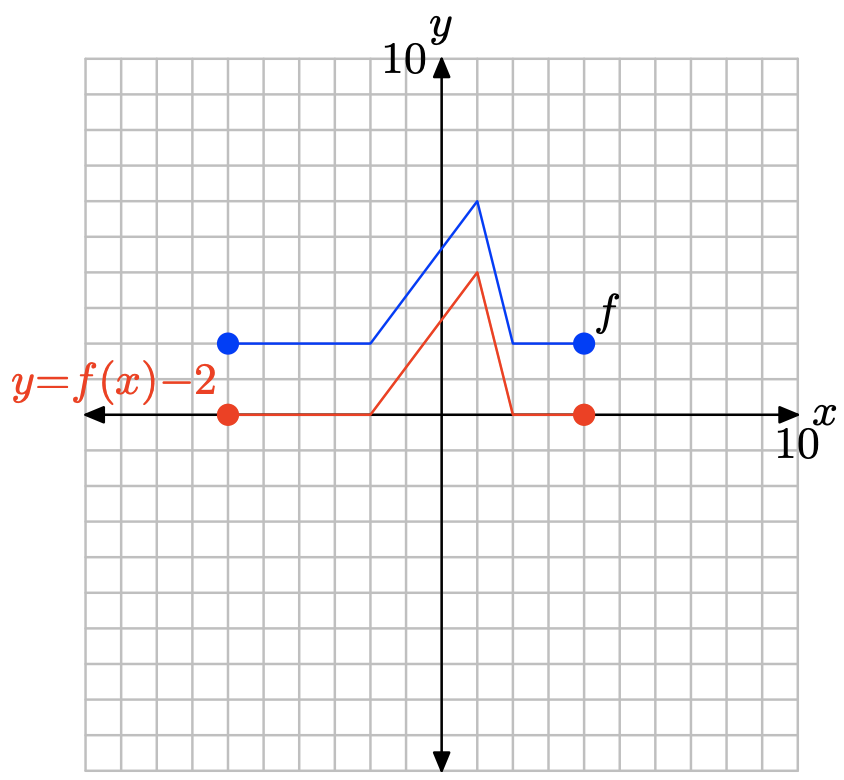
Note that subtracting 2, as in y = f(x)−2, translates the graph of y = f(x) downwards 2 units.
y = f(x) − 1
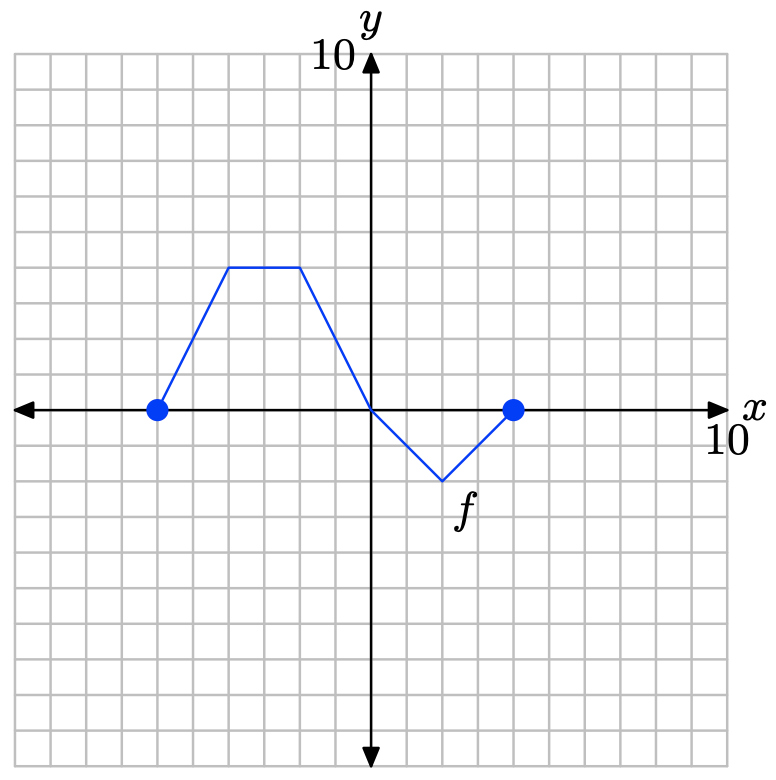
Pictured below is the graph of a function f. In Exercises \(\PageIndex{29}\)-\(\PageIndex{34}\), use this graph to perform each of the following tasks.
i. Set up a coordinate system on a sheet of graph paper. Label and scale each axis. Make an exact copy of the graph of f on your coordinate system. Remember to draw all lines with a ruler.
ii. In the narrative, a shadow box at the end of the section summarizes the concepts and technique of vertical scaling, vertical reflection, and vertical translation. Use the shortcut ideas presented in this summary shadow box to draw the graphs of the functions that follow without using tables.
iii. Use a different colored pencil to draw the graph of the function given in the exercise. Label this graph with its equation. Be sure that key points are accurately plotted. In each exercise, please plot exactly two plots per coordinate system, the graph of original function f and the graph of the function in the exercise.
y = (−1/2)f(x)
- Answer
-
We proceed in two steps:
1. First, multiply the y-value of each point on the graph of y = f(x) by 1/2 to produce the graph of y = (1/2)f(x) in (b). This compresses the graph of y = f(x) by a factor of 2.
2. Secondly, multiply the y-value of each point on the graph of y = (1/2)f(x) by −1 to produce the graph of y = (−1/2)f(x) in (c). This reflects the graph of y = (1/2)f(x) across the x-axis.
y = −2f(x).
y = −f(x) + 2
- Answer
-
We proceed in two steps:
1. First, multiply the y-value of each point on the graph of y = f(x) by −1 to produce the graph of y = −f(x) in (b). This reflects the graph of y = f(x) across the x-axis.
2. Secondly, add 2 to the y-value of each point on the graph of y = −f(x) to produce the graph of y = −f(x) + 2 in (c). This shifts the graph of y = −f(x) upward 2 units.
y = −f(x) − 3
y = 2f(x) − 3.
- Answer
-
We proceed in two steps:
1. First, multiply the y-value of each point on the graph of y = f(x) by 2 to produce the graph of y = 2f(x) in (b). This stretches the graph of y = f(x) vertically by a factor of 2.
2. Secondly, subtract 3 from the y-value of each point on the graph of y = 2f(x) to produce the graph of y = 2f(x) − 3 in (c). This shifts the graph of y = 2f(x) downward 3 units.
y = (−1/2)f(x) + 1
2.6 Exercises
Pictured below is the graph of a function f.
The table that follows evaluates the function f in the plot at key values of x. Notice the horizontal format, where the first point in the table is the ordered pair (−6, 0).
| x | -6 | -4 | -2 | 0 | 2 | 4 |
| f(x) | 0 | 4 | 4 | 0 | -2 | 0 |
Use the graph and the table to complete each of following tasks for Exercises \(\PageIndex{1}\) - \(\PageIndex{10}\).
i. Set up a coordinate system on graph paper. Label and scale each axis, then copy and label the original graph of f onto your coordinate system. Remember to draw all lines with a ruler.
ii. Use the original table to help complete the table for the given function in the exercise.
iii. Using a different colored pencil, plot the data from your completed table on the same coordinate system as the original graph of f. Use these points to help complete the graph of the given function in the exercise, then label this graph with its equation given in the exercise.
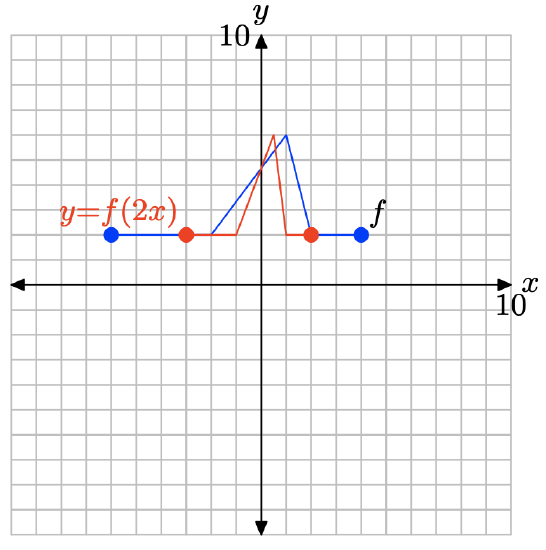
y = f(2x).
| x | -3 | -2 | -1 | 0 | 1 | 2 |
| y |
- Answer
-
The original function table.
x -6 -4 -2 0 2 4 f(x) 0 4 4 0 -2 0
Evaluate the function y = f(2x) at x = −3, −2, −1, 0, 1, and 2.
\[y = f(2(−3)) = f(−6) = 0 \\ y = f(2(−2)) = f(−4) = 4 \\ y = f(2(−1)) = f(−2) = 4 \\ y = f(2(0)) = f(0) = 0 \\ y = f(2(1)) = f(2) = −2 \\ y = f(2(2)) = f(4) = 0 \nonumber \]
Points satisfying y = f(2x).
| x | -3 | -2 | -1 | 0 | 1 | 2 |
| y | 0 | 4 | 4 | 0 | -2 | 0 |
Plot the points in the table to get the graph of y = f(2x).
Note that replacing x with 2x, as in y = f(2x), compresses the graph of y = f(x) horizontally by a factor of 2.
y = f((1/2)x).
| x | -12 | -8 | -4 | 0 | 4 | 8 |
| y |
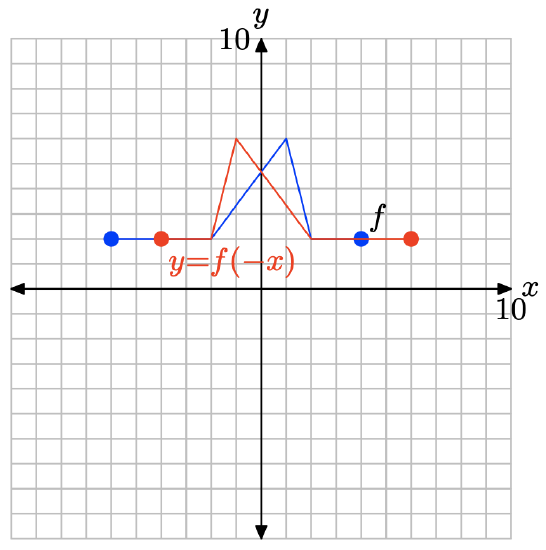
y = f(−x).
| x | -4 | -2 | 0 | 2 | 4 | 6 |
| y |
- Answer
- The original function table.
-
x -6 -4 -2 0 2 4 f(x) 0 4 4 0 -2 0
Evaluate the function y = f(−x) at x = −4, −2, 0, 2, 4, and 6.
\[y = f(−(−4)) = f(4) = 0 \\ y = f(−(−2)) = f(2) = −2 \\ y = f(−(0)) = f(0) = 0 \\ y = f(−(2)) = f(−2) = 4 \\ y = f(−(4)) = f(−4) = 4 \\ y = f(−(6)) = f(−6) = 0 \nonumber \]
Points satisfying y = f(−x).
| x | -4 | -2 | 0 | 2 | 4 | 6 |
| y | 0 | -2 | 0 | 4 | 4 | 0 |
Plot the points in the table to get the graph of y = f(−x).
Note that replacing x with −x, as in y = f(−x), reflects the graph of y = f(x) across the y-axis.
y = f(x + 3).
| x | -9 | -7 | -5 | -3 | -1 | 1 |
| y |
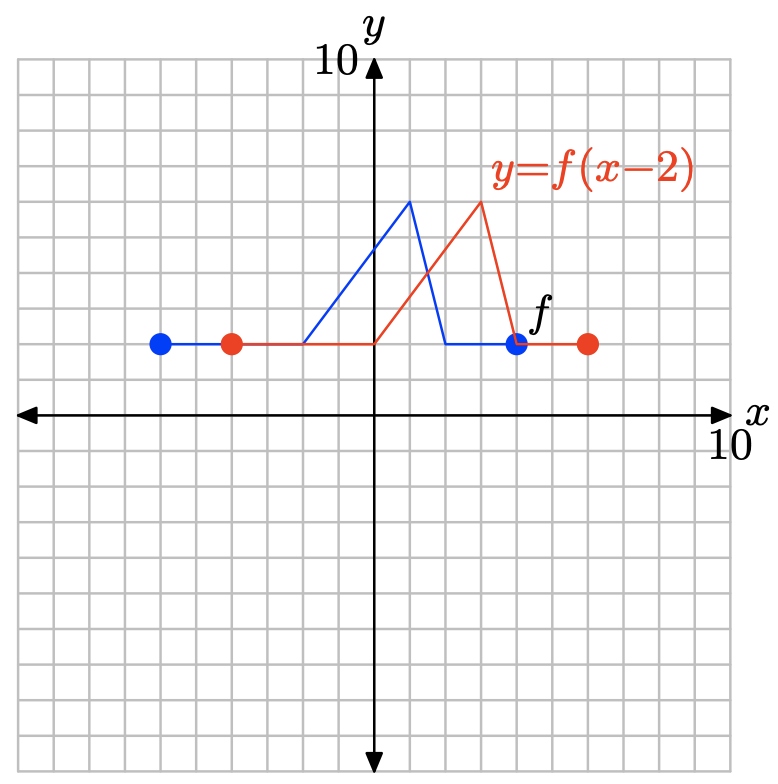
y = f(x − 1).
| x | -5 | -3 | -1 | 1 | 3 | 5 |
| y |
- Answer
-
The original function table.
x -6 -4 -2 0 2 4 f(x) 0 4 4 0 -2 0
Evaluate the function y = f(x − 1) at x = −5, −3, −1, 1, 3, and 5.
\[y = f((−5) − 1) = f(−6) = 0 \\ y = f((−3) − 1) = f(−4) = 4 \\ y = f((−1) − 1) = f(−2) = 4 \\ y = f((1) − 1) = f(0) = 0 \\ y = f((3) − 1) = f(2) = −2 \\ y = f((5) − 1) = f(4) = 0 \nonumber \]
Points satisfying y = f(x − 1).
| x | -5 | -3 | -1 | 1 | 3 | 5 |
| y | 0 | 4 | 4 | 0 | -2 | 0 |
Plot the points in the table to get the graph of y = f(x − 1).
Note that replacing x with x − 1, as in y = f(x − 1), translates the graph of y = f(x) horizontally 1 unit to the right.
y = f(−2x).
| x | -2 | -1 | 0 | 1 | 2 | 3 |
| y |
y = f((−1/2)x).
| x | -8 | -4 | 0 | 4 | 8 | 12 |
| y |
- Answer
-
The original function table.
x -6 -4 -2 0 2 4 f(x) 0 4 4 0 -2 0
Evaluate the function y = f((−1/2)x) at x = −8, −4, 0, 4, 8, and 12.
\[y = f((−1/2)(−8)) = f(4) = 0 \\ y = f((−1/2)(−4)) = f(2) = −2 \\ y = f((−1/2)(0)) = f(0) = 0 \\ y = f((−1/2)(4)) = f(−2) = 4 \\ y = f((−1/2)(8)) = f(−4) = 4 \\ y = f((−1/2)(12)) = f(−6) = 0 \nonumber \]
Points satisfying y = f((−1/2)x).
| x | -8 | -4 | 0 | 4 | 8 | 12 |
| y | 0 | -2 | 0 | 4 | 4 | 0 |
Plot the points in the table to get the graph of y = f((−1/2)x).
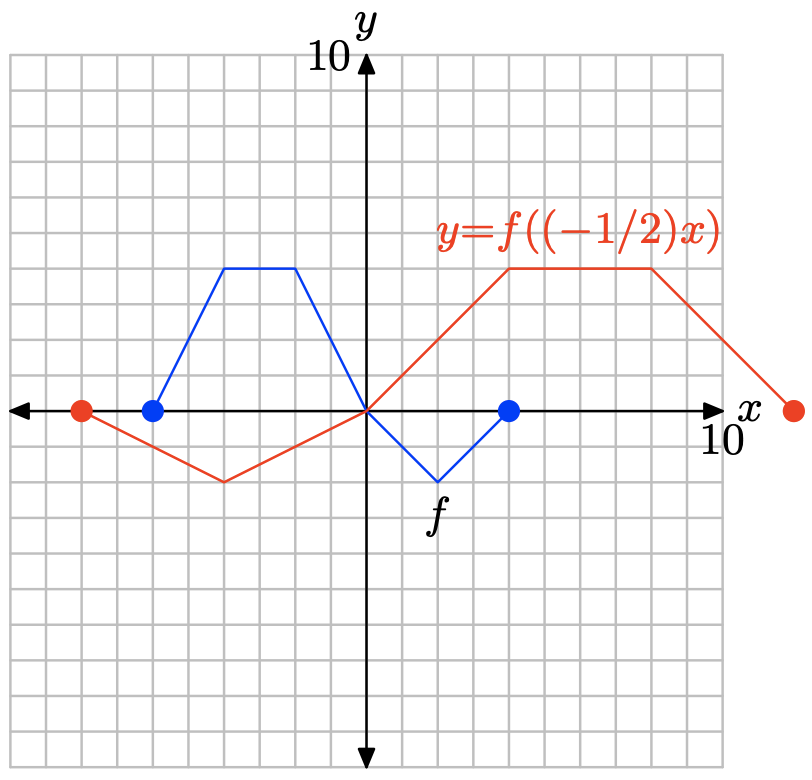
Note that replacing x with (−1/2)x, as in y = f((−1/2)x), stretches the graph by a factor of 2, then reflects the result across the y-axis.
y= f(−x − 2)
| x | -6 | -4 | -2 | 0 | 2 | 4 |
| y |
y= f(−x + 1).
| x | -3 | -1 | 1 | 3 | 5 | 7 |
| y |
- Answer
-
The original function table.
x -6 -4 -2 0 2 4 f(x) 0 4 4 0 -2 0
Evaluate the function y = f(−x + 1) at x = −3, −1, 1, 3, 5, and 7.
\[y = f(−(−3) + 1) = f(4) = 0 \\ y = f(−(−1) + 1) = f(2) = −2 \\ y = f(−(1) + 1) = f(0) = 0 \\ y = f(−(3) + 1) = f(−2) = 4 \\ y = f(−(5) + 1) = f(−4) = 4 \\ y = f(−(7) + 1) = f(−6) = 0 \nonumber \]
Points satisfying y = f(−x + 1).
| x | -3 | -1 | 1 | 3 | 5 | 7 |
| y | 0 | -2 | 0 | 4 | 4 | 0 |
Plot the points in the table to get the graph of y = f(−x + 1).
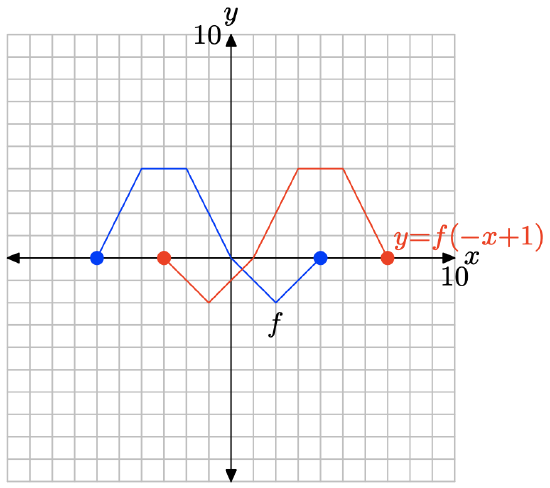
Note that y = f(−x + 1) is the same as y = f(−(x − 1)). If we replace x with −x to get y = f(−x), then x in this last result with x − 1 to get y = f(−(x − 1)), this has the effect of first reflecting the graph of y = f(x) across the y-axis, then shifting the result to the right 1 unit.
y = f(−x/4).
| x | -16 | -8 | 0 | 8 | 16 | 24 |
| y |
Use your graphing calculator to draw the graph of \(y = \sqrt{x}\). Then, draw the graph of \(y = \sqrt{-x}\). In your own words, explain what you learned from this exercise.
- Answer
-
First, draw the graph of \(y = \sqrt{x}\).
The graph of \(y = \sqrt{-x}\) is a reflection of the graph of \(y = \sqrt{x}\) across the y-axis.
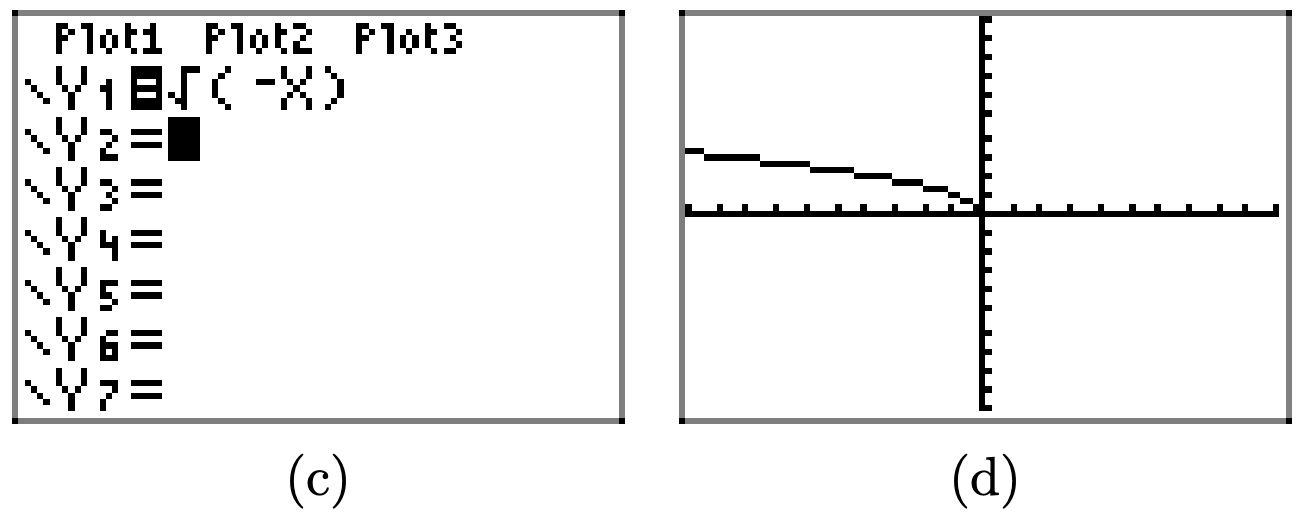
Replacing x with −x, as in y = f(−x), reflects the graph of y = f(x) across the y-axis.
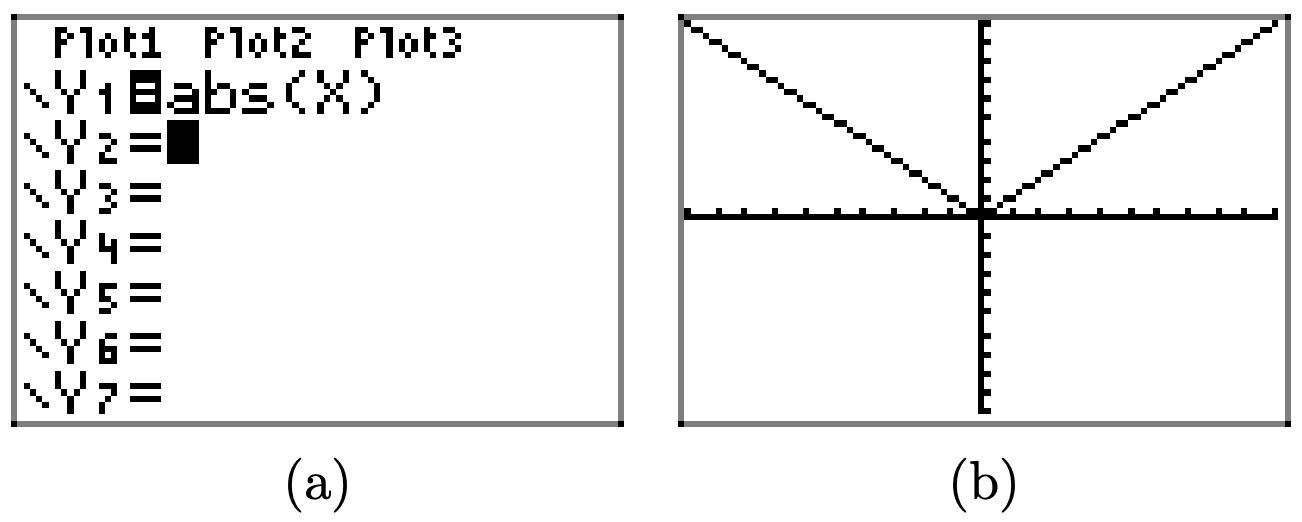
Use your graphing calculator to draw the graph of y = |x|. Then, draw the graph of y = | − x|. In your own words, explain what you learned from this exercise.
Use your graphing calculator to draw the graph of \(y = x^2\). Then, in succession, draw the graphs of \(y = (x − 2)^2, y = (x − 4)^2\), and \(y = (x − 6)^2\). In your own words, explain what you learned from this exercise.
- Answer
-
First, draw the graph of \(y = x^2\).
Replacing x with x − 2 translates the graph of \(y = x^2\) two units to the right in the horizontal direction.
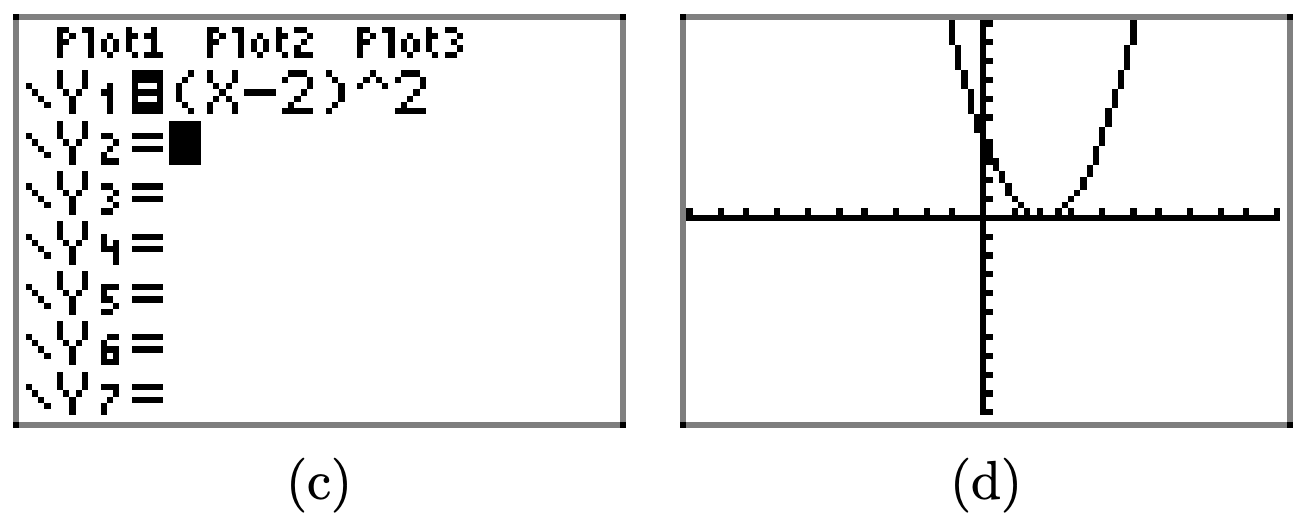
Similarly, replacing x with x − 4 and x − 6 translates the graph of \(y = x^2\) four units and 6 units to the right, respectively.
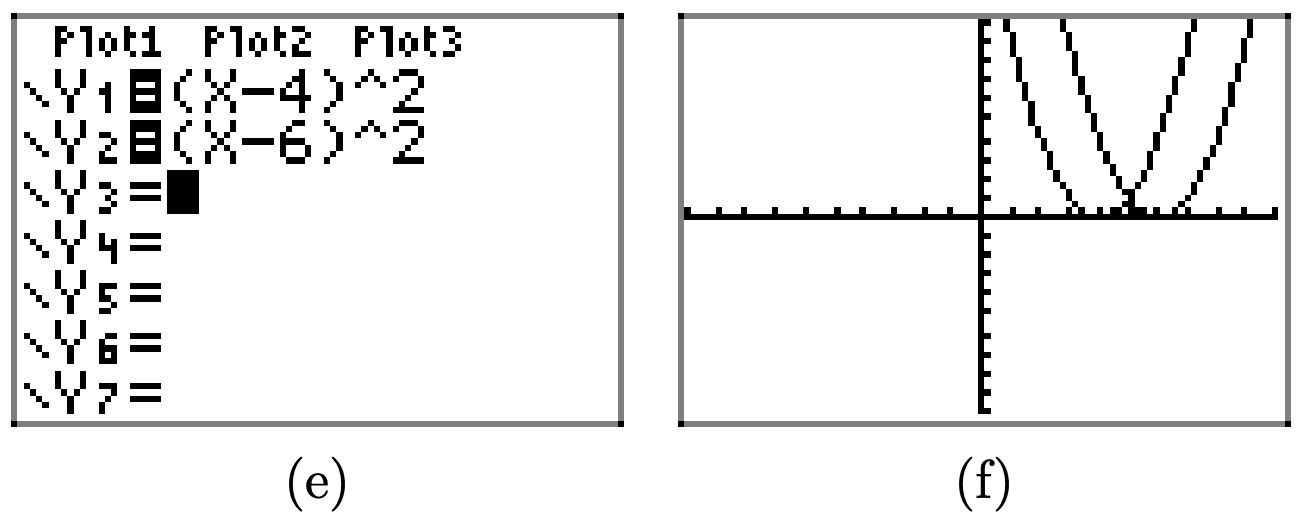
In general, if c is positive, then the graph of y = f(x − c) is obtained by translating the graph of y = f(x) to the right c units.
Use your graphing calculator to draw the graph of \(y = x^2\). Then, in succession, draw the graphs of \(y = (x + 2)^2, y = (x + 4)^2\), and \(y = (x + 6)^2\). In your own words, explain what you learned from this exercise.
Use your graphing calculator to draw the graph of y = |x|. Then, in succession, draw the graphs of y = |2x|, y = |3x|, and y = |4x|. In your own words, explain what you learned from this exercise.
- Answer
-
First, draw the graph of y = |x|.
Replacing x with 2x compresses the graph of y = |x| by a factor of 2 in the horizontal direction.

Similarly, replacing x with 3x and 4x by a factor of 3 and 4 in the horizontal direction, respectively.
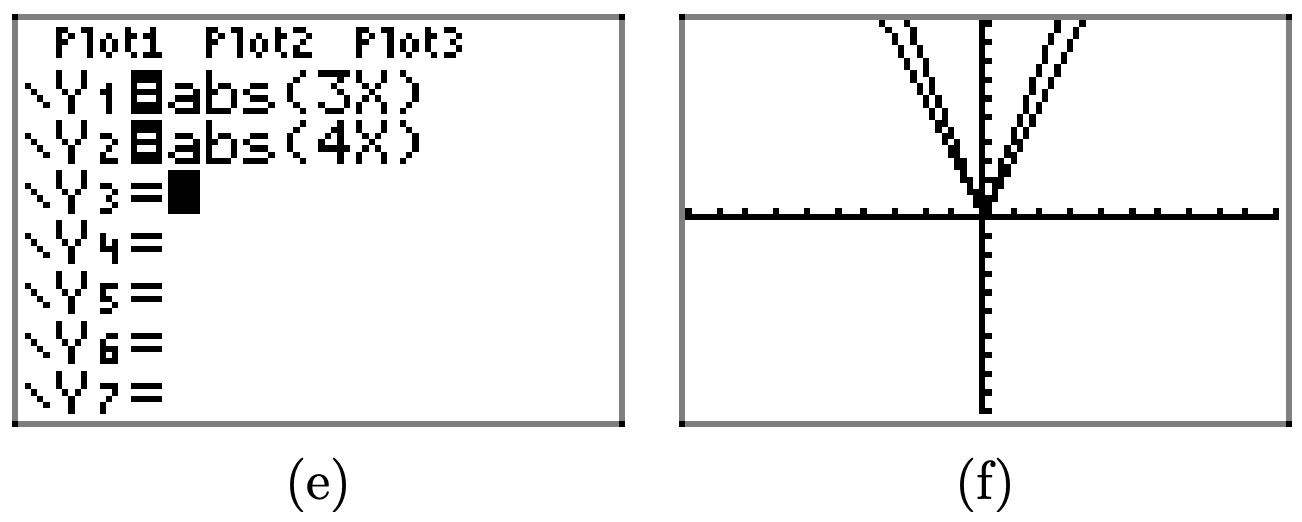
In general, if a > 1, then the graph of y = f(ax) is obtained by compressing the graph of y = f(x) by a factor of a in the horizontal direction.
Use your graphing calculator to draw the graph of y = |x|. Then, in succession, draw the graphs of y = |(1/2)x|, y = |(1/3)x|, and y = |(1/4)x|. In your own words, explain what you learned from this exercise.
Pictured below is the graph of a function f. In Exercises \(\PageIndex{17}\)-\(\PageIndex{22}\), use this graph to perform each of the following tasks.
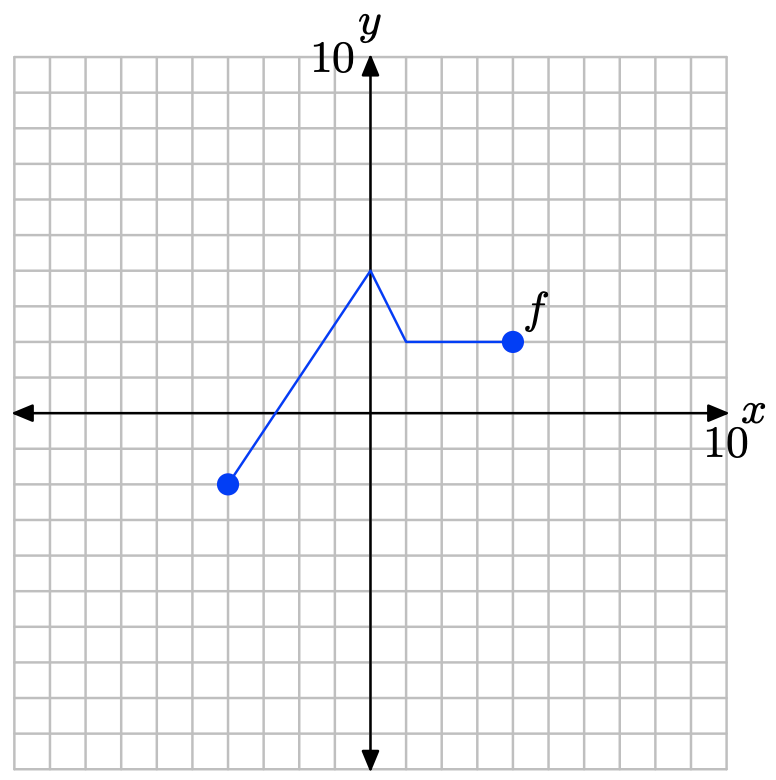
i. Set up a coordinate system on a sheet of graph paper. Label and scale each axis. Make an exact copy of the graph of f on your coordinate system. Remember to draw all lines with a ruler.
ii. In the narrative, a shadow box at the end of the section summarizes the concepts and technique of horizontal scaling, horizontal reflection, and horizontal translation. Use the shortcut ideas presented in this summary shadow box to draw the graphs of the functions that follow without using tables.
iii. Use a different colored pencil to draw the graph of the function given in the exercise. Label this graph with its equation. Be sure that key points are accurately plotted. In each exercise, please plot exactly two plots per coordinate system, the graph of original function f and the graph of the function in the exercise.
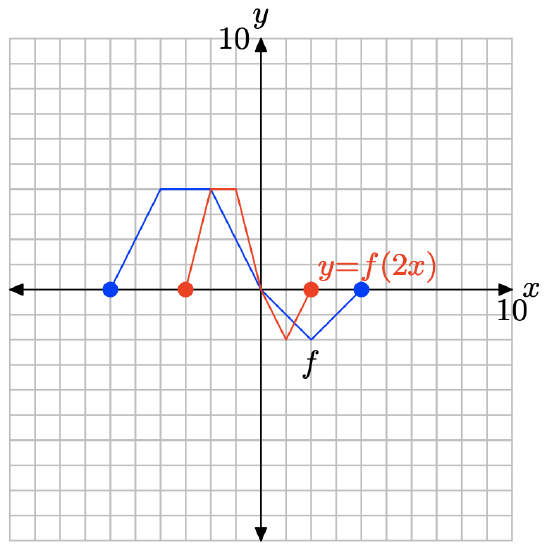
y = f(2x).
- Answer
-
To obtain a plot for y = f(2x), take each point on the graph of y = f(x) and divide its x-value by 2, keeping the y-value the same.
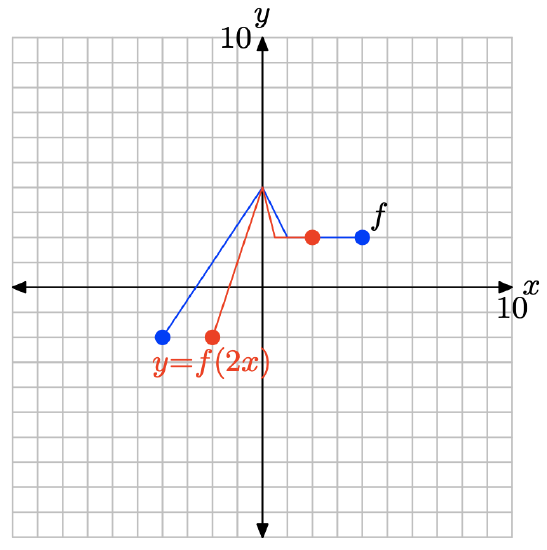
Note that replacing x with 2x, as in y = f(2x), compresses the graph of y = f(x) in the horizontal direction by a factor of 2.
y = f((1/2)x).
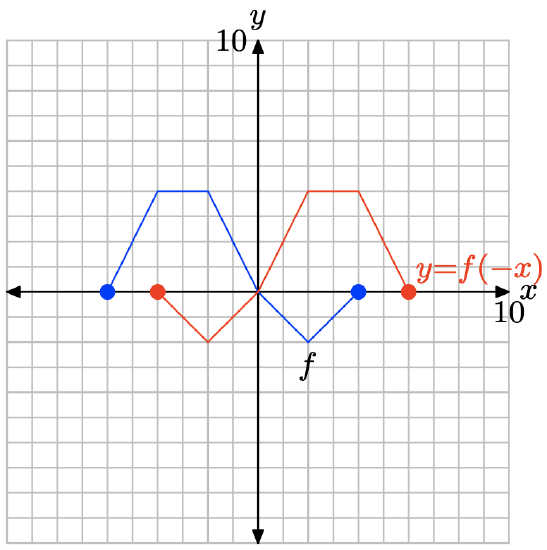
y = f(−x).
- Answer
-
To obtain a plot of y = f(−x), take each point on the graph of y = f(x) and negate its x-value, keeping the y-value the same.
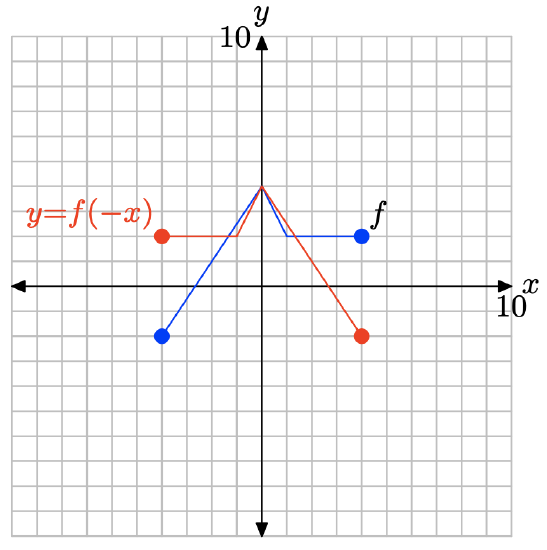
Note that replacing x with −x, as in y = f(−x), reflects the graph of f across the y-axis.
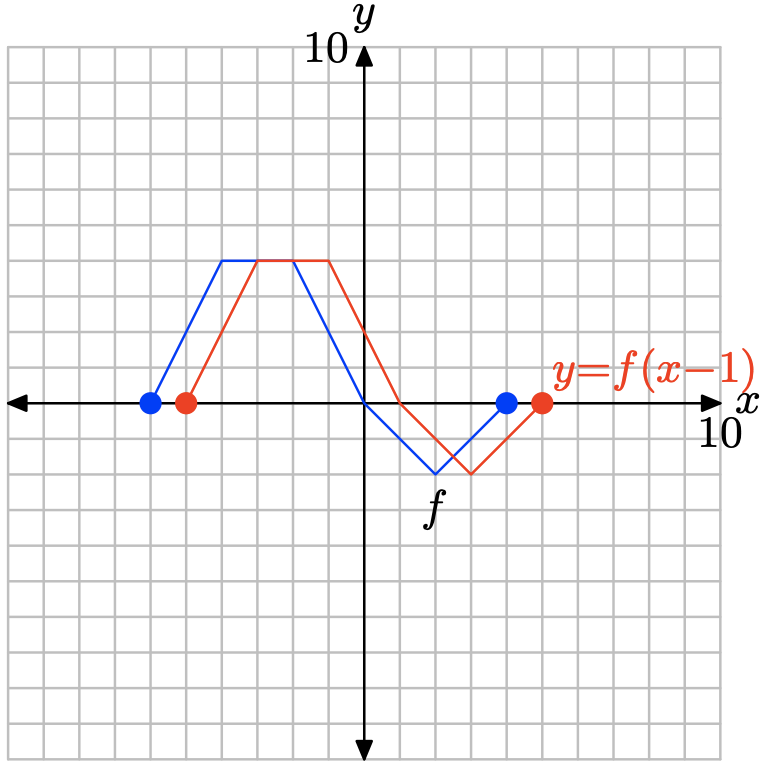
y = f(x − 1).
y = f(x + 3).
- Answer
-
To obtain a plot of y = f(x + 3), take each point on the graph of y = f(x) and subtract 3 from its x-value, keeping the y-value the same.
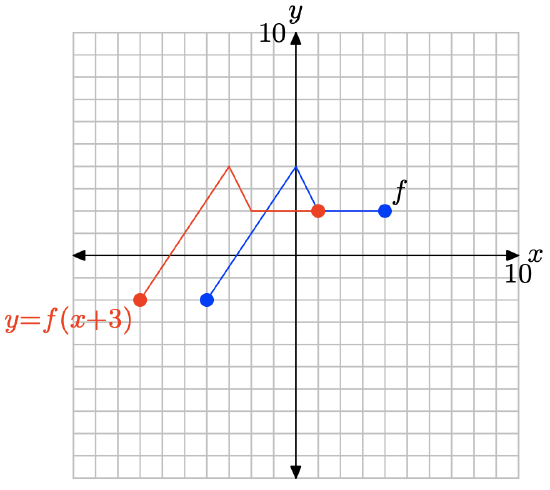
Note that replacing x with x + 3, as in y = f(x + 3), translates the graph of y = f(x) to the left 3 units.
y = f(x − 2).
Pictured below is the graph of a function f. In Exercises \(\PageIndex{23}\)-\(\PageIndex{28}\), use this graph to perform each of the following tasks.

i. Set up a coordinate system on a sheet of graph paper. Label and scale each axis. Make an exact copy of the graph of f on your coordinate system. Remember to draw all lines with a ruler.
ii. In the narrative, a shadow box at the end of the section summarizes the concepts and technique of horizontal scaling, horizontal reflection, and horizontal translation. Use the shortcut ideas presented in this summary shadow box to draw the graphs of the functions that follow without using tables.
iii. Use a different colored pencil to draw the graph of the function given in the exercise. Label this graph with its equation. Be sure that key points are accurately plotted. In each exercise, please plot exactly two plots per coordinate system, the graph of original function f and the graph of the function in the exercise.
y = f(2x).
- Answer
-
To obtain a plot of y = f(2x), take each point on the graph of y = f(x) and divide its x-value by 2, keeping the y-value the same.
Replacing x with 2x, as in y = f(2x), compresses the graph of y = f(x) horizontally by a factor of 2.
y = f((1/2)x).
y = f(−x).
- Answer
-
To obtain a plot of y = f(−x), take each point on the graph of y = f(x) and negate its x-value, keeping the same y-value.
Replacing x with −x, as in y = f(−x), reflects the graph of y = f(x) across the y-axis.
y = f(x + 3)
y= f(x − 2).
- Answer
-
To obtain a plot of y = f(x − 2), take each point on the graph of y = f(x) and add 2 to its x-value, keeping its y-value the same.
Replacing x with x − 2, as in y = f(x − 2), shifts the graph of y = f(x) to the right 2 units.
y = f(x + 1).