
9.1: The Square Root Function
- Page ID
- 19734

\( \newcommand{\vecs}[1]{\overset { \scriptstyle \rightharpoonup} {\mathbf{#1}} } \)
\( \newcommand{\vecd}[1]{\overset{-\!-\!\rightharpoonup}{\vphantom{a}\smash {#1}}} \)
\( \newcommand{\dsum}{\displaystyle\sum\limits} \)
\( \newcommand{\dint}{\displaystyle\int\limits} \)
\( \newcommand{\dlim}{\displaystyle\lim\limits} \)
\( \newcommand{\id}{\mathrm{id}}\) \( \newcommand{\Span}{\mathrm{span}}\)
( \newcommand{\kernel}{\mathrm{null}\,}\) \( \newcommand{\range}{\mathrm{range}\,}\)
\( \newcommand{\RealPart}{\mathrm{Re}}\) \( \newcommand{\ImaginaryPart}{\mathrm{Im}}\)
\( \newcommand{\Argument}{\mathrm{Arg}}\) \( \newcommand{\norm}[1]{\| #1 \|}\)
\( \newcommand{\inner}[2]{\langle #1, #2 \rangle}\)
\( \newcommand{\Span}{\mathrm{span}}\)
\( \newcommand{\id}{\mathrm{id}}\)
\( \newcommand{\Span}{\mathrm{span}}\)
\( \newcommand{\kernel}{\mathrm{null}\,}\)
\( \newcommand{\range}{\mathrm{range}\,}\)
\( \newcommand{\RealPart}{\mathrm{Re}}\)
\( \newcommand{\ImaginaryPart}{\mathrm{Im}}\)
\( \newcommand{\Argument}{\mathrm{Arg}}\)
\( \newcommand{\norm}[1]{\| #1 \|}\)
\( \newcommand{\inner}[2]{\langle #1, #2 \rangle}\)
\( \newcommand{\Span}{\mathrm{span}}\) \( \newcommand{\AA}{\unicode[.8,0]{x212B}}\)
\( \newcommand{\vectorA}[1]{\vec{#1}} % arrow\)
\( \newcommand{\vectorAt}[1]{\vec{\text{#1}}} % arrow\)
\( \newcommand{\vectorB}[1]{\overset { \scriptstyle \rightharpoonup} {\mathbf{#1}} } \)
\( \newcommand{\vectorC}[1]{\textbf{#1}} \)
\( \newcommand{\vectorD}[1]{\overrightarrow{#1}} \)
\( \newcommand{\vectorDt}[1]{\overrightarrow{\text{#1}}} \)
\( \newcommand{\vectE}[1]{\overset{-\!-\!\rightharpoonup}{\vphantom{a}\smash{\mathbf {#1}}}} \)
\( \newcommand{\vecs}[1]{\overset { \scriptstyle \rightharpoonup} {\mathbf{#1}} } \)
\(\newcommand{\longvect}{\overrightarrow}\)
\( \newcommand{\vecd}[1]{\overset{-\!-\!\rightharpoonup}{\vphantom{a}\smash {#1}}} \)
\(\newcommand{\avec}{\mathbf a}\) \(\newcommand{\bvec}{\mathbf b}\) \(\newcommand{\cvec}{\mathbf c}\) \(\newcommand{\dvec}{\mathbf d}\) \(\newcommand{\dtil}{\widetilde{\mathbf d}}\) \(\newcommand{\evec}{\mathbf e}\) \(\newcommand{\fvec}{\mathbf f}\) \(\newcommand{\nvec}{\mathbf n}\) \(\newcommand{\pvec}{\mathbf p}\) \(\newcommand{\qvec}{\mathbf q}\) \(\newcommand{\svec}{\mathbf s}\) \(\newcommand{\tvec}{\mathbf t}\) \(\newcommand{\uvec}{\mathbf u}\) \(\newcommand{\vvec}{\mathbf v}\) \(\newcommand{\wvec}{\mathbf w}\) \(\newcommand{\xvec}{\mathbf x}\) \(\newcommand{\yvec}{\mathbf y}\) \(\newcommand{\zvec}{\mathbf z}\) \(\newcommand{\rvec}{\mathbf r}\) \(\newcommand{\mvec}{\mathbf m}\) \(\newcommand{\zerovec}{\mathbf 0}\) \(\newcommand{\onevec}{\mathbf 1}\) \(\newcommand{\real}{\mathbb R}\) \(\newcommand{\twovec}[2]{\left[\begin{array}{r}#1 \\ #2 \end{array}\right]}\) \(\newcommand{\ctwovec}[2]{\left[\begin{array}{c}#1 \\ #2 \end{array}\right]}\) \(\newcommand{\threevec}[3]{\left[\begin{array}{r}#1 \\ #2 \\ #3 \end{array}\right]}\) \(\newcommand{\cthreevec}[3]{\left[\begin{array}{c}#1 \\ #2 \\ #3 \end{array}\right]}\) \(\newcommand{\fourvec}[4]{\left[\begin{array}{r}#1 \\ #2 \\ #3 \\ #4 \end{array}\right]}\) \(\newcommand{\cfourvec}[4]{\left[\begin{array}{c}#1 \\ #2 \\ #3 \\ #4 \end{array}\right]}\) \(\newcommand{\fivevec}[5]{\left[\begin{array}{r}#1 \\ #2 \\ #3 \\ #4 \\ #5 \\ \end{array}\right]}\) \(\newcommand{\cfivevec}[5]{\left[\begin{array}{c}#1 \\ #2 \\ #3 \\ #4 \\ #5 \\ \end{array}\right]}\) \(\newcommand{\mattwo}[4]{\left[\begin{array}{rr}#1 \amp #2 \\ #3 \amp #4 \\ \end{array}\right]}\) \(\newcommand{\laspan}[1]{\text{Span}\{#1\}}\) \(\newcommand{\bcal}{\cal B}\) \(\newcommand{\ccal}{\cal C}\) \(\newcommand{\scal}{\cal S}\) \(\newcommand{\wcal}{\cal W}\) \(\newcommand{\ecal}{\cal E}\) \(\newcommand{\coords}[2]{\left\{#1\right\}_{#2}}\) \(\newcommand{\gray}[1]{\color{gray}{#1}}\) \(\newcommand{\lgray}[1]{\color{lightgray}{#1}}\) \(\newcommand{\rank}{\operatorname{rank}}\) \(\newcommand{\row}{\text{Row}}\) \(\newcommand{\col}{\text{Col}}\) \(\renewcommand{\row}{\text{Row}}\) \(\newcommand{\nul}{\text{Nul}}\) \(\newcommand{\var}{\text{Var}}\) \(\newcommand{\corr}{\text{corr}}\) \(\newcommand{\len}[1]{\left|#1\right|}\) \(\newcommand{\bbar}{\overline{\bvec}}\) \(\newcommand{\bhat}{\widehat{\bvec}}\) \(\newcommand{\bperp}{\bvec^\perp}\) \(\newcommand{\xhat}{\widehat{\xvec}}\) \(\newcommand{\vhat}{\widehat{\vvec}}\) \(\newcommand{\uhat}{\widehat{\uvec}}\) \(\newcommand{\what}{\widehat{\wvec}}\) \(\newcommand{\Sighat}{\widehat{\Sigma}}\) \(\newcommand{\lt}{<}\) \(\newcommand{\gt}{>}\) \(\newcommand{\amp}{&}\) \(\definecolor{fillinmathshade}{gray}{0.9}\)In this section we turn our attention to the square root function, the function defined by the equation
\[\begin{array}{c} {f(x)= \sqrt{x}}\\ \end{array} \nonumber \]
We begin the section by drawing the graph of the function, then we address the domain and range. After that, we’ll investigate a number of different transformations of the function.
The Graph of the Square Root Function
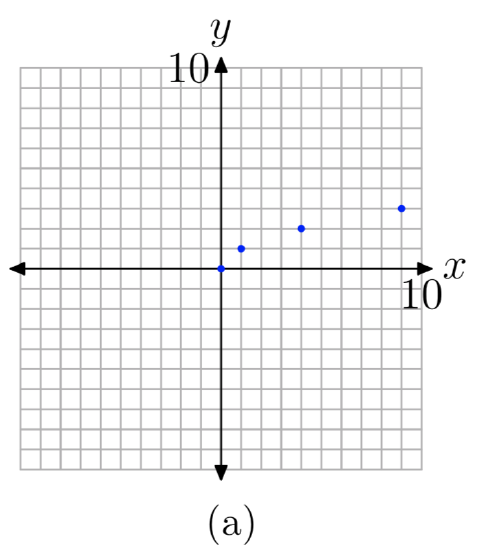
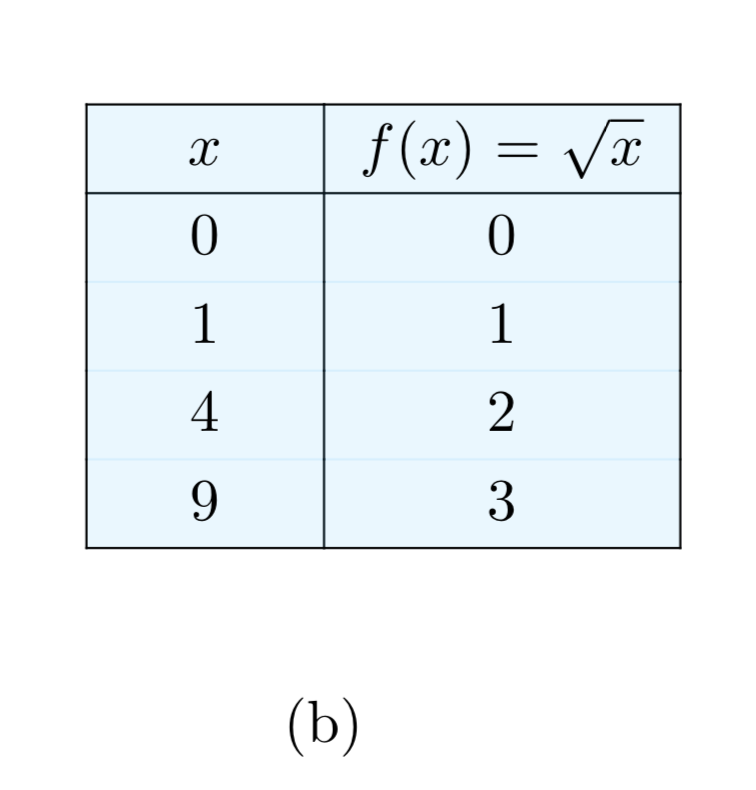
Let’s create a table of points that satisfy the equation of the function, then plot the points from the table on a Cartesian coordinate system on graph paper. We’ll continue creating and plotting points until we are convinced of the eventual shape of the graph.
We know we cannot take the square root of a negative number. Therefore, we don’t want to put any negative x-values in our table. To further simplify our computations, let’s use numbers whose square root is easily calculated. This brings to mind perfect squares such as 0, 1, 4, 9, and so on. We’ve placed these numbers as x-values in the table in Figure 1(b), then calculated the square root of each. In Figure 1(a), you see each of the points from the table plotted as a solid dot. If we continue to add points to the table, plot them, the graph will eventually fill in and take the shape of the solid curve shown in Figure 1(c).

The point plotting approach used to draw the graph of \(f(x) = \sqrt{x}\) in Figure 1 is a tested and familiar procedure. However, a more sophisticated approach involves the theory of inverses developed in the previous chapter.
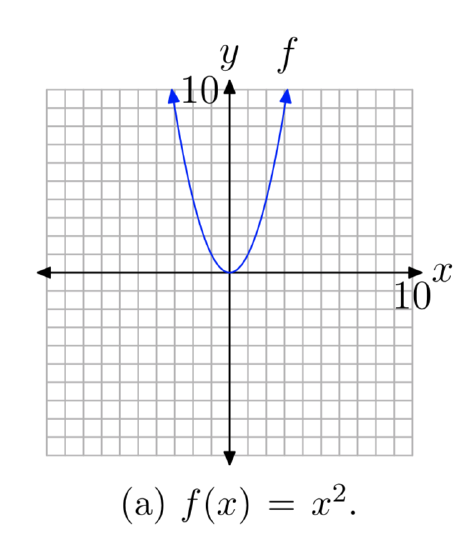
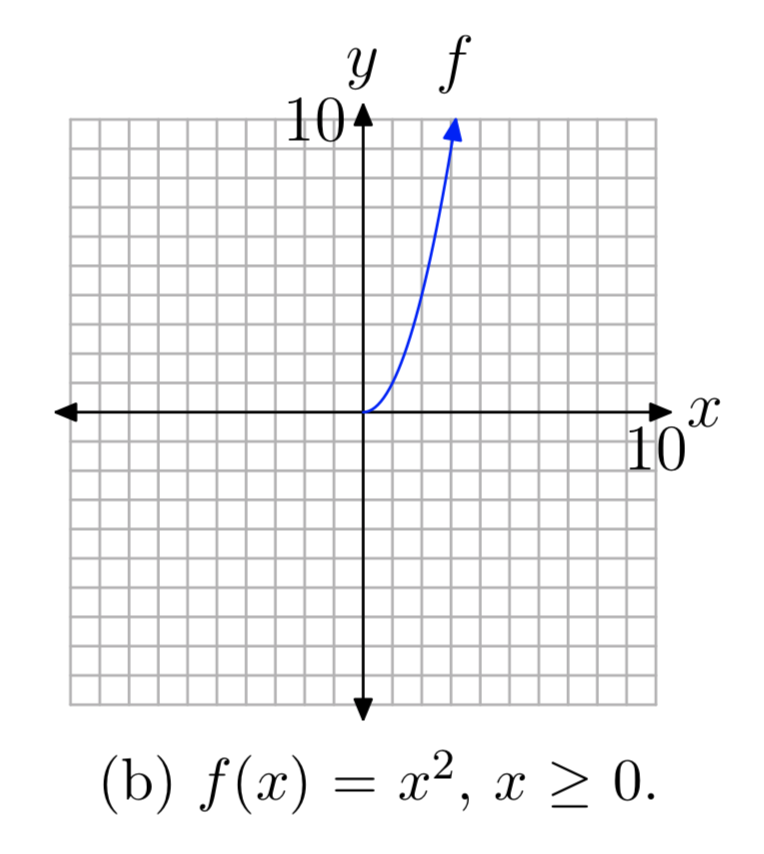
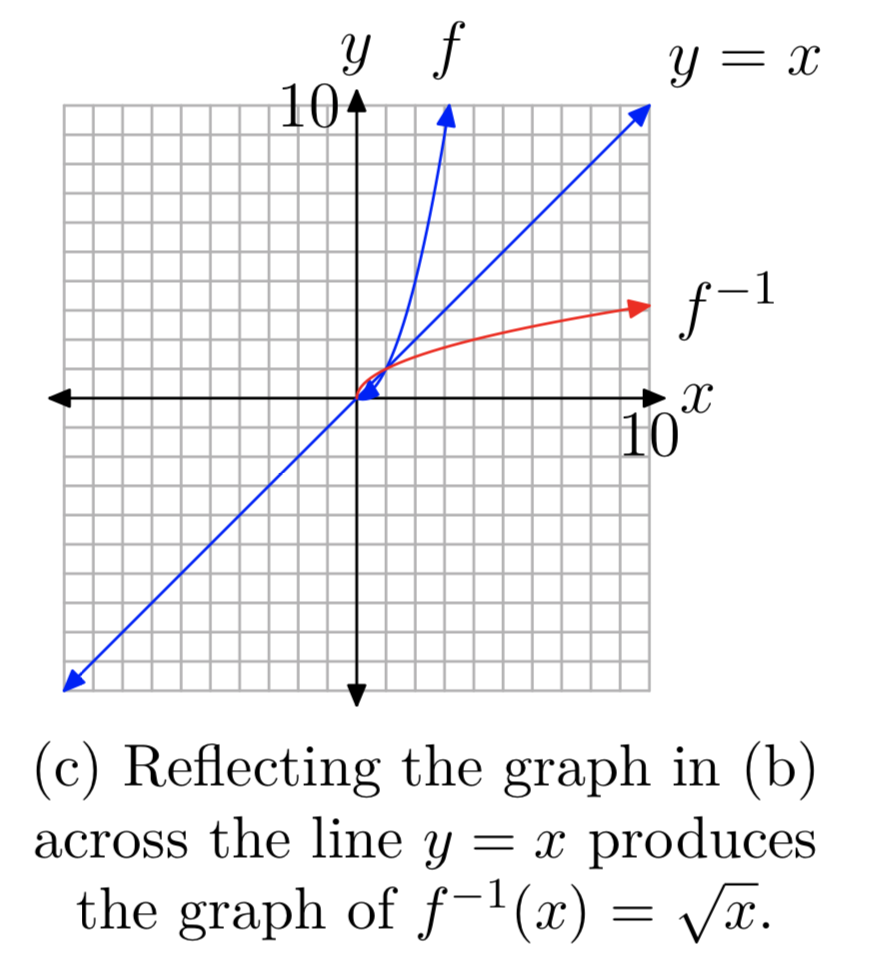
In a sense, taking the square root is the “inverse” of squaring. Well, not quite, as the squaring function \(f(x) = x^2\) in Figure 2(a) fails the horizontal line test and is not one-to-one. However, if we limit the domain of the squaring function, then the graph of \(f(x) = x^2\) in Figure 2(b), where \(x \ge 0\), does pass the horizontal line test and is one-to-one. Therefore, the graph of \(f(x) = x^2\), \(x \ge 0\), has an inverse, and the graph of its inverse is found by reflecting the graph of \(f(x) = x^2\), \(x \ge 0\), across the line y = x (see Figure 2(c)).
To find the equation of the inverse, recall that the procedure requires that we switch the roles of x and y, then solve the resulting equation for y. Thus, first write \(f(x) = x^2\), \(x \ge 0\), in the form
\[\begin{array}{c} {y = x^2, x \ge 0}\\ \nonumber \end{array} \nonumber \]
Next, switch x and y.
\[\begin{array}{c} {x = y^2, y \ge 0}\\ \end{array} \nonumber \]
When we solve this last equation for y, we get two solutions,
\[\begin{array}{c} {y = \pm\sqrt{x}}\\ \end{array} \nonumber \]
However, in equation (2), note that y must be greater than or equal to zero. Hence, we must choose the nonnegative answer in equation (3), so the inverse of \(f(x) = x^2\), \(x \ge 0\), has equation
\[\begin{array}{c} {f^{−1}(x) = \sqrt{x}}\\ \nonumber \end{array} \nonumber \]
This is the equation of the reflection of the graph of \(f(x) = x^2\), \(x \ge 0\), that is pictured in Figure 2(c). Note the exact agreement with the graph of the square root function in Figure 1(c).
The sequence of graphs in Figure 2 also help us identify the domain and range of the square root function.
- In Figure 2(a), the parabola opens outward indefinitely, both left and right. Consequently, the domain is \(D_{f} = (−\infty, \infty)\), or all real numbers. Also, the graph has vertex at the origin and opens upward indefinitely, so the range is \(R_{f} = [0, \infty)\).
- In Figure 2(b), we restricted the domain. Thus, the graph of \(f(x) = x^2\), \(x \ge 0\), now has domain \(D_{f} = [0, \infty)\). The range is unchanged and is \(R_{f} = [0, \infty)\).
- In Figure 2(c), we’ve reflected the graph of \(f(x) = x^2\), \(x \ge 0\), across the line y = x to obtain the graph of \(f^{−1}(x) = \sqrt{x}\). Because we’ve interchanged the role of x and y, the domain of the square root function must equal the range of \(f(x) = x^2\), \(x \ge 0\). That is, \(D_{f^{−1}} =[0,\infty)\).Similarly,the range of the square root function must equal the domain of \(f(x) = x^2\), \(x \ge 0\). Hence, \(R_{f^{−1}} = [0,\infty)\).
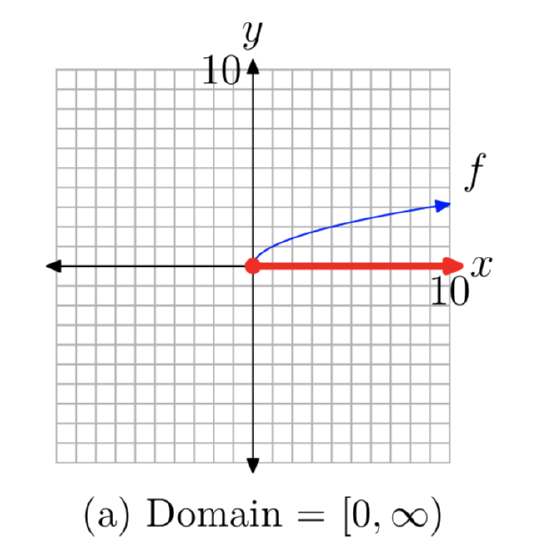
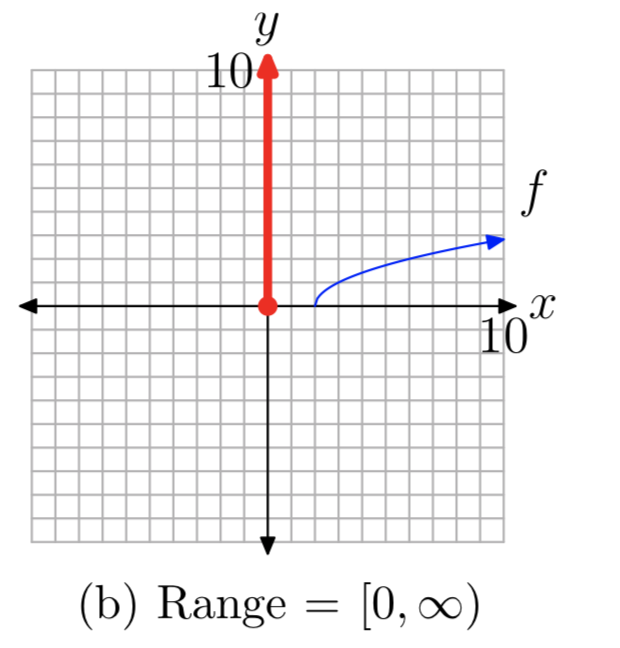
Of course, we can also determine the domain and range of the square root function by projecting all points on the graph onto the x- and y-axes, as shown in Figures 3(a) and (b), respectively.
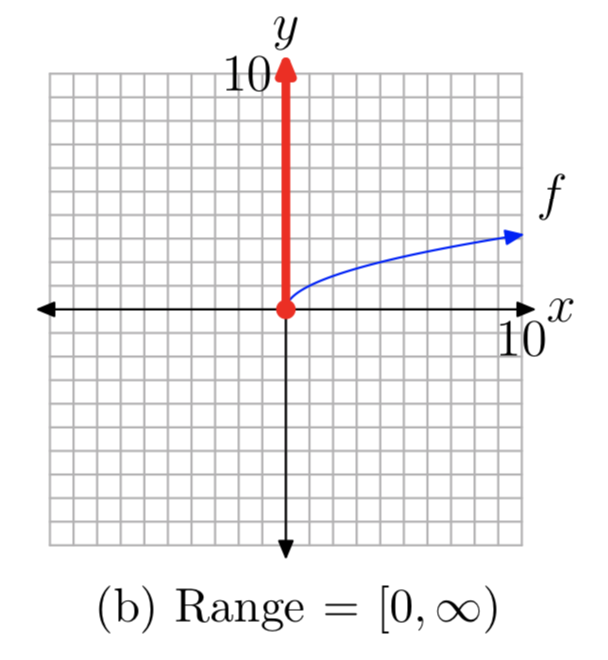
Some might object to the range, asking “How do we know that the graph of the square root function picture in Figure 3(b) rises indefinitely?” Again, the answer lies in the sequence of graphs in Figure 2. In Figure 2(c), note that the graph of \(f(x) = x^2\), \(x \ge 0\), opens indefinitely to the right as the graph rises to infinity. Hence, after reflecting this graph across the line y = x, the resulting graph must rise upward indefinitely as it moves to the right. Thus, the range of the square root function is \([0, \infty)\).
Translations
If we shift the graph of \(y = \sqrt{x}\) right and left, or up and down, the domain and/or range are affected.
Sketch the graph of \(f(x) = \sqrt{x−2}\). Use your graph to determine the domain and range.
We know that the basic equation \(y=\sqrt{x}\) has the graph shown in Figures 1(c). If we replace x with x−2, the basic equation \(y=\sqrt{x}\) becomes \(f(x) = \sqrt{x−2}\). From our previous work with geometric transformations, we know that this will shift the graph two units to the right, as shown in Figures 4 (a) and (b).
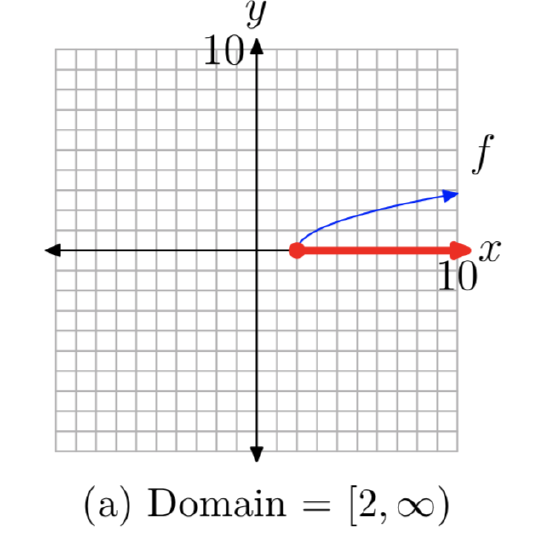
To find the domain, we project each point on the graph of f onto the x-axis, as shown in Figure 4(a). Note that all points to the right of or including 2 are shaded on the x-axis. Consequently, the domain of f is
Domain = \([2, \infty)\) = {x: \(x \ge 0\)}
As there has been no shift in the vertical direction, the range remains the same. To find the range, we project each point on the graph onto the y-axis, as shown in Figure 4(b). Note that all points at and above zero are shaded on the y-axis. Thus, the range of f is
Range = \([0,\infty)\)= {y: \(y \ge 0\)}.
We can find the domain of this function algebraically by examining its defining equation \(f(x) = \sqrt{x−2}\). We understand that we cannot take the square root of a negative number. Therefore, the expression under the radical must be nonnegative (positive or zero). That is,
\(x − 2 \ge 0\).
Solving this inequality for x,
\(x \ge 2\).
Thus, the domain of f is Domain = \([2, \infty)\), which matches the graphical solution above.
Let’s look at another example.
Sketch the graph of \(f (x) = \sqrt{x + 4} + 2\). Use your graph to determine the domain and range of f.
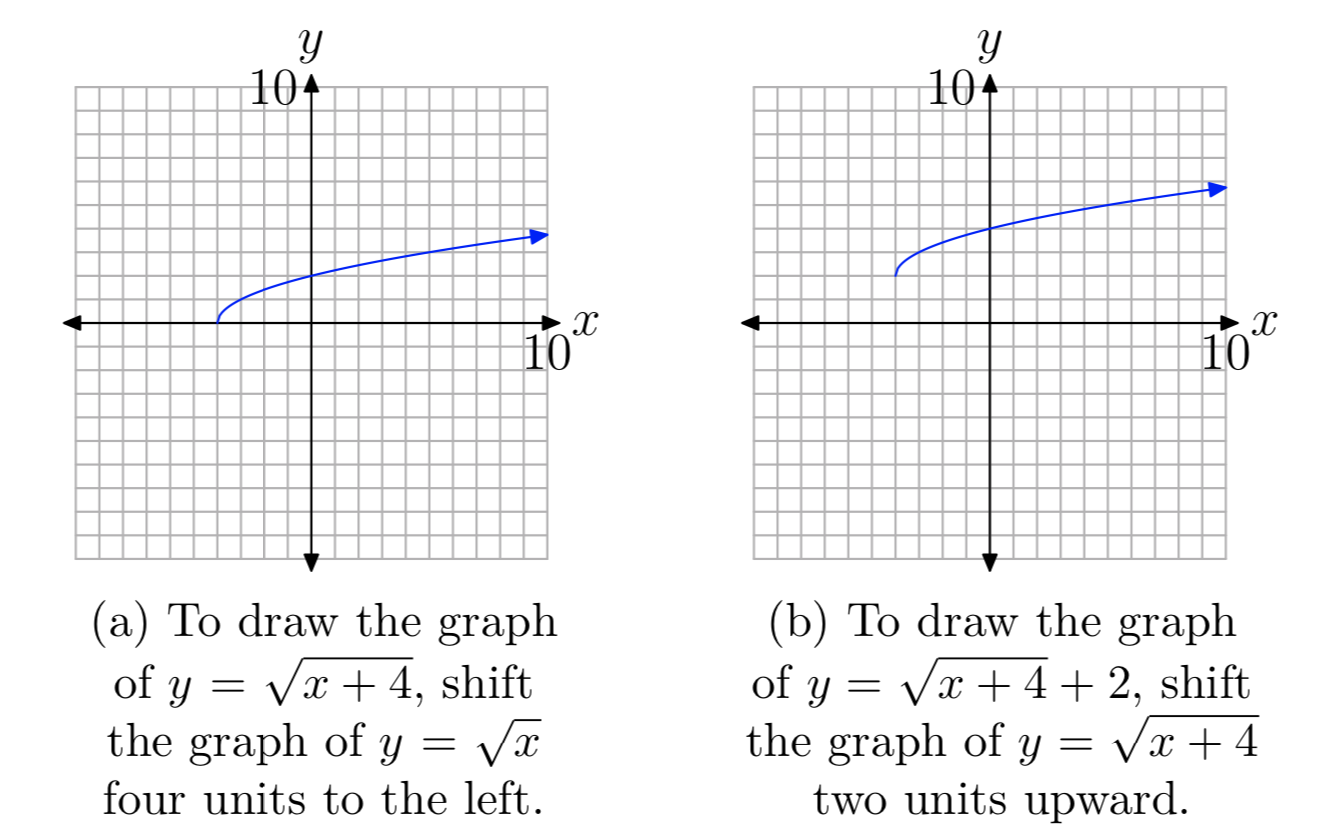
Again, we know that the basic equation \(y=\sqrt{x}\) has the graph shown in Figure 1(c). If we replace x with x+4, the basic equation \(y=\sqrt{x}\) becomes \(y=\sqrt{x+4}\). From our previous work with geometric transformations, we know that this will shift the graph of \(y=\sqrt{x}\) four units to the left, as shown in Figure 5(a).
If we know add 2 to the equation \(y=\sqrt{x+4}\) to produce the equation \(y=\sqrt{x+4} + 2\), this will shift the graph of \(y=\sqrt{x+4}\) two units upward, as shown in Figure 5(b).
To identify th domain of the \(f (x) = \sqrt{x + 4} + 2\), we project all points on the graph of f onto the x-axis, as shown in Figure 6(a). Note that all points to the right of or including −4 are shaded on the x-axis. Thus, the domain of \(f (x) = \sqrt{x + 4} + 2\) is
Domain = \([−4, \infty)\) = {x: \(x \ge −4\)}
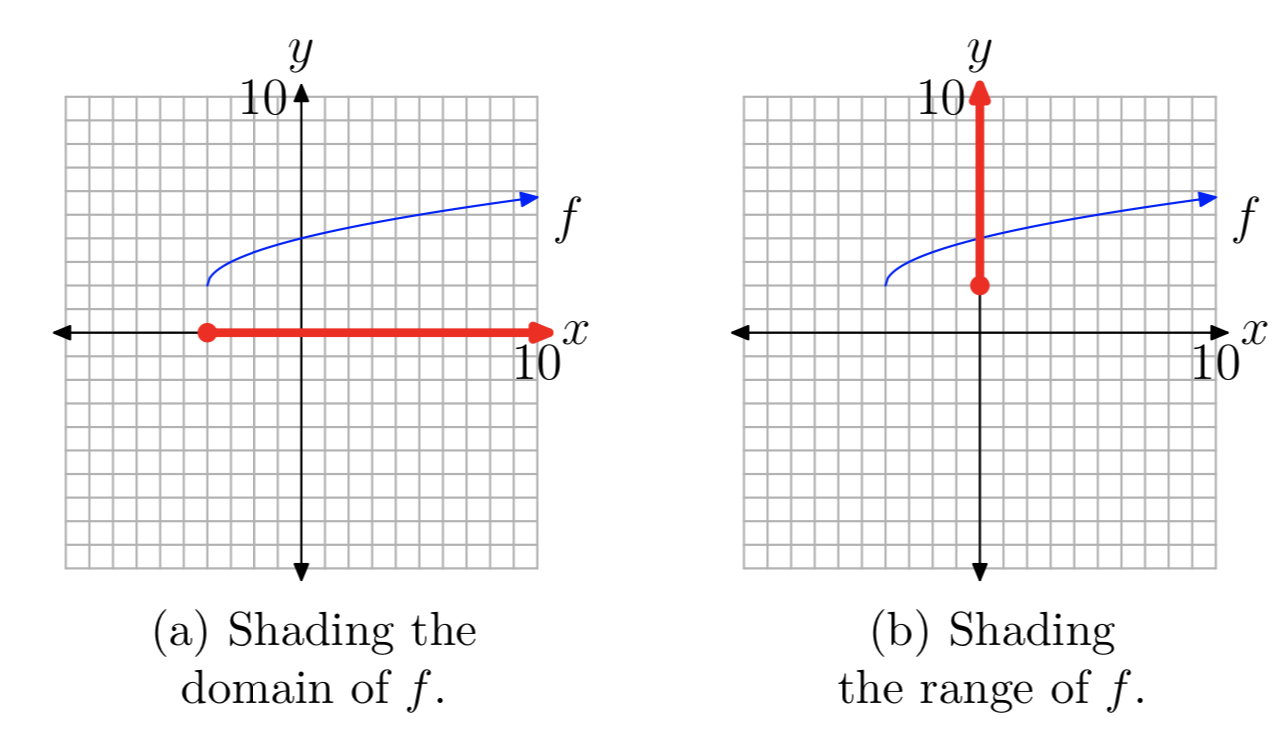
Similarly, to find the range of f, project all points on the graph of f onto the y-axis, as shown in Figure 6(b). Note that all points on the y-axis greater than or including 2 are shaded. Consequently, the range of f is
Range = \([2, \infty)\) = {y: \(y \ge 2\)}
We can also find the domain of f algebraically by examining the equation \(f (x) = \sqrt{x + 4} + 2\). We cannot take the square root of a negative number, so the expression under the radical must be nonnegative (zero or positive). Consequently,
\(x + 4 \ge 0\).
Solving this inequality for x,
\(x \ge −4\).
Thus, the domain of f is Domain = \([−4,\infty)\), which matches the graphical solution presented above.
Reflections
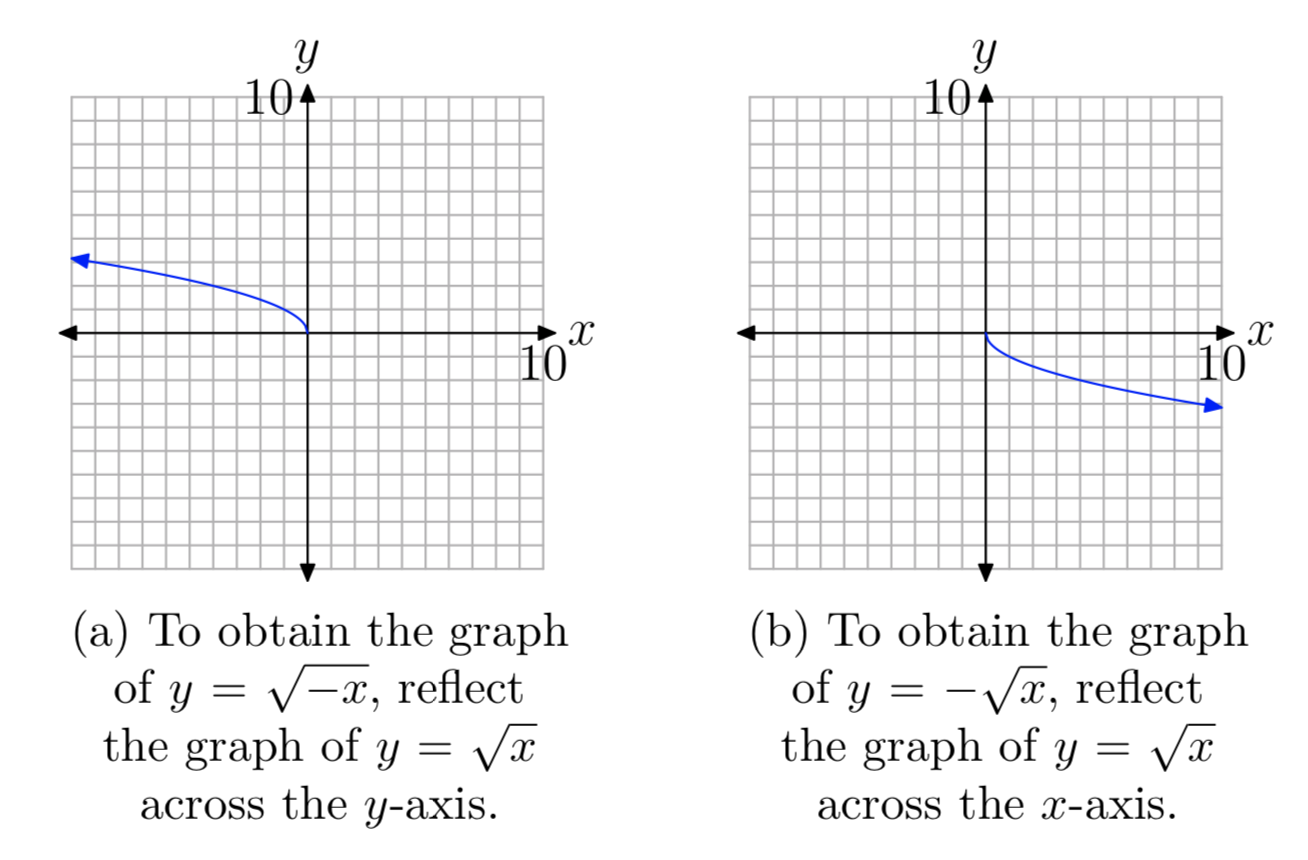
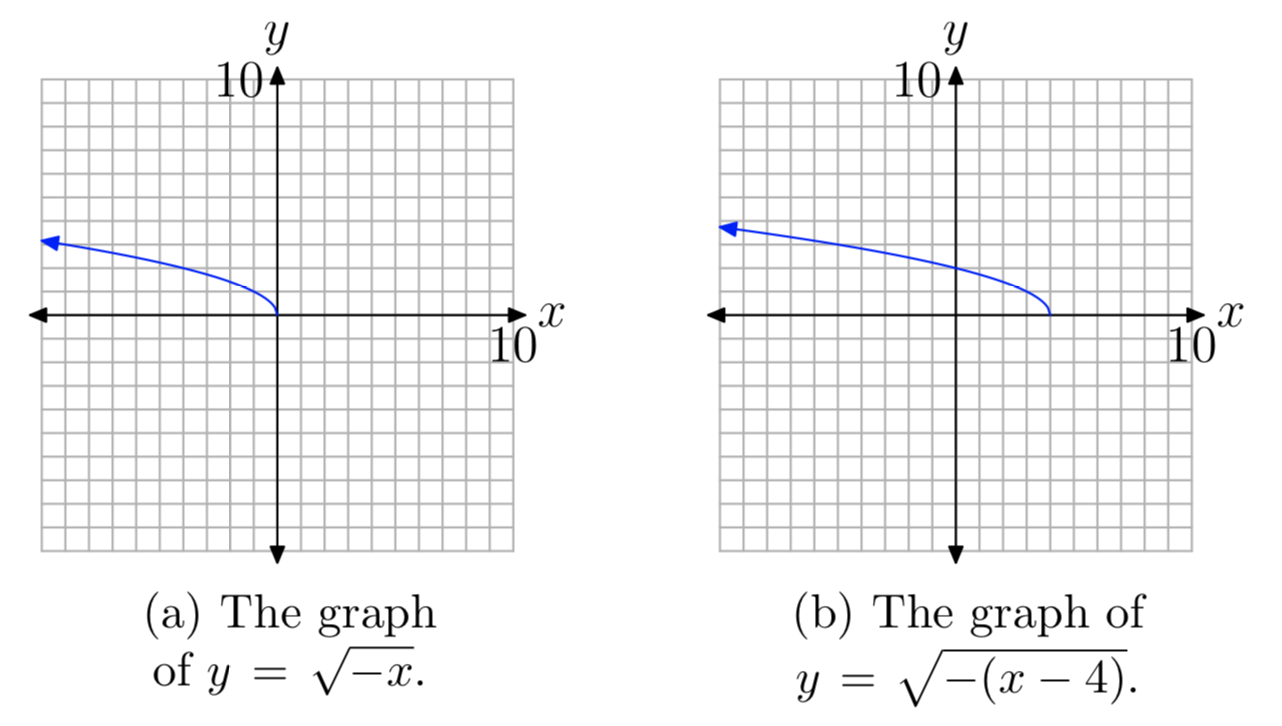
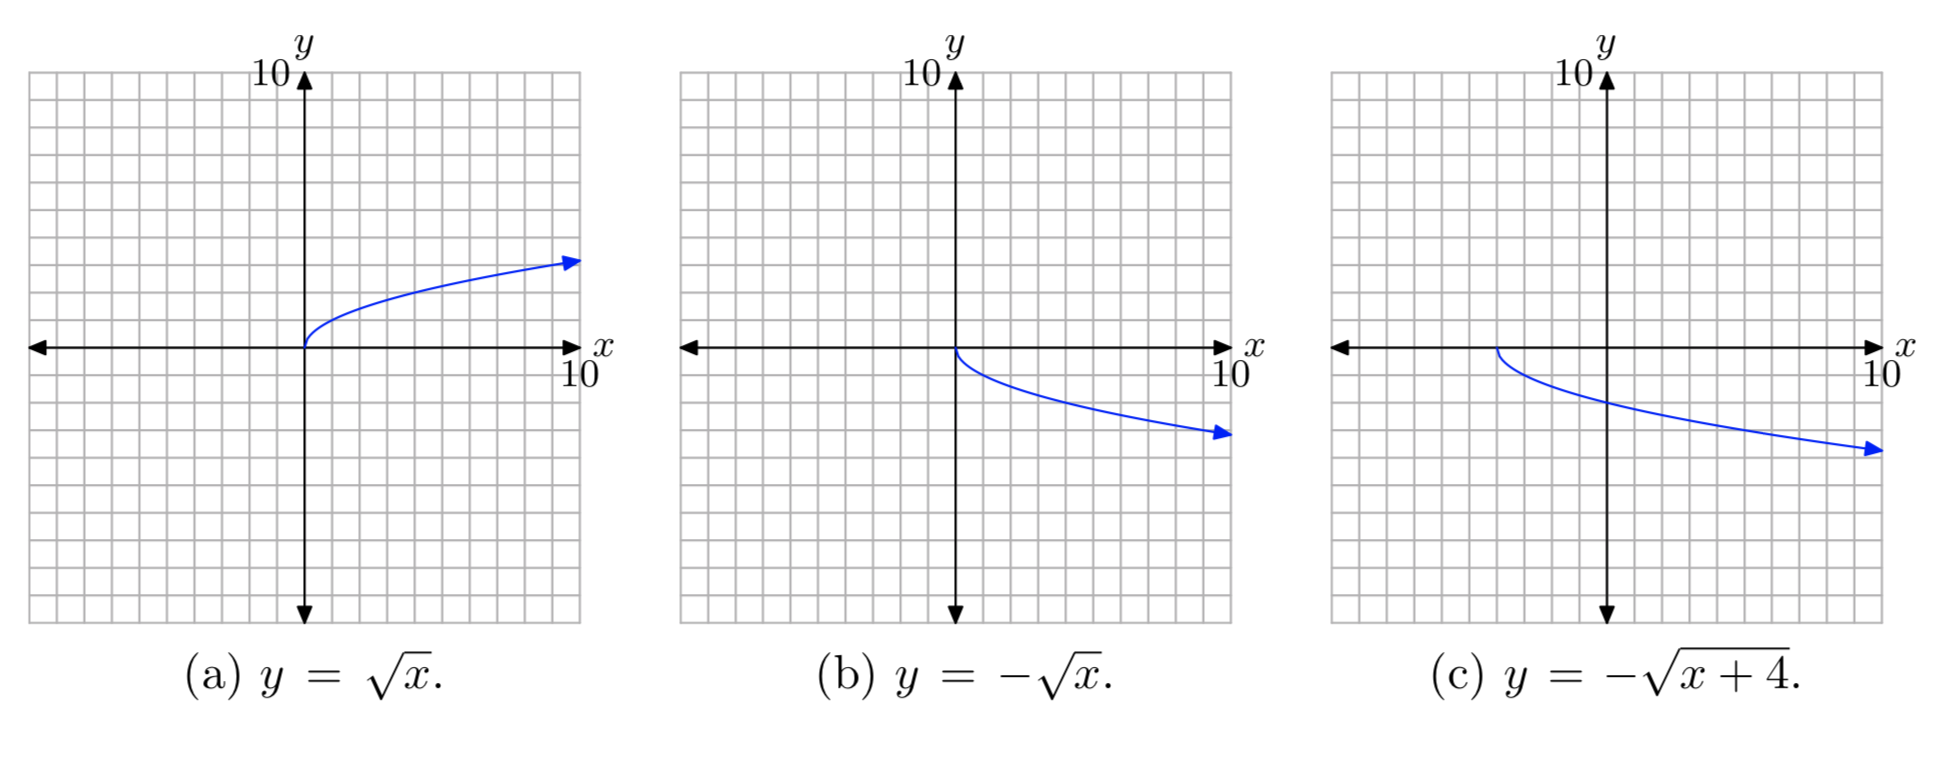
If we start with the basic equation \(y = \sqrt{x}\), then replace x with −x, then the graph of the resulting equation \(y = \sqrt{−x}\) is captured by reflecting the graph of \(y = \sqrt{x}\) (see Figure 1(c)) horizontally across the y-axis. The graph of \(y = \sqrt{−x}\) is shown in Figure 7(a).
Similarly, the graph of \(y = −\sqrt{x}\) would be a vertical reflection of the graph of \(y = \sqrt{x}\) across the x-axis, as shown in Figure 7(b).
More often than not, you will be asked to perform a reflection and a translation.
Sketch the graph of \(f(x) = \sqrt{4− x}\). Use the resulting graph to determine the domain and range of f.
First, rewrite the equation \(f(x) = \sqrt{4− x}\) as follows:
\(f(x) = \sqrt{−(x−4)}\)
Reflections First. It is usually more intuitive to perform reflections before translations.
With this thought in mind, we first sketch the graph of \(f(x) = \sqrt{−x}\), which is a reflection of the graph of \(f(x) = \sqrt{x}\) across the y-axis. This is shown in Figure 8(a).
Now, in \(f(x) = \sqrt{−x}\) replace x with x−4 to obtain \(f(x) = \sqrt{−(x−4)}\). This shifts the graph of \(f(x) = \sqrt{−x}\) four units to the right, as pictured in Figure 8(b).
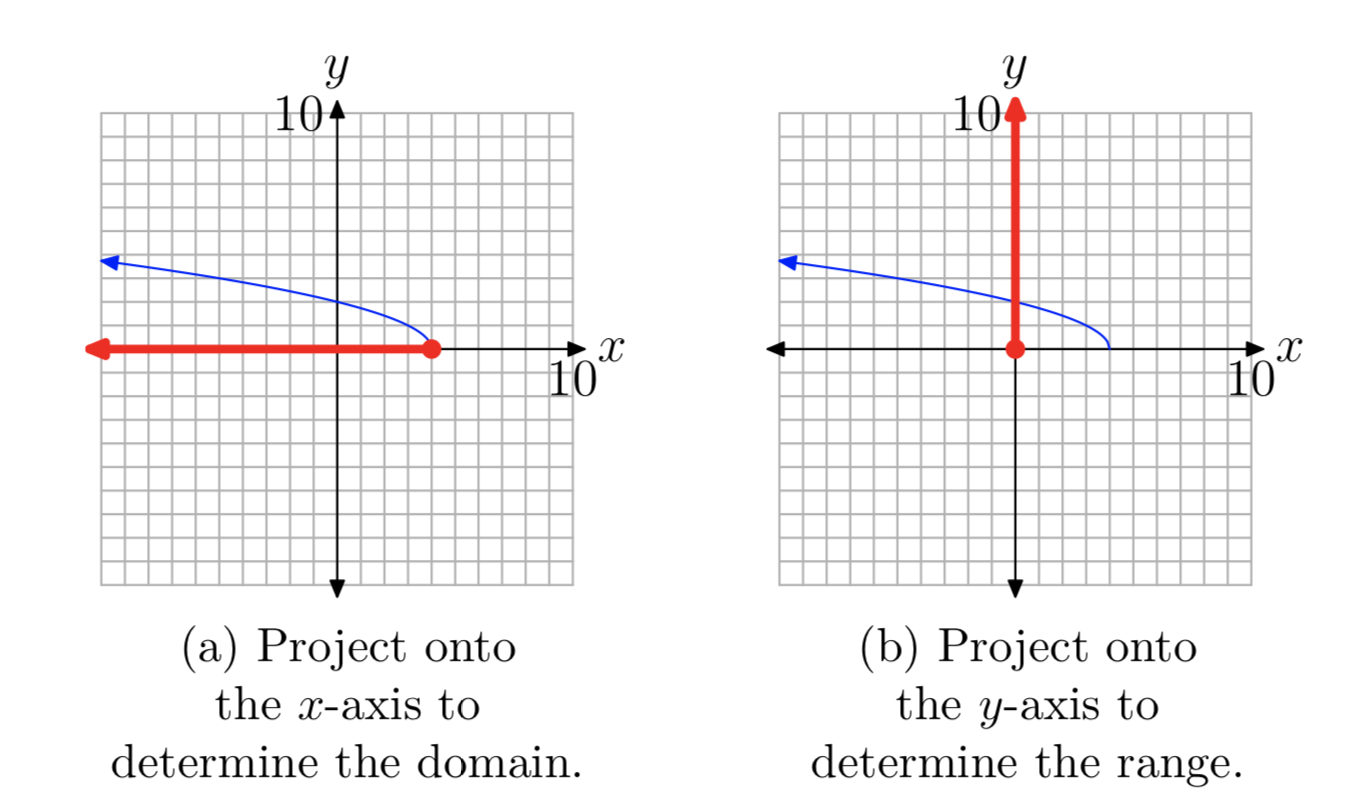
To find the domain of the function \(f(x) = \sqrt{−(x−4)}\), or equivalently, \(f(x) = \sqrt{4−x}\), project each point on the graph of f onto the x-axis, as shown in Figure 9(a). Note that all real numbers less than or equal to 4 are shaded on the x-axis. Hence, the domain of f is
Domain = \((−\infty, 4]\) = {x: \(x \le 4\)}.
Similarly, to obtain the range of f, project each point on the graph of f onto they-axis, as shown in Figure 9(b). Note that all real numbers greater than or equal to zero are shaded on the y-axis. Hence, the range of f is
Range = \([0,\infty)\) = {x: \(x \ge 0\)}.
We can also find the domain of the function f by examining the equation \(f(x) = \sqrt{4−x}\). We cannot take the square root of a negative number, so the expression under the radical must be nonnegative (zero or positive). Consequently,
\(4 − x \ge 0\).
Solve this last inequality for x. First subtract 4 from both sides of the inequality, then multiply both sides of the resulting inequality by −1. Of course, multiplying by a negative number reverses the inequality symbol.
\(−x \ge −4\)
\(x \le 4\)
Thus, the domain of f is {x: \(x \le 4\)}. In interval notation, Domain = \((−\infty, 4]\). This agree nicely with the graphical result found above.
More often than not, it will take a combination of your graphing calculator and a little algebraic manipulation to determine the domain of a square root function.
Sketch the graph of \(f(x) = \sqrt{5−2x}\) Use the graph and an algebraic technique to determine the domain of the function.
Load the function into Y1 in the Y= menu of your calculator, as shown in Figure 10(a). Select 6:ZStandard from the ZOOM menu to produce the graph shown in Figure 10(b).
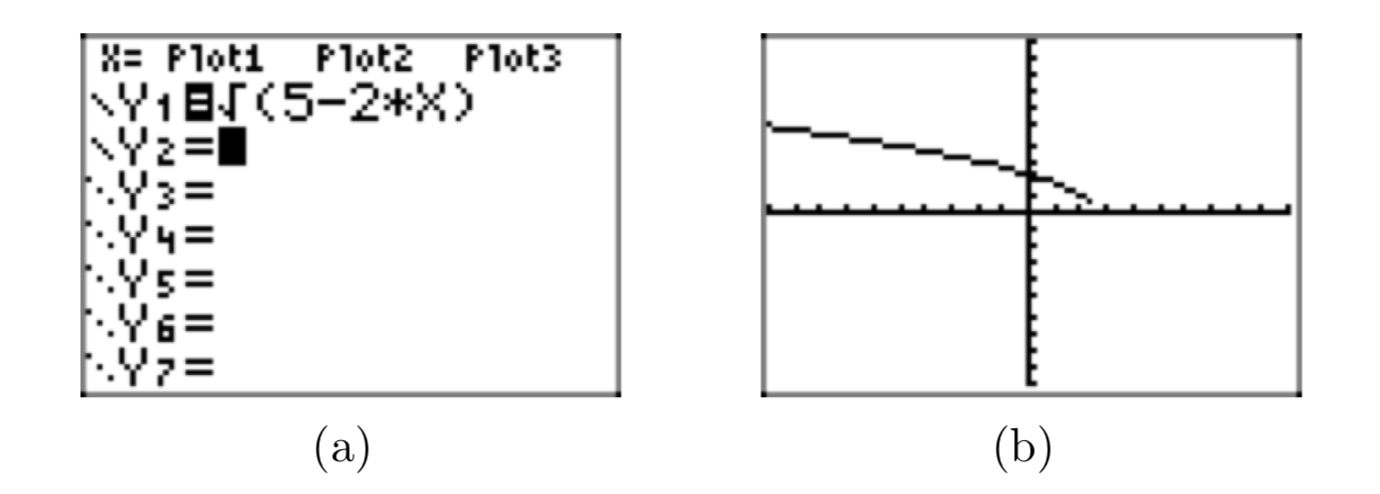
Look carefully at the graph in Figure 10(b) and note that it’s difficult to tell if the graph comes all the way down to “touch” the x-axis near \(x \approx 2.5\). However, our previous experience with the square root function makes us believe that this is just an artifact of insufficient resolution on the calculator that is preventing the graph from “touching” the x-axis at \(x \approx 2.5\).
An algebraic approach will settle the issue. We can determine the domain of f by examine the equation \(f(x) = \sqrt{5 − 2x}\). Consequently, We cannot take the square root of a negative number, so the expression under the radical must be nonnegative (zero or positive).
\(5 − 2x \ge 0\).
Solve this last inequality for x. First, subtract 5 from both sides of the inequality.
\(−2x \ge −5\).
Next, divide both sides of this last inequality by −2. Remember that we must reverse the inequality the moment we divide by a negative number.
\(\frac{−2x}{−2} \le \frac{−5}{−2}\).
\(x \le \frac{5}{2}\).
Thus, the domain of f is {x: \(x \le \frac{5}{2}\)}. In interval notation, Domain = \((−\infty, \frac{5}{2}]\). This agree nicely with the graphical result found above.
Further introspection reveals that this argument also settles the issue of whether or not the graph “touches” the x-axis at \(x= \frac{5}{2}\). If you remain unconvinced, then substitute \(x=\frac{5}{2}\) in \(f(x) = \sqrt{5−2x}\) to see
\(f(\frac{5}{2})= \sqrt{5−2(\frac{5}{2})} =\sqrt{0} = 0\).
Thus, the graph of f “touches” the x-axis at the point \((\frac{5}{2}, 0)\).
In Exercise 1-10, complete each of the following tasks:
- Set up a coordinate system on a sheet of graph paper. Label and scale each axis.
- Complete the table of points for the given function. Plot each of the points on your coordinate system, then use them to help draw the graph of the given function.
- Use different colored pencils to project all points onto the x- and y-axes to determine the domain and range. Use interval notation to describe the do- main of the given function.
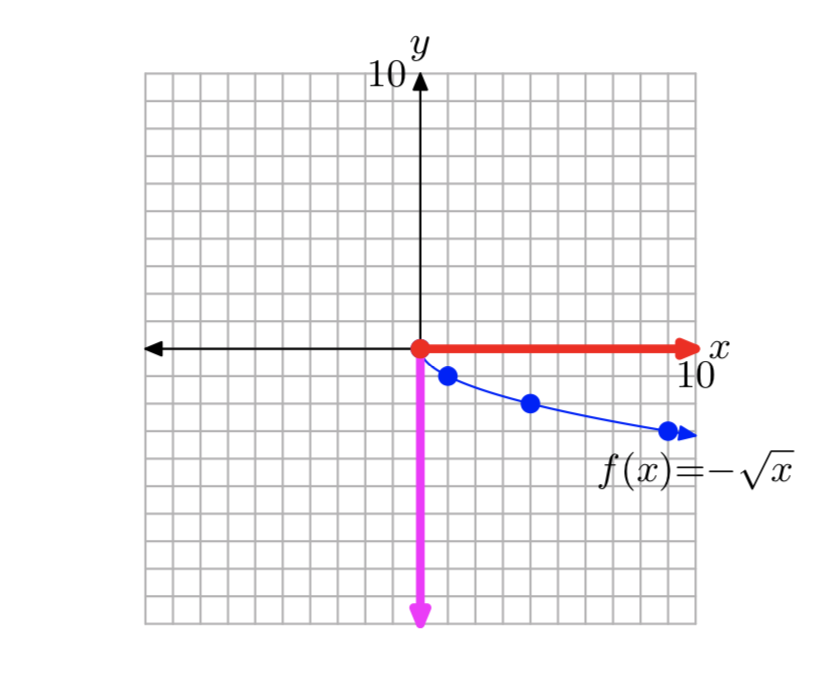
\(f(x) = −\sqrt{x}\)
|
x |
0 |
1 |
4 |
9 |
|
f (x) |
- Answer
-
x
0
1
4
9
f (x)
0
−1
−2
−3
Plot the points in the table and use them to help draw the graph.
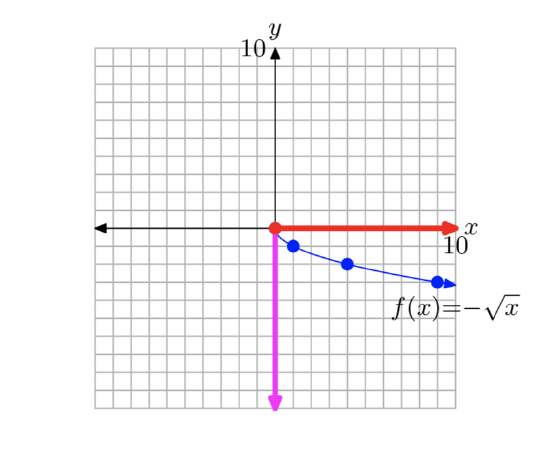
Project all points on the graph onto the x-axis to determine the domain: Domain = \([0, \infty)\). Project all points on the graph onto the y-axis to determine the range: Range = \((−\infty, 0]\).
\(f(x) = \sqrt{−x}\)
|
x |
0 |
−1 |
−4 |
−9 |
|
f (x) |
\(f(x)= \sqrt{x+2}\)
|
x |
−2 |
−1 |
2 |
7 |
|
f (x) |
- Answer
-
x
−2
−1
2
7
f (x)
0
1
2
3
Plot the points in the table and use them to help draw the graph.
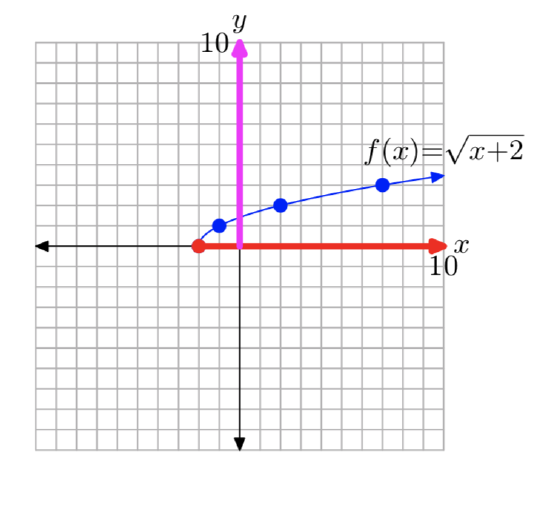
Project all points on the graph onto the x-axis to determine the domain: Domain = \([−2, \infty)\). Project all points on the graph onto the y-axis to determine the range: Range = \([0, \infty)\).

\(f(x)= \sqrt{5−x}\)
|
x |
−4 |
1 |
4 |
5 |
|
f (x) |
\(f(x)= \sqrt{x}+2\)
|
x |
0 |
1 |
4 |
9 |
|
f (x) |
- Answer
-
x
0
1
4
9
f (x)
2
3
4
5
Plot the points in the table and use them to draw the graph of f.
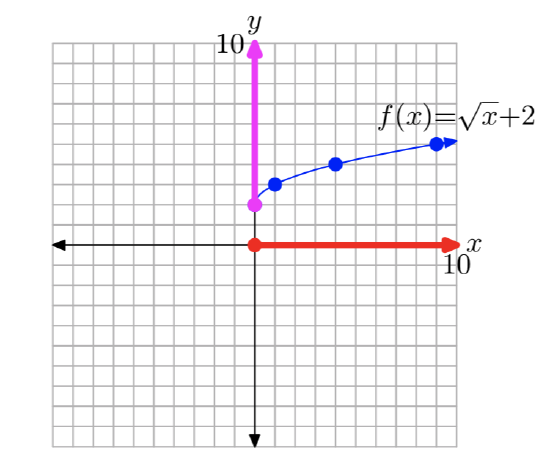
Project all points on the graph onto the x-axis to determine the domain: Domain = \([0, \infty)\). Project all points on the graph onto the y-axis to determine the range: Range = \([2, \infty)\).

\(f(x)=\sqrt{x}−1\)
|
x |
0 |
1 |
4 |
9 |
|
f (x) |
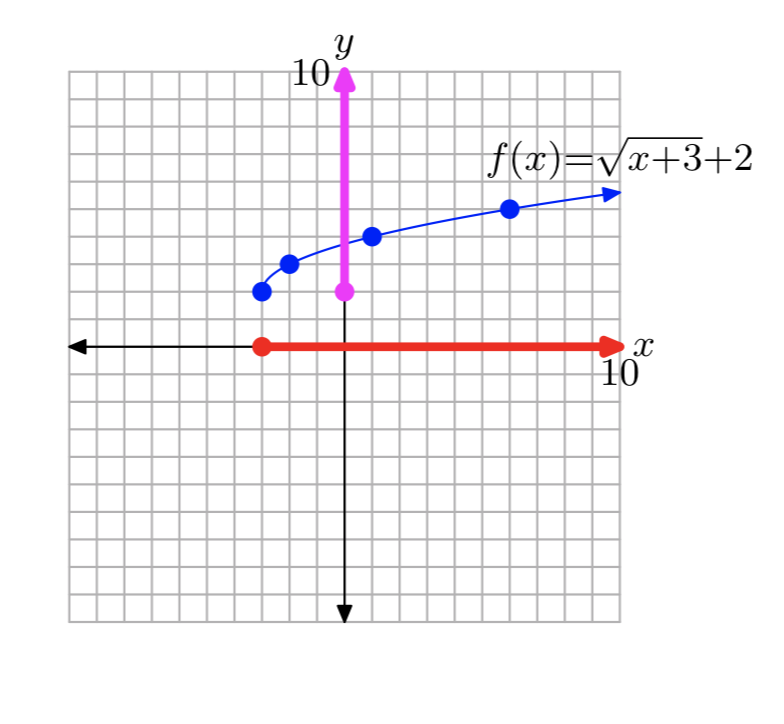
\(f(x)= \sqrt{x+3}+2\)
|
x |
−3 |
−2 |
1 |
6 |
|
f (x) |
- Answer
-
x
−3
−2
1
6
f (x)
2
3
4
5
Plot the points in the table and use them to draw the graph of f.

- Project all points on the graph onto the x-axis to determine the domain: Domain = \([−3, \infty)\). Project all points on the graph onto the y-axis to determine the range: Range = \([2, \infty)\).
\(f(x)= \sqrt{x−1}+3\)
|
x |
1 |
2 |
5 |
10 |
|
f (x) |
\(f(x)= \sqrt{3−x}\)
|
x |
−6 |
−1 |
2 |
3 |
|
f (x) |
- Answer
-
x
−6
−1
2
3
f (x)
3
2
1
0
Plot the points in the table and use them to draw the graph of f.
Project all points on the graph onto the x-axis to determine the domain: Domain = \((−\infty, 3]\). Project all points on the graph onto the y-axis to determine the range: Range = \([0, \infty)\).
\(f(x)=−\sqrt{x+3}\)
|
x |
−3 |
−2 |
1 |
6 |
|
f (x) |
In Exercises 11-20, perform each of the following tasks.
- Set up a coordinate system on a sheet of graph paper. Label and scale each axis. Remember to draw all lines with a ruler.
- Use geometric transformations to draw the graph of the given function on your coordinate system without the use of a graphing calculator. Note: You may check your solution with your calculator, but you should be able to produce the graph without the use of your calculator.
- Use different colored pencils to project the points on the graph of the function onto the x- and y-axes. Use interval notation to describe the domain and range of the function.
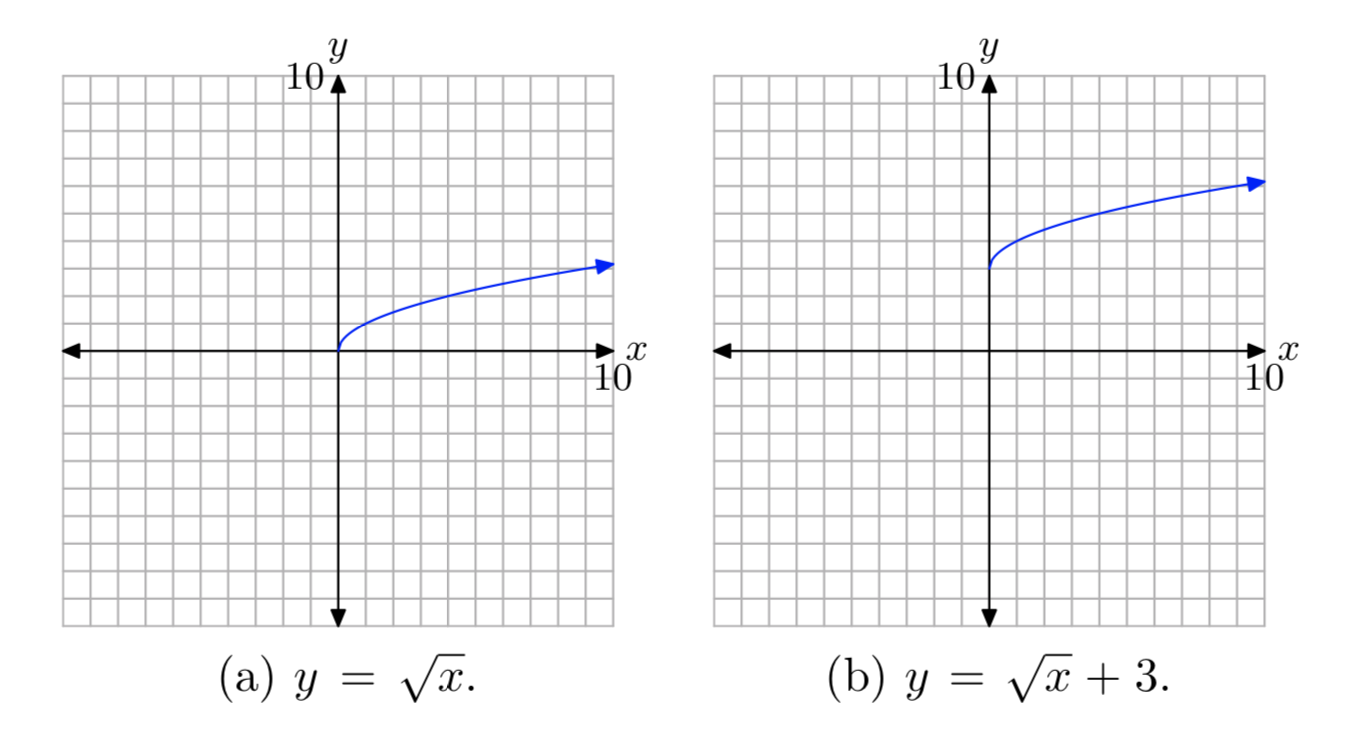
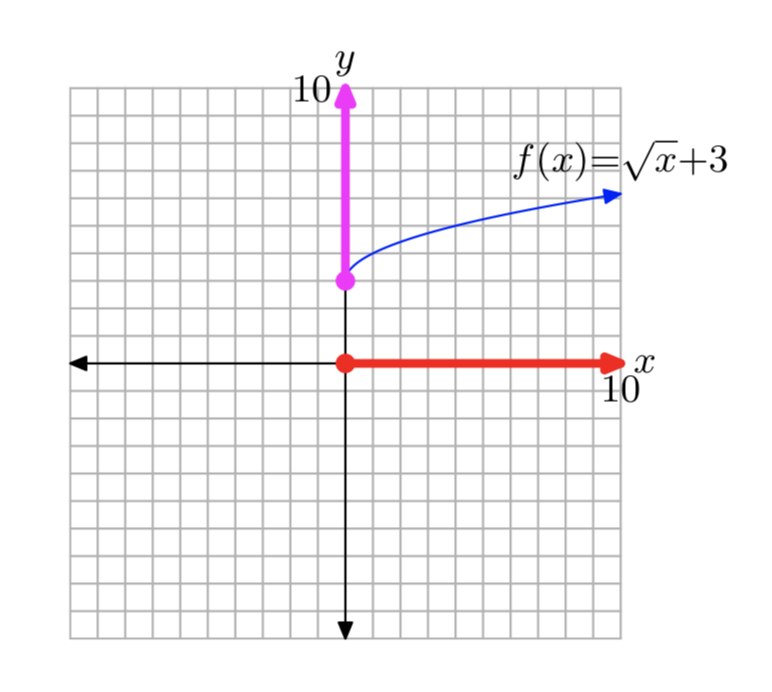
\(f(x)= \sqrt{x}+3\)
- Answer
-
First, plot the graph of \(y = \sqrt{x}\), as shown in (a). Then, add 3 to produce the equation \(y = \sqrt{x} + 3\). This will shift the graph of of \(y = \sqrt{x}\) upward 3 units, as shown in (b).
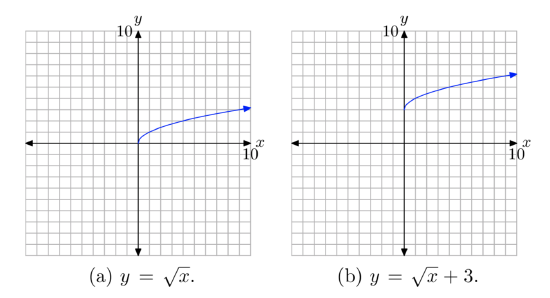
Project all points on the graph onto the x-axis to determine the domain: Domain = \([0, \infty)\). Project all points on the graph onto the y-axis to determine the range: Range = \([3, \infty)\).

\(f(x)=\sqrt{x+3}\)
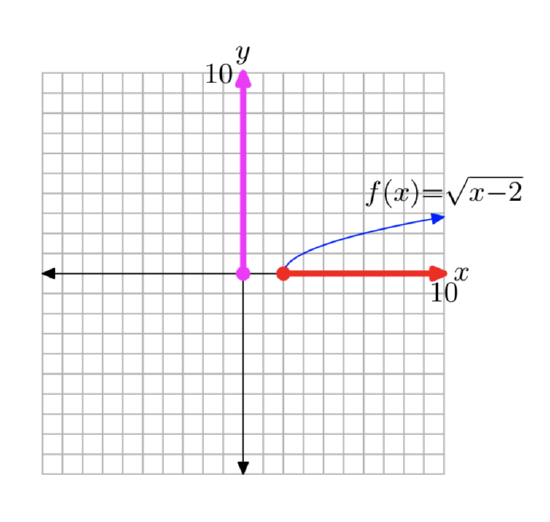
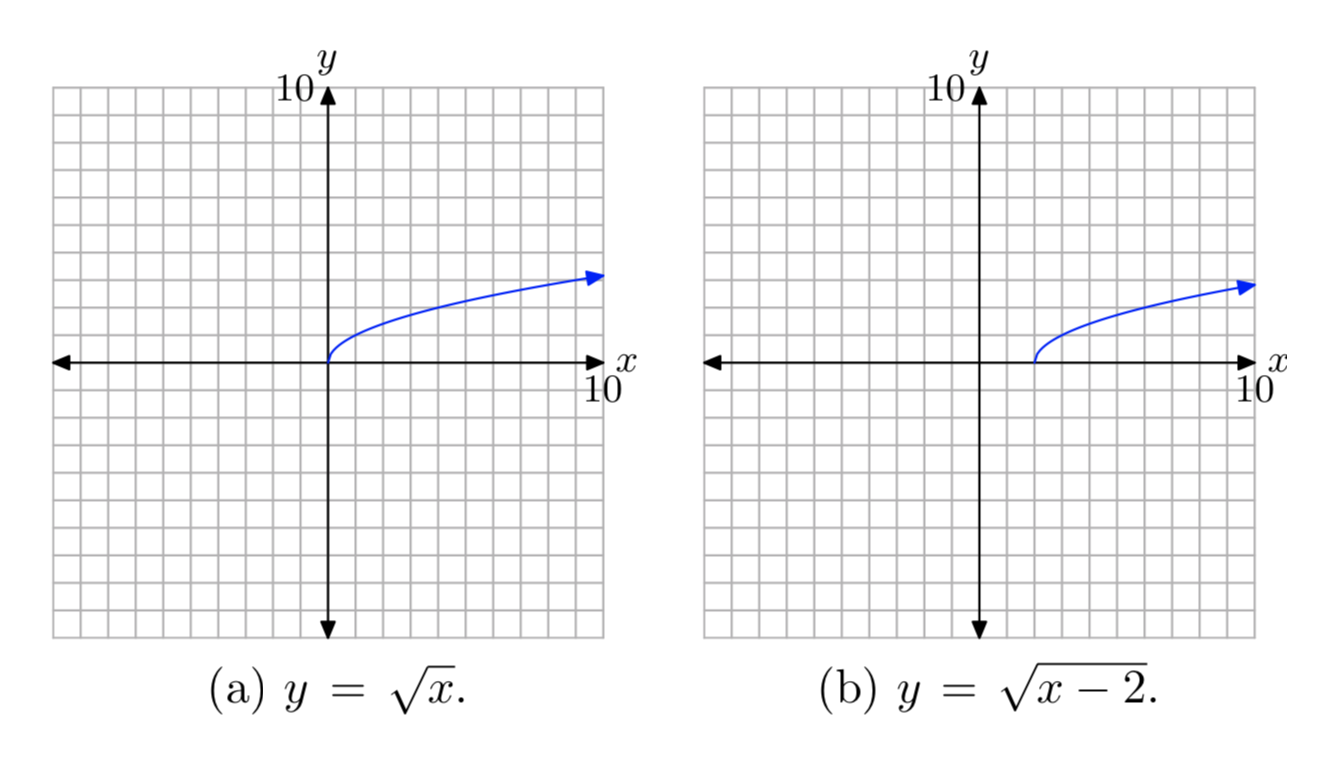
\(f(x)=\sqrt{x−2}\)
- Answer
-
First, plot the graph of \(y = \sqrt{x}\), as shown in (a). Then, replace x with x − 2 to produce the equation \(y = \sqrt{x−2}\). This will shift the graph of \(y = \sqrt{x}\) to the right 2 units, as shown in (b).
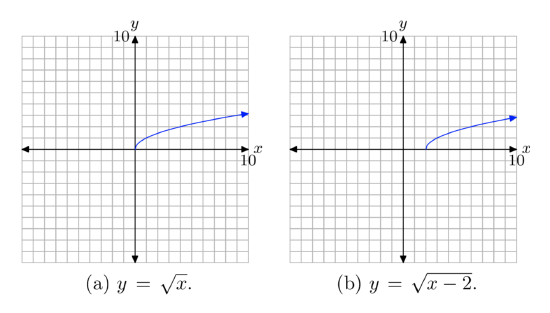
Project all points on the graph onto the x-axis to determine the domain: Domain = \([2, \infty)\). Project all points on the graph onto the y-axis to determine the range: Range = \([0, \infty)\).

\(f(x)=\sqrt{x}−2\)
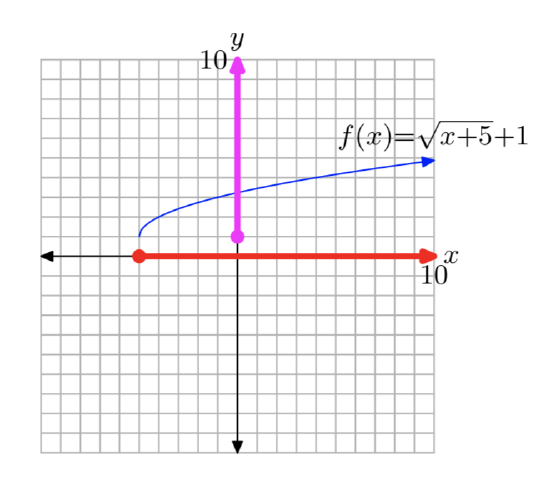
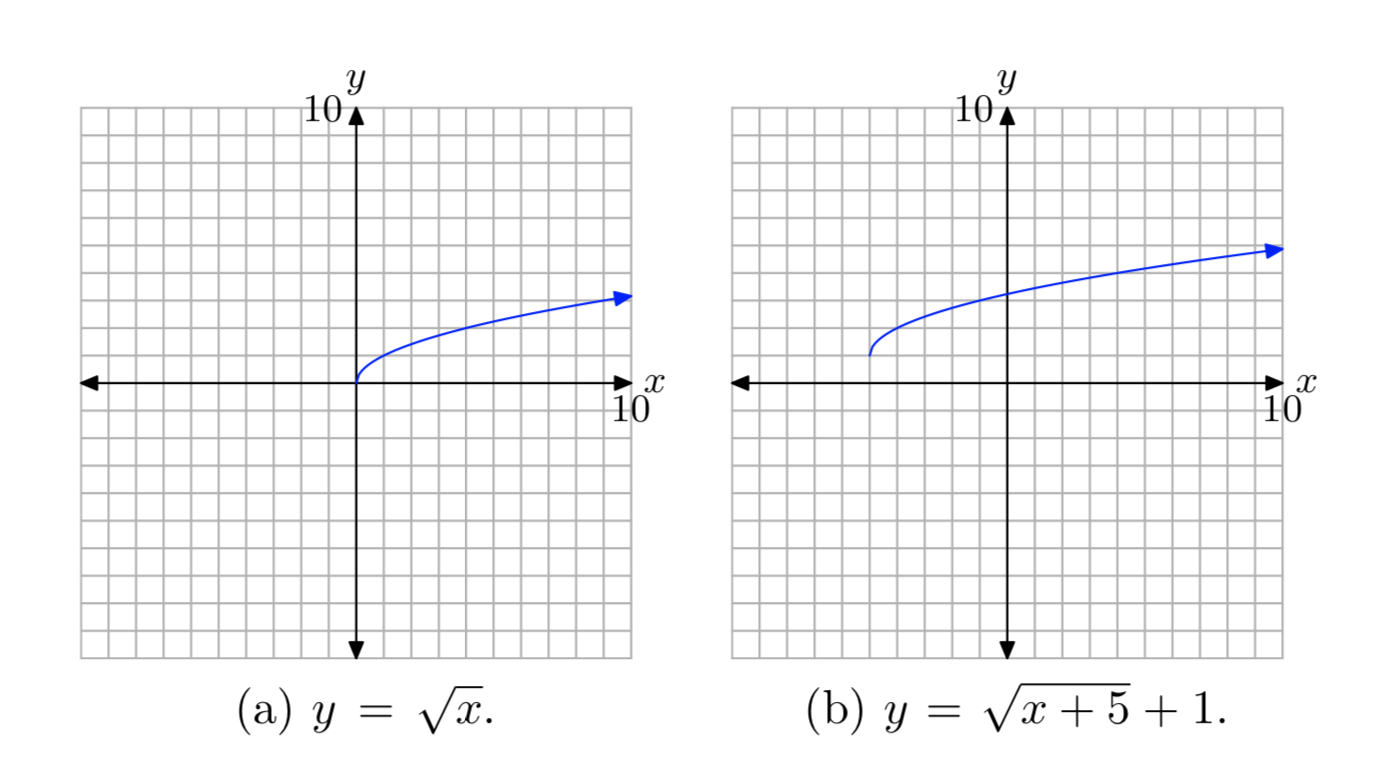
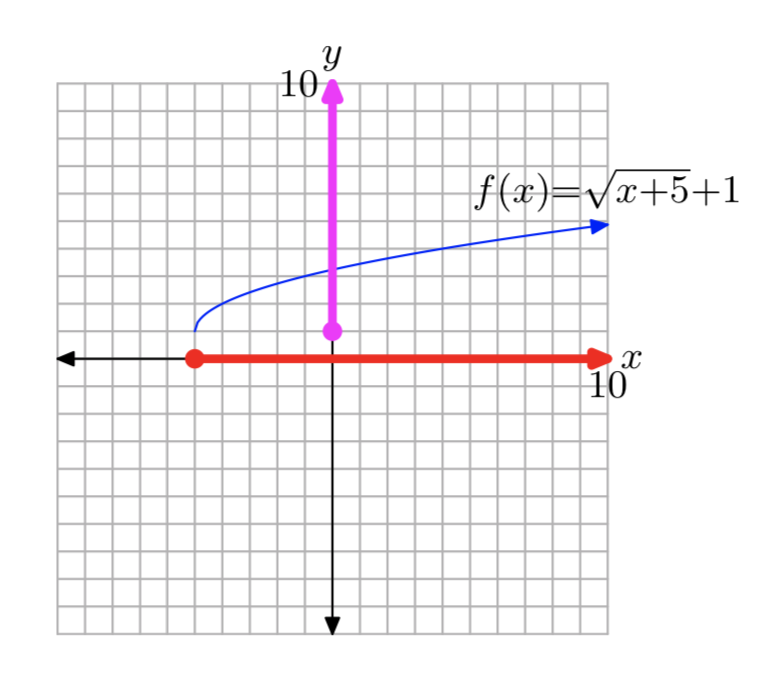
\(f(x)= \sqrt{x+5}+1\)
- Answer
-
First, plot the graph of \(y = \sqrt{x}\), as shown in (a). Then, replace x with x + 5 to produce the equation \(y = \sqrt{x+5}\). Then add 1 to produce the equation \(f(x)= \sqrt{x+5}+1\). This will shift the graph of \(y = \sqrt{x}\) to the left 5 units, then upwards 1 unit, as shown in (b).
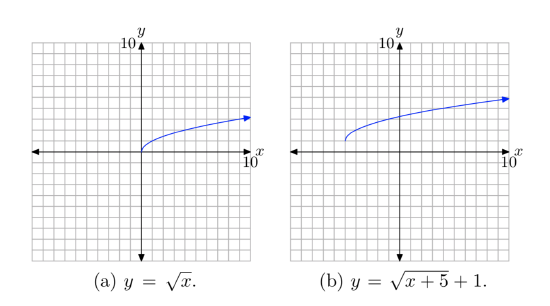
Project all points on the graph onto the x-axis to determine the domain: Domain = \([−5, \infty)\). Project all points on the graph onto the y-axis to determine the range: Range = \([1, \infty)\).
\(f(x)=\sqrt{x−2}−1\)
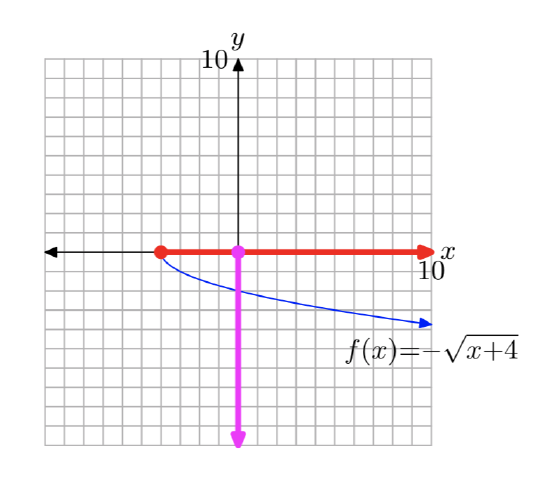
\(y = −\sqrt{x + 4}\)
- Answer
-
First, plot the graph of \(y = \sqrt{x}\), as shown in (a). Then, negate to produce the \(y = −\sqrt{x}\). This will reflect the graph of \(y = \sqrt{x}\) across the x-axis as shown in (b). Finally, replace x with x + 4 to produce the equation \(y = −\sqrt{x + 4}\). This will shift the graph of \(y = −\sqrt{x}\) four units to the left, as shown in (c).
Project all points on the graph onto the x-axis to determine the domain: Domain = \([−4, \infty)\). Project all points on the graph onto the y-axis to determine the range: Range = \((−\infty, 0]\).

\(f(x)=−\sqrt{x}+4\)
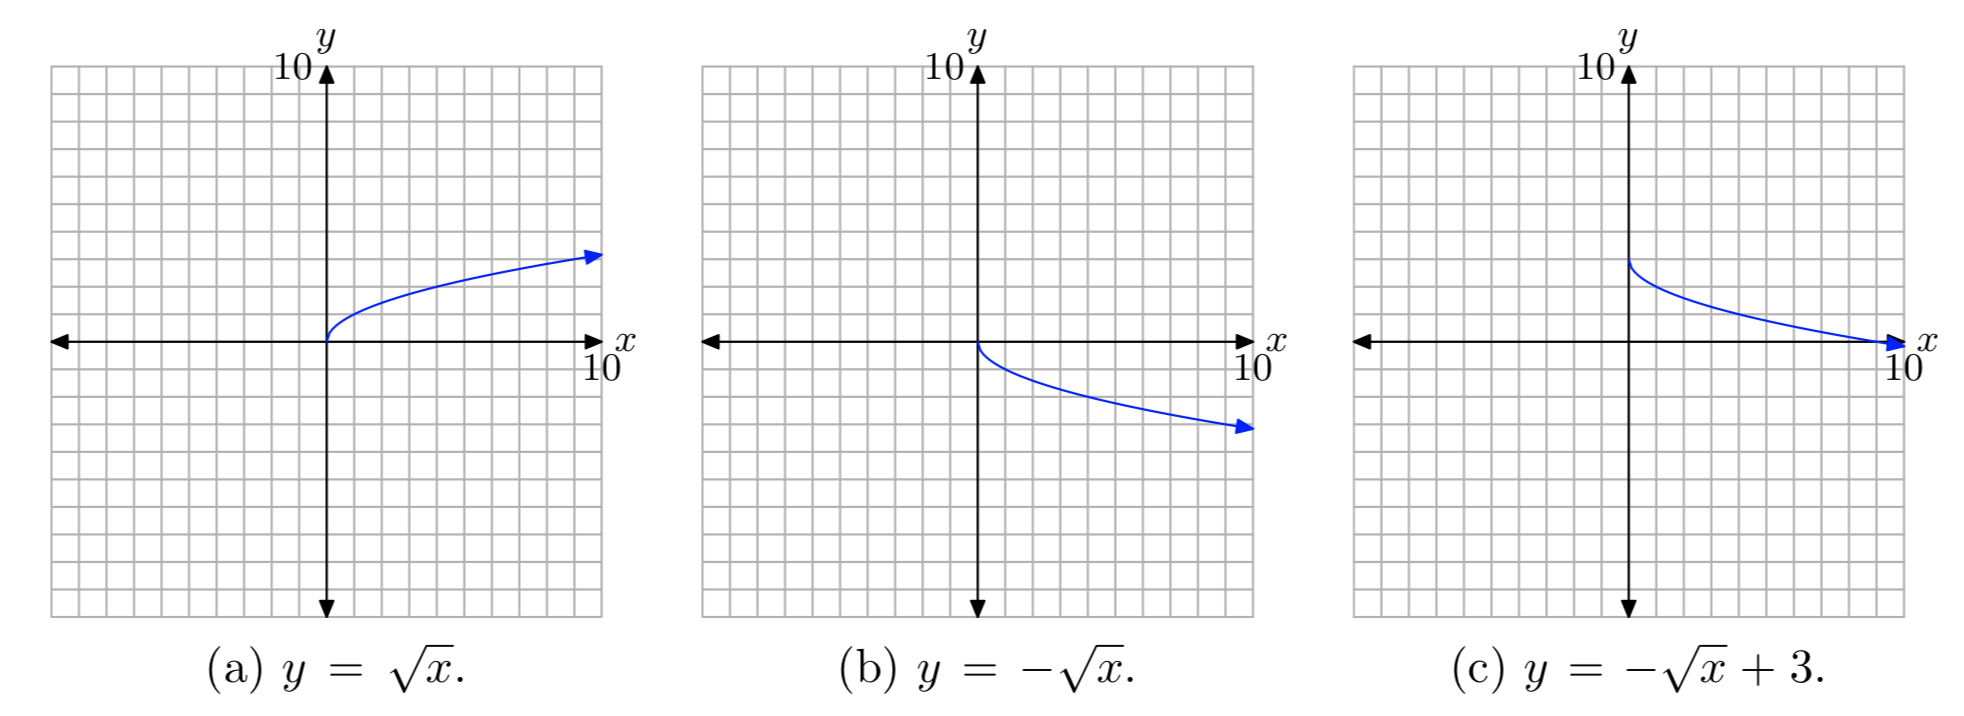
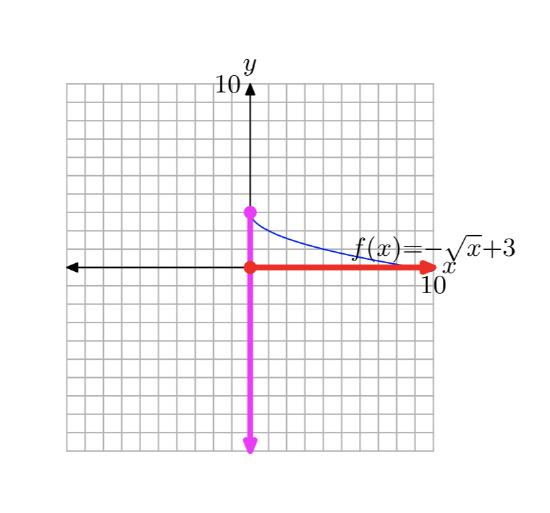
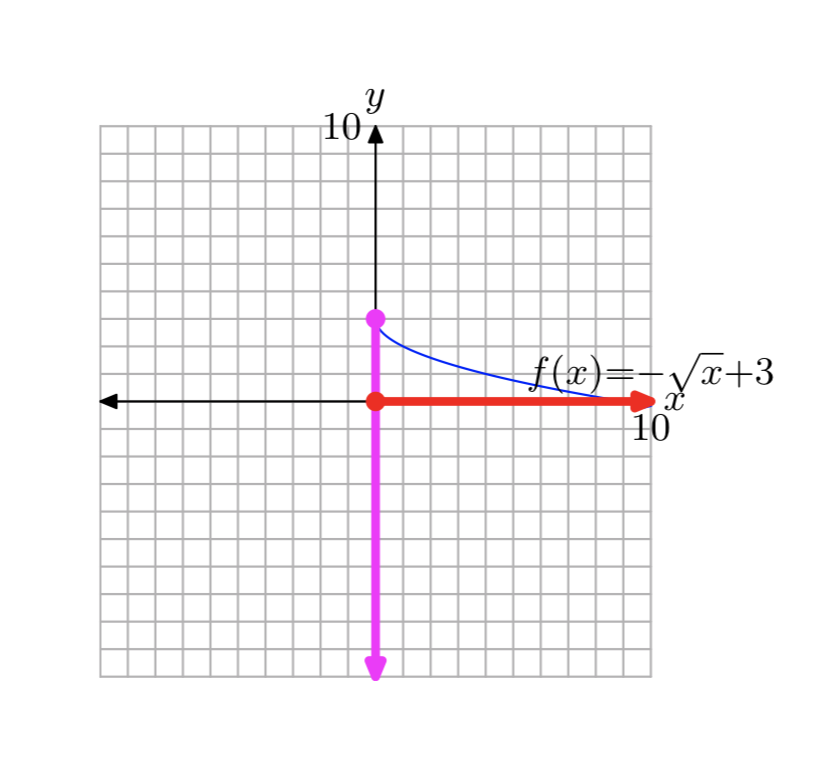
\(f(x)=−\sqrt{x}+3\)
- Answer
-
First, plot the graph of \(y = \sqrt{x}\), as shown in (a). Then, negate to produce the \(y = −\sqrt{x}\). This will reflect the graph of \(y = \sqrt{x}\) across the x-axis as shown in (b). Finally, add 3 to produce the equation \(y=−\sqrt{x}+3\). This will shift the graph of \(y = −\sqrt{x}\) three units upward, as shown in (c).
Project all points on the graph onto the x-axis to determine the domain: Domain = \([0, \infty)\). Project all points on the graph onto the y-axis to determine the range: Range = \((−\infty, 3]\).
\(f(x)=−\sqrt{x+3}\)
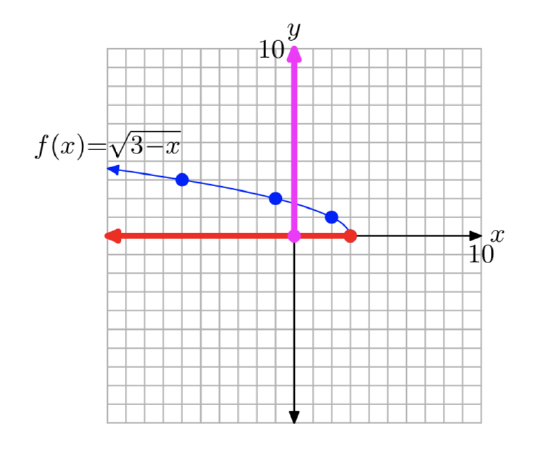
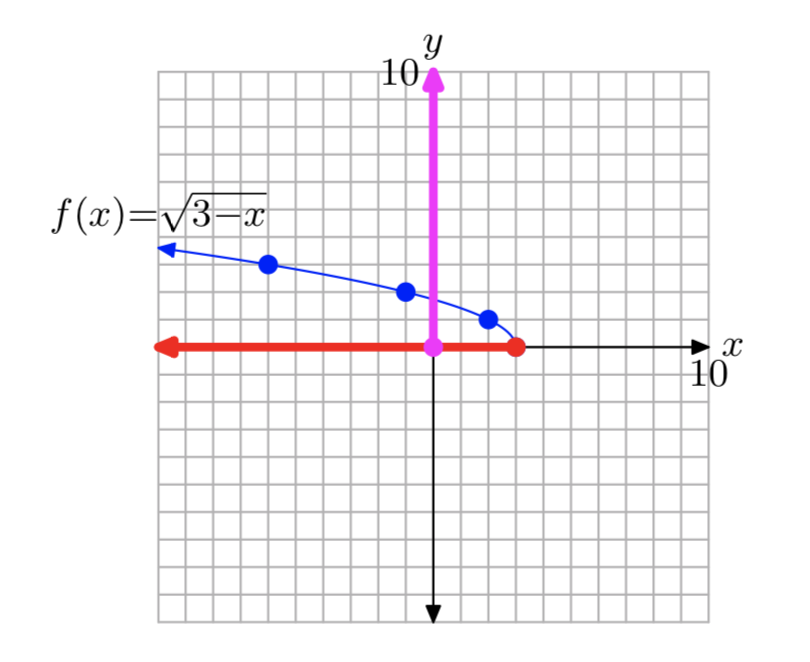
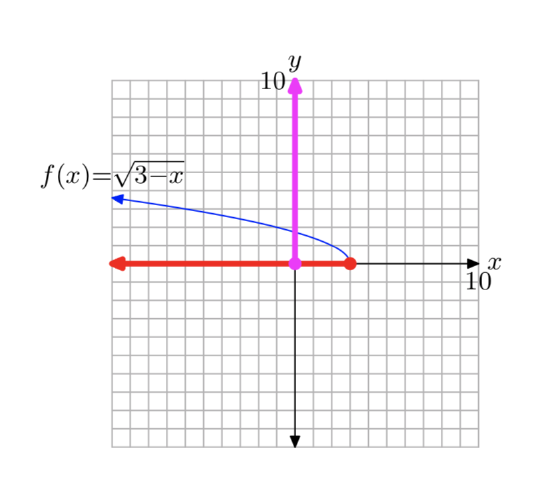
To draw the graph of the function \(f(x) = \sqrt{3−x}\), perform each of the following steps in sequence without the aid of a calculator.
- Set up a coordinate system and sketch the graph of \(y = \sqrt{x}\). Label the graph with its equation.
- Set up a second coordinate system and sketch the graph of \(y = \sqrt{−x}\). Label the graph with its equation.
- Set up a third coordinate system and sketch the graph of \(y =\sqrt{−(x − 3)}\). Label the graph with its equation. This is the graph of \(y =\sqrt{3−x}\). Use interval notation to state the domain and range of this function.
- Answer
-
First, plot the graph of \(y = \sqrt{x}\), as shown in (a). Then, replace x with −x to produce the equation \(y = \sqrt{−x}\). This will reflect the graph of \(y = \sqrt{x}\) across the y-axis, as shown in (b). Finally, replace x with x − 3 to produce the equation \(y = \sqrt{−(x − 3)}\). This will shift the graph of \(y = \sqrt{−x}\) three units to the right, as shown in (c).
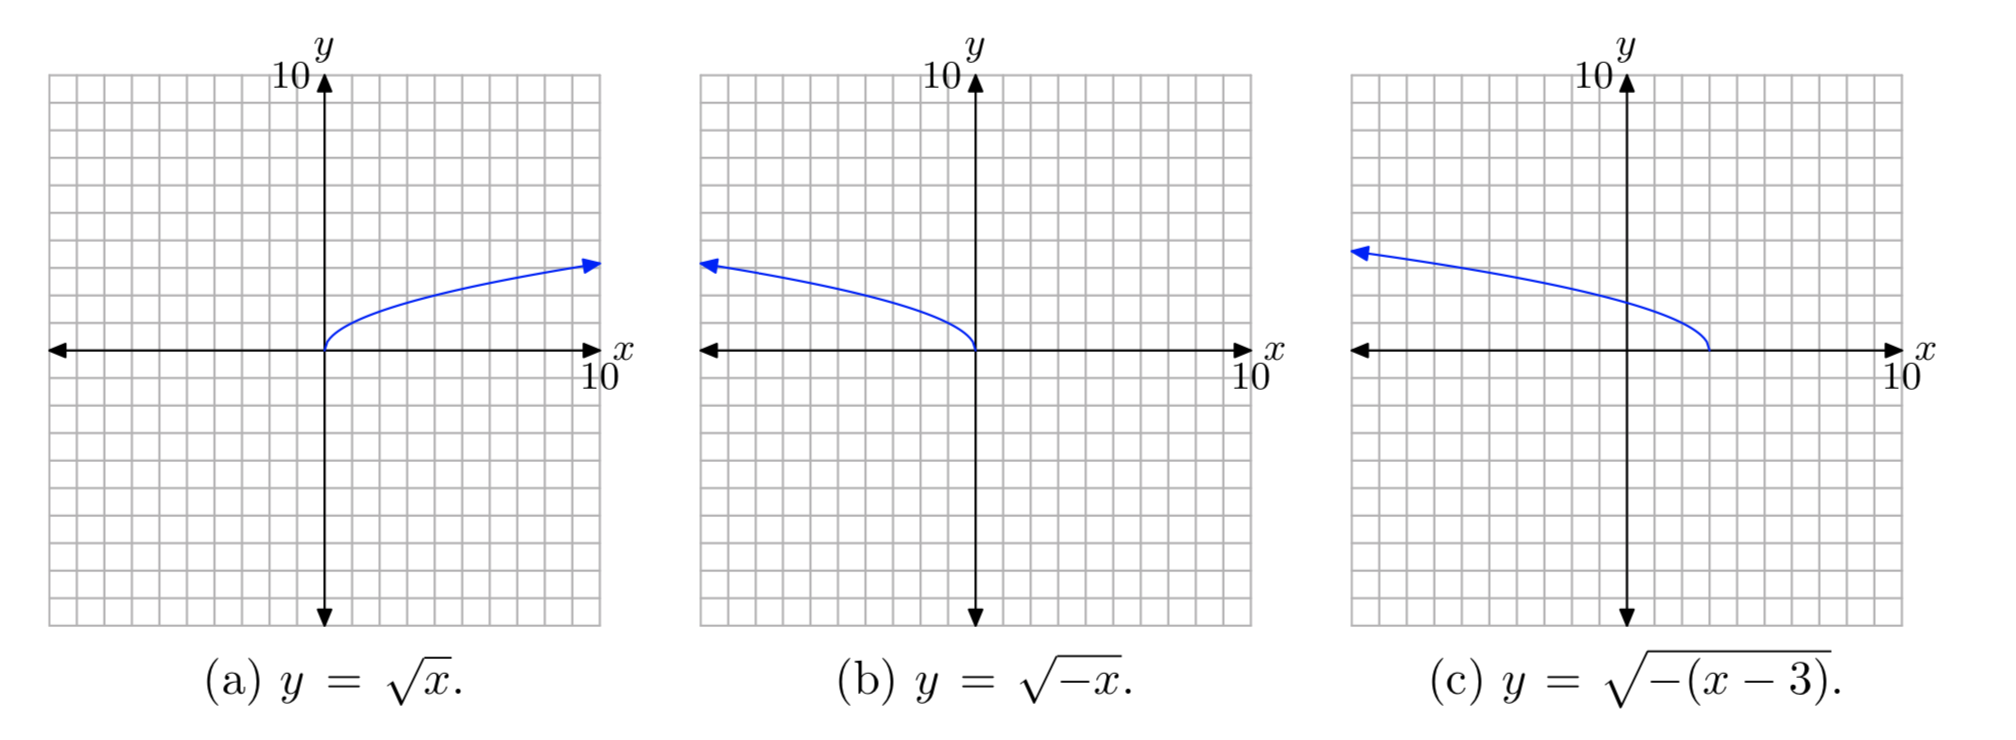
Project all points on the graph onto the x-axis to determine the domain: Domain = \((−\infty, 3]\). Project all points on the graph onto the y-axis to determine the range: Range = \([0, \infty)\).

To draw the graph of the function \(f(x) = \sqrt{−x−3}\), perform each of the following steps in sequence.
- Set up a coordinate system and sketch the graph of \(y = \sqrt{x}\). Label the graph with its equation.
- Set up a second coordinate system and sketch the graph of \(y = \sqrt{−x}\). Label the graph with its equation.
- Set up a third coordinate system and sketch the graph of \(y =\sqrt{−(x + 3)}\). Label the graph with its equation. This is the graph of \(y =\sqrt{−x−3}\). Use interval notation to state the domain and range of this function.
To draw the graph of the function \(f(x) = \sqrt{−x−3}\), perform each of the following steps in sequence without the aid of a calculator.
- Set up a coordinate system and sketch the graph of \(y = \sqrt{x}\). Label the graph with its equation.
- Set up a second coordinate system and sketch the graph of \(y = \sqrt{−x}\). Label the graph with its equation.
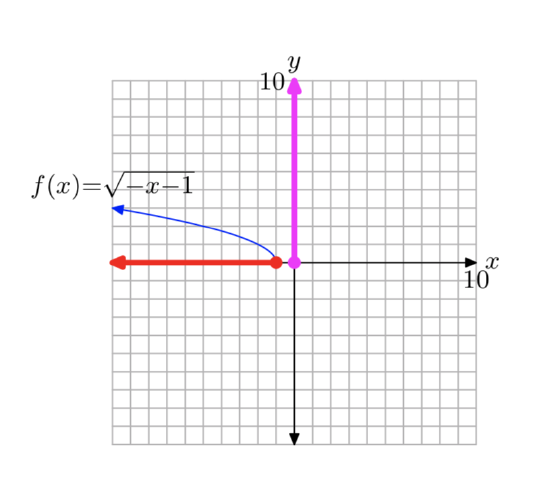
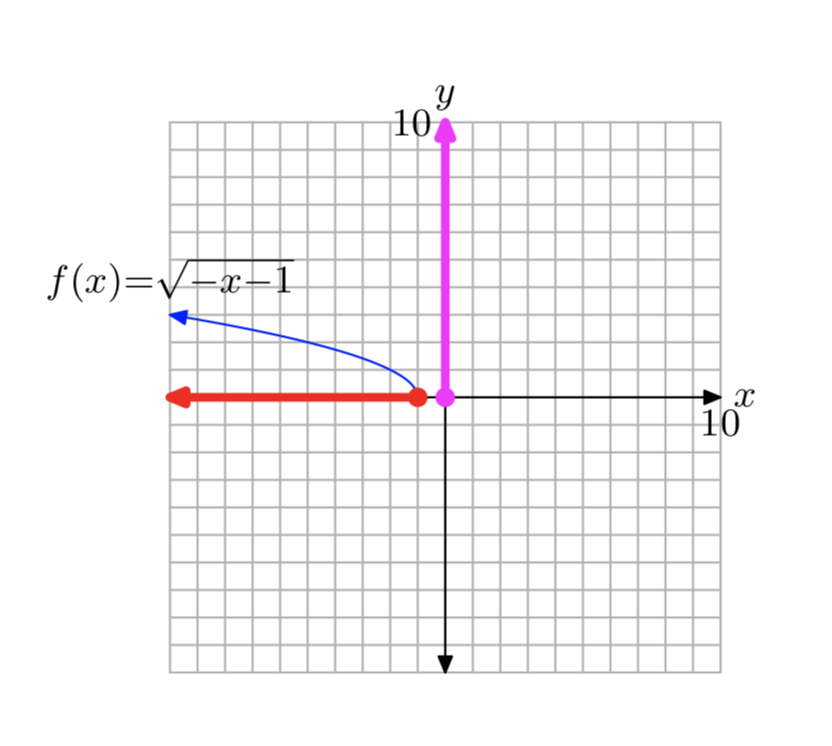
- Set up a third coordinate system and sketch the graph of \(y =\sqrt{−(x + 1)}\). Label the graph with its equation. This is the graph of \(y =\sqrt{−x−1}\). Use interval notation to state the domain and range of this function.
- Answer
-
First, plot the graph of \(y = \sqrt{x}\), as shown in (a). Then, replace x with −x to produce the equation \(y = \sqrt{−x}\). This will reflect the graph of \(y = \sqrt{x}\) across the y-axis, as shown in (b). Finally, replace x with x + 1 to produce the equation \(y = \sqrt{−(x + 1)}\). This will shift the graph of \(y = \sqrt{−x}\) one unit to the left, as shown in (c).
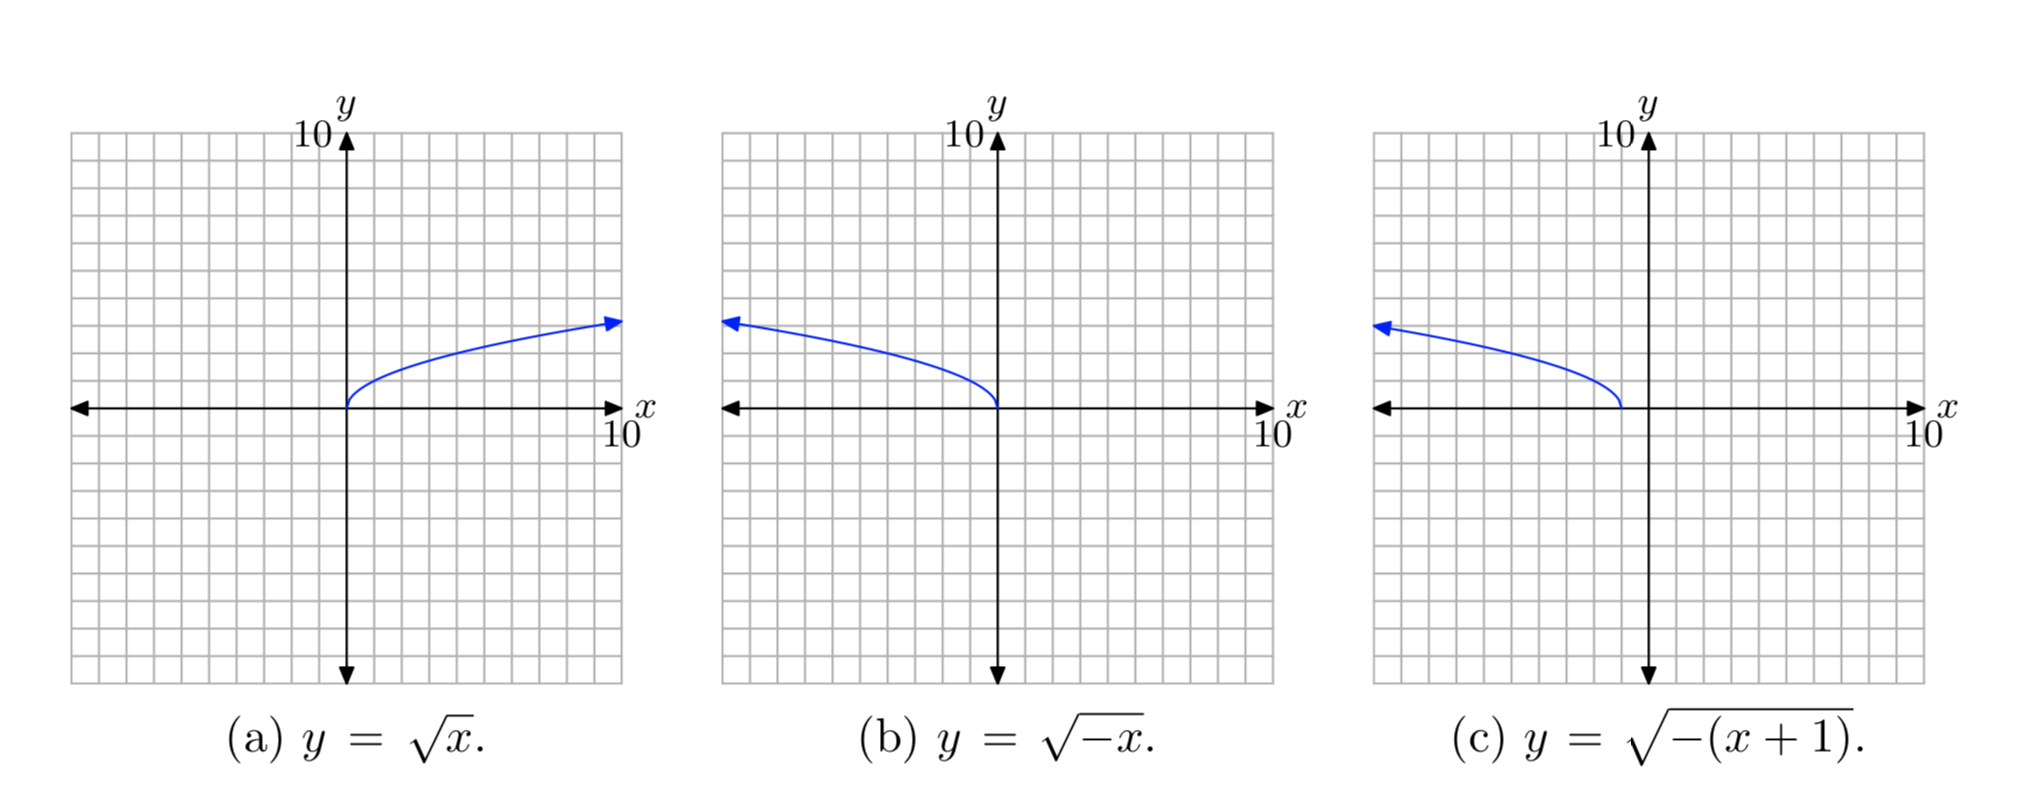
Project all points on the graph onto the x-axis to determine the domain: Domain = \((−\infty, −1]\). Project all points on the graph onto the y-axis to determine the range: Range = \([0, \infty)\).
To draw the graph of the function \(f(x) = \sqrt{1−x}\), perform each of the following steps in sequence.
- Set up a coordinate system and sketch the graph of \(y = \sqrt{x}\). Label the graph with its equation.
- Set up a second coordinate system and sketch the graph of \(y = \sqrt{−x}\). Label the graph with its equation.
- Set up a third coordinate system and sketch the graph of \(y =\sqrt{−(x−1)}\). Label the graph with its equation. This is the graph of \(y =\sqrt{1−x}\). Use interval notation to state the domain and range of this function.
In Exercises 25-28, perform each of the following tasks.
- Draw the graph of the given function with your graphing calculator. Copy the image in your viewing window onto your homework paper. Label and scale each axis with xmin, xmax, ymin, and ymax. Label your graph with its equation. Use the graph to determine the domain of the function and describe the domain with interval notation.
- Use a purely algebraic approach to determine the domain of the given function. Use interval notation to de- scribe your result. Does it agree with the graphical result from part 1?
\(f(x)= \sqrt{2x+7}\)
- Answer
-
We use a graphing calculator to produce the following graph of \(f(x)= \sqrt{2x+7}\)
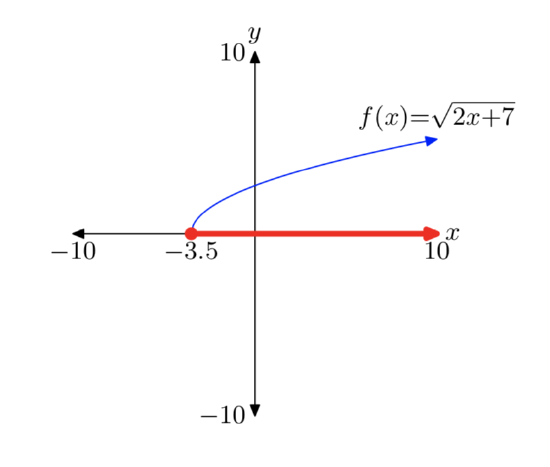
We estimate that the domain will consist of all real numbers to the right of approximately −3.5. To find an algebraic solution, note that you cannot take the square root of a negative number. Hence, the expression under the radical in \(f(x)= \sqrt{2x+7}\) must be greater than or equal to zero.
\(2x + 7 \ge 0\)
\(2x \ge −7\)
\(x \ge −\frac{7}{2}\)
Hence, the domain is \([−\frac{7}{2}, \infty)\).

\(f(x)= \sqrt{7−2x}\)
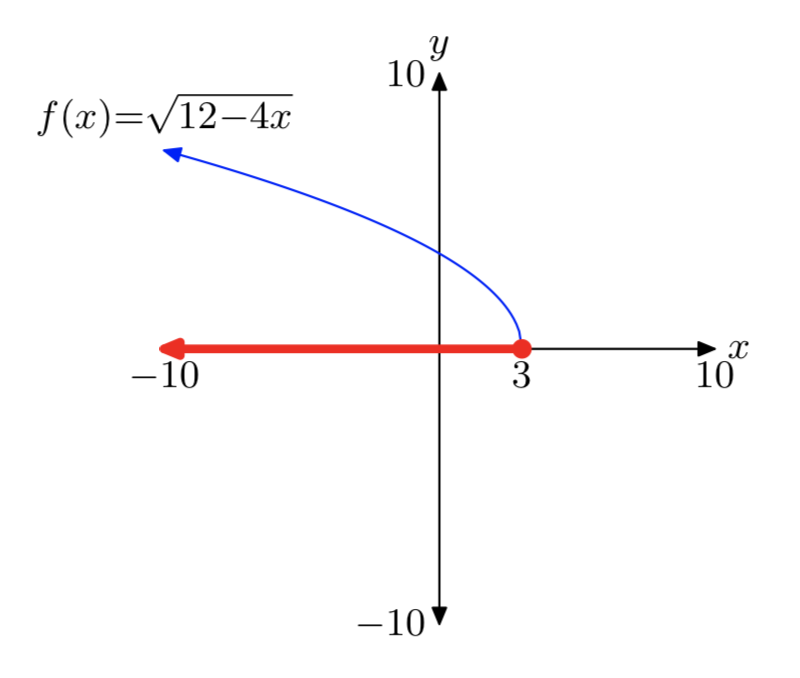
\(f(x)= \sqrt{12−4x}\)
- Answer
-
We use a graphing calculator to produce the following graph of \(f(x)= \sqrt{12−4x}\).
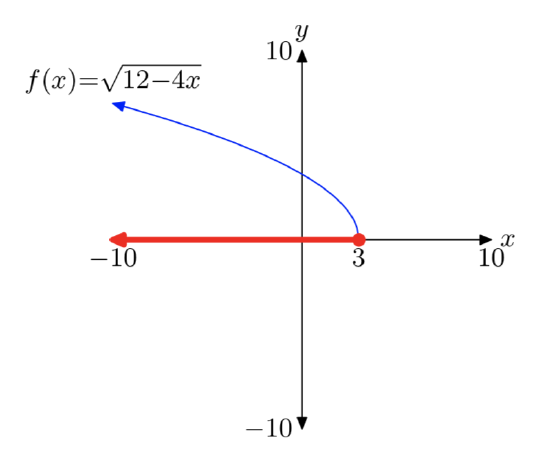
We estimate that the domain will consist of all real numbers to the right of approximately 3. To find an algebraic solution, note that you cannot take the square root of a negative number. Hence, the expression under the radical in \(f(x)= \sqrt{12−4x}\) must be greater than or equal to zero.
\(12−4x \ge 0\)
\(−4x \ge −12\)
\(x \le 3\)
Hence, the domain is \((−\infty, 3]\).
\(f(x)= \sqrt{12+2x}\)
In Exercises 29-40, find the domain of the given function algebraically.
\(f(x)= \sqrt{2x+9}\)
- Answer
-
The even root of a negative number is not defined as a real number. Thus, 2x + 9 must be greater than or equal to zero. Since \(2x + 9 \ge 0\) implies that \(x \ge −\frac{9}{2}\), the domain is the interval \([−\frac{9}{2},\infty)\).
\(f(x)=\sqrt{−3x+3}\)
\(f(x)=\sqrt{−8x−3}\)
- Answer
-
The even root of a negative number is not defined as a real number. Thus, −8x−3 must be greater than or equal to zero. Since \(−8x−3 \ge 0\) implies that \(x \le −\frac{3}{8}\), the domain is the interval \((−\infty, −\frac{3}{8}]\).
\(f(x)=\sqrt{−3x+6}\)
\(f(x)=\sqrt{−6x−8}\)
- Answer
-
The even root of a negative number is not defined as a real number. Thus, −6x−8 must be greater than or equal to zero. Since \(−6x−8 \ge 0\) implies that \(x \le −\frac{4}{3}\), the domain is the interval \((−\infty, \frac{4}{3}]\).
\(f(x)=\sqrt{8x−6}\)
\(f(x)=\sqrt{−7x+2}\)
- Answer
-
The even root of a negative number is not defined as a real number. Thus, −7x+2 must be greater than or equal to zero. Since \(−7x+2 \ge 0\) implies that \(x \le \frac{2}{7}\), the domain is the interval \((−\infty, \frac{2}{7}]\).
\(f(x)=\sqrt{8x−3}\)
\(f(x)=\sqrt{6x+3}\)
- Answer
-
The even root of a negative number is not defined as a real number. Thus, 6x+3 must be greater than or equal to zero. Since \(6x+3 \ge 0\) implies that \(x \ge −\frac{1}{2}\), the domain is the interval \([−\frac{1}{2}, \infty)\).
\(f(x)=\sqrt{x−5}\)
\(f(x)=\sqrt{−7x−8}\)
- Answer
-
The even root of a negative number is not defined as a real number. Thus, −7x−8 must be greater than or equal to zero. Since \(−7x−8 \ge 0\) implies that \(x \le −\frac{8}{7}\), the domain is the interval \((−\infty, −\frac{8}{7}]\)
\(f(x)=\sqrt{7x+8}\)