
7.6: Applied Examples
- Page ID
- 45200
To better understand the concepts learned in this chapter, apply them to real-life situation and every day problems.
The total sales of phone covers in a popular phone store (in thousands) are shown in the figure below. The month of March, \(2016\), corresponds to \(x = 0\).
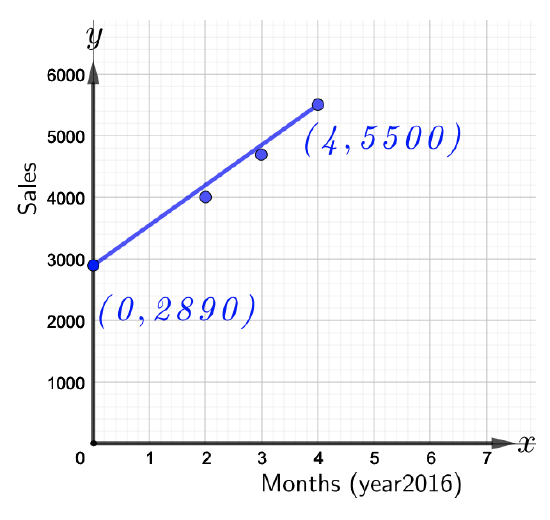
- Refer to the figure above to write an equation of the line that models the data. What does the slope indicate?
- Use the equation in part a to approximate the sales of phone covers in the month of November, \(2016\).
Solution
- Referring to the figure above, notice that there are two points, \((0, 2890)\) and \((4, 5500)\), that lie on the given line. Use the two points to first find the slope. Thus,
\(m = \dfrac{5500 − 2890}{4 − 0} = \dfrac{2610}{4} = 652.5\)
Thus, the slope is \(652.5\). Since the slope is positive, it indicates an increase. Hence, the slope indicates that the sales of phone covers have increased by about \($652.5\) per month from March \(2016\) to July \(2016\).
Use the slope and the \(y\)-intercept \((0, 2890)\) to write the equation of the line in slope-intercept form as follows,
\(\begin{array} &&y = mx + b &\text{Slope-intercept form} \\ &y = 652.5x + 2890 &\text{Substituting \(m = 652.5\) and \(b = 2890\)} \end{array}\)
- Now, it is given that \(x = 0\) corresponds to the month of March and the problem asks to approximate the sales of phone covers in the month of November \(2016\). Thus, \(x = 8\) corresponds to the month of November \(2016\). Substitute \(x = 8\) in the equation found in part a. Thus,
\(\begin{array} &&y = 652.5x + 22980 &\text{Equation of the line from part a} \\ &= 652.5(8) + 2890 &\text{Substitute \(x = 8\)} \\ &= 8110 &\text{Multiply then add to simplify} \end{array}\)
Therefore, the sales of phone covers in the month of November \(2016\) were approximately \($8,110\).
A mother was concerned if her toddler is consuming enough calcium. The toddler’s main calcium intake was in the form of milk. The mother recorded the data for nine months to monitor the toddler’s intake of milk. The data is represented in a scattered diagram that shows the amount of milk that the toddler consumed each month for nine months, from February to October as shown in the figure below.
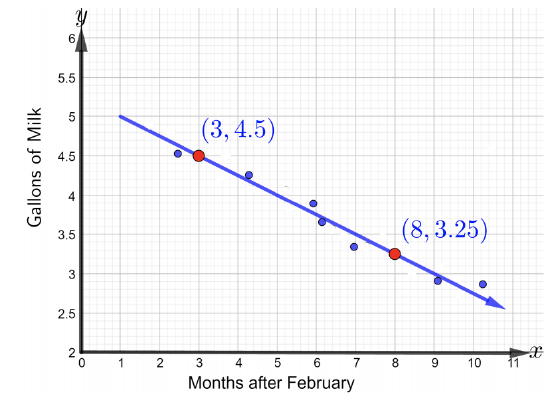
- Refer to the figure above to write an equation of the line to model the given data using the two labeled points. Write the equation in a slope-intercept form. What can be said about the slope?
- Use the equation of the line found in part a to predict the amount of mild that the toddler will consume in December.
Solution
- To write the equation of the line, first find the slope using the two labeled points, \((3, 4.5)\) and \((8, 3.25)\). Thus,
\(m = \dfrac{3.25 − 4.5}{8 − 3} = −\dfrac{1.25}{5} = −0.25\)
The slope is negative means that the toddler’s milk consumption is decreasing by about \(0.25\) gallons of milk each month.
Since the \(y\)-intercept is not given, it will not be possible to use the slope intercept form. Instead, use the slope and either of the two labeled points in the point-slope form to find the equation of the line. Thus,
\(\begin{array} &&y − y_1 = m(x − x_1) &\text{Point-Slope form} \\ &y − 4.5 = −0.25(x − 3) &\text{Substitute \(m = −0.25\) and point \((3, 4.5)\) with \(x_1 = 3\) and \(y_1 = 4.5\)} \\ &y−4.5 = −0.25x+0.75 &\text{Distribute \(-0.25\) to both terms on the right} \\ &y = −0.25x + 5.25 &\text{Add \(4.5\) to both sides of the equality to solve for \(y\) and get the equation in the Slope-Intercept form} \end{array}\)
Thus, \(y = −0.25x + 5.25\) is the equation of the line that represents the data given in the figure above and is in slope-intercept form.
- To predict how many gallons of milk will the toddler consume in December, first find \(x\) that corresponds to the month of December. It is given that \(x = 0\) corresponds to the month of February. Starting at the month of March with \(x = 1\), \(x = 10\) corresponds to the month of December. Substitute \(x = 10\) in the equation of the line found in part a and solve for \(y\) as follows,
\(\begin{array} &&y = −0.25x + 5.25 &\text{Equation of the line found in part a} \\ &= −0.25(10) + 5.25 &\text{Substitute \(x = 10\)} \\ &= −2.5 + 5.25 &\text{Multiply then add to simplify} \\ &= 2.75 & \end{array}\)
Therefore, the toddler will consume about \(2.75\) gallons of milk in December.
The annual sales of a certain model of printers in a famous electronics store are shown in the figure below, where the year \(2012\) corresponds to \(x = 0\).
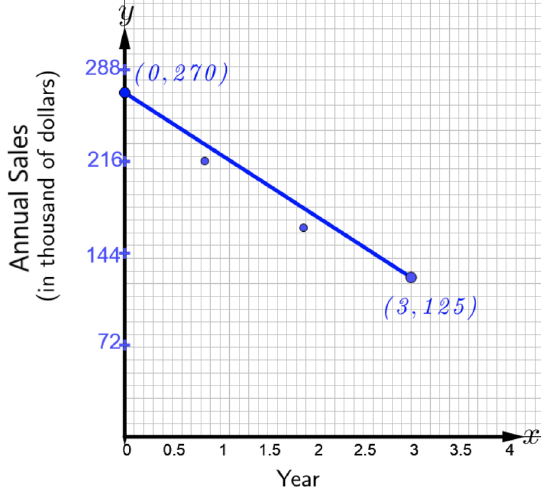
- Refer to the figure above to write an equation of the line that models the data. What does the slope indicate?
- Use the equation of the line found in part a to approximate the sales of the printers in the year \(2016\).
John bought an ice cream cone that is \(11.2\) cm tall. It was really hot, the ice cream started to melt at a rate of \(2\) cm per minute. John got interested at how fast his ice cream was melting and wanted to know how much ice cream would be left after \(2.5\) minutes.
- Find an equation of the line that models the data in slope-intercept form.
- Determine how much ice cream is left after \(2.5\) minutes.