
1.4: Survey Problems
- Page ID
- 70300

\( \newcommand{\vecs}[1]{\overset { \scriptstyle \rightharpoonup} {\mathbf{#1}} } \)
\( \newcommand{\vecd}[1]{\overset{-\!-\!\rightharpoonup}{\vphantom{a}\smash {#1}}} \)
\( \newcommand{\dsum}{\displaystyle\sum\limits} \)
\( \newcommand{\dint}{\displaystyle\int\limits} \)
\( \newcommand{\dlim}{\displaystyle\lim\limits} \)
\( \newcommand{\id}{\mathrm{id}}\) \( \newcommand{\Span}{\mathrm{span}}\)
( \newcommand{\kernel}{\mathrm{null}\,}\) \( \newcommand{\range}{\mathrm{range}\,}\)
\( \newcommand{\RealPart}{\mathrm{Re}}\) \( \newcommand{\ImaginaryPart}{\mathrm{Im}}\)
\( \newcommand{\Argument}{\mathrm{Arg}}\) \( \newcommand{\norm}[1]{\| #1 \|}\)
\( \newcommand{\inner}[2]{\langle #1, #2 \rangle}\)
\( \newcommand{\Span}{\mathrm{span}}\)
\( \newcommand{\id}{\mathrm{id}}\)
\( \newcommand{\Span}{\mathrm{span}}\)
\( \newcommand{\kernel}{\mathrm{null}\,}\)
\( \newcommand{\range}{\mathrm{range}\,}\)
\( \newcommand{\RealPart}{\mathrm{Re}}\)
\( \newcommand{\ImaginaryPart}{\mathrm{Im}}\)
\( \newcommand{\Argument}{\mathrm{Arg}}\)
\( \newcommand{\norm}[1]{\| #1 \|}\)
\( \newcommand{\inner}[2]{\langle #1, #2 \rangle}\)
\( \newcommand{\Span}{\mathrm{span}}\) \( \newcommand{\AA}{\unicode[.8,0]{x212B}}\)
\( \newcommand{\vectorA}[1]{\vec{#1}} % arrow\)
\( \newcommand{\vectorAt}[1]{\vec{\text{#1}}} % arrow\)
\( \newcommand{\vectorB}[1]{\overset { \scriptstyle \rightharpoonup} {\mathbf{#1}} } \)
\( \newcommand{\vectorC}[1]{\textbf{#1}} \)
\( \newcommand{\vectorD}[1]{\overrightarrow{#1}} \)
\( \newcommand{\vectorDt}[1]{\overrightarrow{\text{#1}}} \)
\( \newcommand{\vectE}[1]{\overset{-\!-\!\rightharpoonup}{\vphantom{a}\smash{\mathbf {#1}}}} \)
\( \newcommand{\vecs}[1]{\overset { \scriptstyle \rightharpoonup} {\mathbf{#1}} } \)
\(\newcommand{\longvect}{\overrightarrow}\)
\( \newcommand{\vecd}[1]{\overset{-\!-\!\rightharpoonup}{\vphantom{a}\smash {#1}}} \)
\(\newcommand{\avec}{\mathbf a}\) \(\newcommand{\bvec}{\mathbf b}\) \(\newcommand{\cvec}{\mathbf c}\) \(\newcommand{\dvec}{\mathbf d}\) \(\newcommand{\dtil}{\widetilde{\mathbf d}}\) \(\newcommand{\evec}{\mathbf e}\) \(\newcommand{\fvec}{\mathbf f}\) \(\newcommand{\nvec}{\mathbf n}\) \(\newcommand{\pvec}{\mathbf p}\) \(\newcommand{\qvec}{\mathbf q}\) \(\newcommand{\svec}{\mathbf s}\) \(\newcommand{\tvec}{\mathbf t}\) \(\newcommand{\uvec}{\mathbf u}\) \(\newcommand{\vvec}{\mathbf v}\) \(\newcommand{\wvec}{\mathbf w}\) \(\newcommand{\xvec}{\mathbf x}\) \(\newcommand{\yvec}{\mathbf y}\) \(\newcommand{\zvec}{\mathbf z}\) \(\newcommand{\rvec}{\mathbf r}\) \(\newcommand{\mvec}{\mathbf m}\) \(\newcommand{\zerovec}{\mathbf 0}\) \(\newcommand{\onevec}{\mathbf 1}\) \(\newcommand{\real}{\mathbb R}\) \(\newcommand{\twovec}[2]{\left[\begin{array}{r}#1 \\ #2 \end{array}\right]}\) \(\newcommand{\ctwovec}[2]{\left[\begin{array}{c}#1 \\ #2 \end{array}\right]}\) \(\newcommand{\threevec}[3]{\left[\begin{array}{r}#1 \\ #2 \\ #3 \end{array}\right]}\) \(\newcommand{\cthreevec}[3]{\left[\begin{array}{c}#1 \\ #2 \\ #3 \end{array}\right]}\) \(\newcommand{\fourvec}[4]{\left[\begin{array}{r}#1 \\ #2 \\ #3 \\ #4 \end{array}\right]}\) \(\newcommand{\cfourvec}[4]{\left[\begin{array}{c}#1 \\ #2 \\ #3 \\ #4 \end{array}\right]}\) \(\newcommand{\fivevec}[5]{\left[\begin{array}{r}#1 \\ #2 \\ #3 \\ #4 \\ #5 \\ \end{array}\right]}\) \(\newcommand{\cfivevec}[5]{\left[\begin{array}{c}#1 \\ #2 \\ #3 \\ #4 \\ #5 \\ \end{array}\right]}\) \(\newcommand{\mattwo}[4]{\left[\begin{array}{rr}#1 \amp #2 \\ #3 \amp #4 \\ \end{array}\right]}\) \(\newcommand{\laspan}[1]{\text{Span}\{#1\}}\) \(\newcommand{\bcal}{\cal B}\) \(\newcommand{\ccal}{\cal C}\) \(\newcommand{\scal}{\cal S}\) \(\newcommand{\wcal}{\cal W}\) \(\newcommand{\ecal}{\cal E}\) \(\newcommand{\coords}[2]{\left\{#1\right\}_{#2}}\) \(\newcommand{\gray}[1]{\color{gray}{#1}}\) \(\newcommand{\lgray}[1]{\color{lightgray}{#1}}\) \(\newcommand{\rank}{\operatorname{rank}}\) \(\newcommand{\row}{\text{Row}}\) \(\newcommand{\col}{\text{Col}}\) \(\renewcommand{\row}{\text{Row}}\) \(\newcommand{\nul}{\text{Nul}}\) \(\newcommand{\var}{\text{Var}}\) \(\newcommand{\corr}{\text{corr}}\) \(\newcommand{\len}[1]{\left|#1\right|}\) \(\newcommand{\bbar}{\overline{\bvec}}\) \(\newcommand{\bhat}{\widehat{\bvec}}\) \(\newcommand{\bperp}{\bvec^\perp}\) \(\newcommand{\xhat}{\widehat{\xvec}}\) \(\newcommand{\vhat}{\widehat{\vvec}}\) \(\newcommand{\uhat}{\widehat{\uvec}}\) \(\newcommand{\what}{\widehat{\wvec}}\) \(\newcommand{\Sighat}{\widehat{\Sigma}}\) \(\newcommand{\lt}{<}\) \(\newcommand{\gt}{>}\) \(\newcommand{\amp}{&}\) \(\definecolor{fillinmathshade}{gray}{0.9}\)In this exercise set, you won't be working with manipulatives. We'll be constructing and using Venn diagrams in a different way to answer specific questions given a variety of information.
We're going to start off by learning how to construct a two set Venn diagram where
U = {1, 2, 3, 4, 5, 6, 7, 8, 9},
A = {1, 2, 3, 4, 5} and
B = {2, 4, 6, 8}.
The goal is to construct a Venn diagram showing the placement of all the elements in the universe.
Notice that a blank two set Venn diagram has four distinct regions.

Method 1
One way to obtain the solution is to decide where to place each number, one at a time. Starting with 1, note it is only in set A, and place it in that region (which notationally is A – B). You can then figure out where to place each of the other eight elements one at a time. It doesn't matter which element you place first. But, in the end, each of the nine elements must be placed in one of the four regions. Try using this method. Place each of the nine elements in the Venn diagram shown above.
Method 2
Here is another way to obtain the solution. Since we can compute that \(\bf A \cap B\) = {2, 4}, we can place those two elements in the intersection at once, and we know that no other numbers go there.
Next, we note that A also contains the elements 1, 3 and 5, so we can now fill these elements in the other region of A. Similarly, we note B also contains 6 and 8, so we can fill those elements in the other region of B. This is shown below.

The only elements in the universe not accounted for are 7 and 9. These go in the part of the universe not containing A or B. After putting those in, the entire diagram can be completed as shown below. To check, see if the original information given above matches the answer.

Were you able to obtain the correct answer as shown above by using the first method proposed?
Put each element of the universe in its correct region on the Venn diagram to the right if U = {1 ,2, 3, 4, 5, 6, 7, 8, 9}, A = {2, 4, 5,7, 9} and B = {1, 2, 5, 6}

In this next example, information is provided in a different form. Method 1 is very difficult to use when the sets A and B are not explicitly given. We should still be able to fill in the Venn diagram. Again, we will work with two sets A and B. In the end, we will answer these questions: What elements are in A, B and U? We are given the following information: A – B = {c, d}, \(\bf B^{c}\) = {b, c, d, e, f}, B – A = {a, g} and \(\bf A \cup B\) = {a, c, d, g, h}
STEP 1: Since A – B and B – A are both isolated regions, we could start by filling in that information on a blank Venn diagram as shown below:

STEP 2: Next, we can fill in the rest of \(\bf A \cup B\), putting the element h in the intersection, the region not yet accounted for.

STEP 3: Finally, we can fill in the rest of \(\bf B^{c}\). Note that so far, we see the elements c and d in one of the regions of \(\bf B^{c}\), so the remaining elements b, e and f must go in the only region not yet accounted for as shown:

STEP 4: Verify that the information given at the start of the problem is still true when looking at the finished Venn diagram as shown above.
STEP 5: Answer the questions asked:
U = {a, b, c, d, e, f, g, h}
A = {c, d, h}
B = {a, g, h}
Note that someone else could have done the above problem using different steps. There's more than one way to proceed and still arrive at the correct solution. You should try it again on your own. The outcome should be the same no matter which region you filled in first.
We will do one more example of this type, but this time we will work with a three set Venn diagram. Since there are eight regions, it will take a little longer to construct. The given information follows: \(\bf (A \cap B) - C\) = {h}, B – C = {h, n}, \(\bf (A \cup B) - C\) = {l, m, h, n}, A – B ={l, m, f}, \(\bf A \cap B\) ={g, h, i}, B={h, n, j, g, i}, C={f, g, i, j, k} and \(\bf (C \cup B)^{c}\) = {l, m, d, e}
Below is just one way to take steps that lead to the correct answer.
STEP 1: First, look at a blank three set Venn diagram and find an isolated region you can fill in first from the given information. \(\bf (A \cap B) - C\) satisfies that criterion and thus that region can be filled in first as shown below.

STEP 2: Next, B – C can be completed by putting the element n into the region not already filled in as shown below.
STEP 3: \(\bf A \cap B\) can be completed now too with g and i going into the region not yet accounted for:

STEP 4: Next, we can fill in both \(\bf (A \cup B) - C\) and B because they also are down to isolated regions.

STEP 5: We're getting close. There are only three regions left to fill in. \(\bf (C \cup B)^{c}\) and the remaining region of A – B can be filled in as shown below:

STEP 6: We can now fill in the remaining region of set C to complete the diagram.

STEP 7: Check to see that all of the given information still holds true when looking at this finished diagram. We can now state the elements in sets A,B,C and U.
| U = {d, e, f, g, h, i, j, k, l, m, n} | A = {f, g, h, i, l, m} |
| B = {g, h, i, j, n} | C = {f, g, i, j, k} |
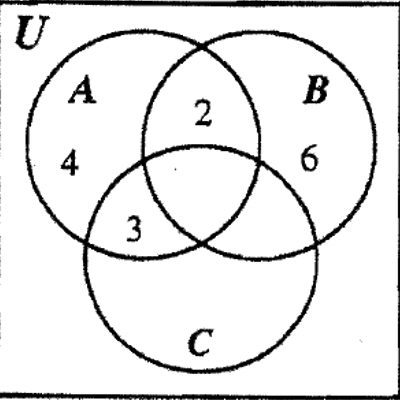
Given that U = {a, b, c, d, e, f, g, h, i, j, k}, X = {a, b, c, d, e}, Y={c, d, f, g, h} and Z = {b, c, h, i, j}, fill in each of the elements of the universe in its proper region on the Venn diagram to the right.

Now is a good time for you to practice identifying the eight regions of a three set Venn diagram by describing each region using set notation. Describe each region as indicated in parentheses on the Venn diagram. There may be more than one way to describe a region.

| a. Region 1: _____ |
| b. Region 2: _____ |
| c. Region 3: ______ |
| d. Region 4: ______ |
| e. Region 5: ______ |
| f. Region 6: ______ |
| g. Region 7: ______ |
| h. Region 8: _______ |
Before going on to survey type problems, we need to practice looking at a Venn diagram where the cardinality (number of elements) of each region is given and then be able to answer questions about the cardinality of other combinations of regions.
Look at the Venn diagram below and answer the questions about the cardinality of the regions indicated.

| a. \(n\)(A) = ____ | b. \(n\)(B) = ____ |
| c. \(n\)(\(\bf A^{c}\)) = ____ | d. \(n\)(\(\bf B^{c}\)) = ____ |
| e. \(n\)(\(\bf A \cap B\)) = ____ | f. \(n\)(A – B) = ____ |
| g. \(n\)(\(\bf (A \cup B)^{c}\)) = ____ | h. \(n\)(U) = ____ |
Imagine that the above problem was really a model for what kind of fruit a group of people packed in their lunches. A stood for those who packed apples and B stood for those who packed bananas. Assume apples and bananas are the only kind of fruit available. Then the questions you answered were these:
- How many packed apples?
- How many packed bananas?
- How many didn't pack apples?
- How many didn't pack bananas?
- How many packed both kinds of fruit?
- How many packed apples only?
- How many didn't pack either fruit?
- How many people were surveyed?
Look to see if you would have looked in the same regions if the questions were asked in this way.
Let's see how well you do working with a three set Venn diagram. The Venn diagram below shows the cardinality of each region. A survey of college students showed the grades they received on their last report card. A stands for getting an A, B stands for getting a B and C stands for getting a C. Some people took only one course whereas others took more. Look at the Venn diagram and answer the following questions. Extra Credit: Instead of just writing the number, write down what the question is asking symbolically. In other words, if the question is "How many received both A's and B's?” you would write \(n\)(\(\bf A \cap B\)) = 51.
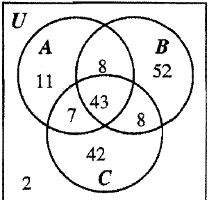
| a. How many got all A's? ____ |
| b. How many got A's? ____ |
| c. How many got B's and C's? ____ |
| d. How many got only A's or B's? _____ |
| e. How many didn't get a C? _____ |
| f. How many got B's or C's? _____ |
| g. How many got B's, but not C's? ____ |
| h. How many got at least two different grades of A, B or C? ____ |
| i. How many got exactly two different grades of A, B or C? ____ |
In another survey, questions were asked to see how many people were in their teens, how many were married and how many had children. T represents teens, M represents those who were married and C represents those having children. Look at the Venn diagram which shows the cardinality of each region to answer the following questions:

- How many people were married? ____
- How many teens had children? ____
- How many people were in the survey? ____
- How many people did not have children? ____
- How many teens weren't married? ____
- How many teens were married with children? ____
- How many teens were in the survey? ____
- How many people were unmarried with children? ____
- How many people were married with children? ____
At the beginning of this exercise set, you learned how to place elements in their proper regions given information about the elements in some sets. The same process can be used when only considering the cardinality of a set or region. We will do an example involving two sets, C and B, where \(n\)(U) = 35, \(n\)(C) = 20, \(n\)(B) = 15 and \(n\)(B – C) = 10.
STEP 1: Again, we first have to isolate a region. B – C is an isolated region and so we can fill 10 into that spot as shown in the Venn below:

STEP 2: We can fill 5 into the other region of B since B has a total of 15 elements (10 + 5 = 15) .

STEP 3: Since C has a total of 20 elements, we can fill in the other region of C with the number 15.

STEP 4: There is only one region left to fill and since the total number of elements is 35, the final region to fill in must be 5.

Usually, the above problem would have been a word problem worded something like this:
A class of 35 students was surveyed and it was determined that 20 students owned a car, 15 owned a bike and 10 of those owning a bike did not have a car. How many students owned both a bike and a car? How many students owned only a car? How many students owned neither a bike or car?
In order to answer these questions, one might consider drawing a Venn diagram containing two sets, C and B, where C would represent the number of students owning cars and B would represent the number of students owning bikes. Notice the first step would be in defining your variables! Next, after reading through the information given, one could conclude that the information could be written down symbolically like this: \(n\)(U) = 35, \(n\)(C) = 20, \(n\)(B) = 15 and \(n\)(B – C) = 10. Does this look familiar? From here, the steps would be exactly the same as we just did in the above example. The person could then look at the Venn diagram and answer the questions asked.
- How many students owned both a bike and a car? (Look at \(\bf B \cap C\)): \(\underline{5}\)
- How many students owned only a car? (Look at C – B)): \(\underline{15}\)
- How many students owned neither a bike or car? (Look at \((\bf B \cup C)^{c}\)): \(\underline{5}\)
Twenty preschoolers were surveyed about whether or not they had dogs and/or cats as pets in their home. Ten children owned both animals. Four had no pets at home and 14 owned dogs. Construct a Venn diagram representing how many had each kind of animal and answer the questions asked based on your diagram. Use meaningful letters to represent your sets!!
| a. How many children owned cats? |
| b. How many children owned cats only? |
| c. How many kids didn't own a dog? |
It's now time to practice constructing a three set Venn diagram given the following information provided about three sets, A, B and C:
| \(n\)(\(\bf (A \cap B) - C)\) = 2 | \(n\)(B – C) = 8 |
| \(n\)(A – B) = 7 | \(n\)(A) = 13 |
| \(n\)(\(\bf A - (B \cup C)\)) = 4 | \(n\)(B) = 20 |
| \(n\)(C – B) = 13 | \(n\)(U) = 42 |
We will construct a Venn diagram showing the cardinality of each region and then find:
| a. \(n\)(\(\bf (B \cap C)\)) |
| c. \(n\)(\(\bf B^{c}\)) |
| e. \(n\)(\(\bf (A \cup C) - B\)) |
| f. \(n\)(\(\bf (C - (A \cup B)\) |
| g. \(n\)(A) |
| h. \(n\)(\(\bf (A \cup B \cup C)^{c})\) |
| b. \(n\)(A – C) |
| d. \(n\)(C) |
STEP 1: Draw a three set Venn diagram and see if any of the information given is specific enough to cover just one region. \(\bf (A \cap B) - C\) and \(\bf A - (B \cup C)\) each cover one region so fill in those regions first.

STEP 2: B – C and A – B each have two regions with one region of each already filled in. The two regions of B – C must add up to 8 so that leaves 6 for the other part. Similarly, the two regions of A – B must add up to 7 leaving 3 for the other region.
STEP 3: A has three of its four regions filled in now, so we can fill 4 into the last region of A since \(n\)(A) = 13, which means all four regions of A must add up to 13.

STEP 4: Note that B has all but one of its regions filled in now, so we can fill in that last region with 8 since \(n\)(B) = 20.

STEP 5: Since \(n\)(C – B) = 13 and one of the two regions of C – B is 3, that leaves 10 to be filled into the other region.

STEP 6: There is only one region left to fill in and since the universe contains 42 elements, there are 5 elements left to be accounted for. This completes this part of the process.
STEP 7: This step is very important! Make sure you go back and check your work very carefully. Eight pieces of information were given at the beginning of the problem. Go back and check each one individually. For instance, make sure that when you look at your completed diagram, it is still true that \(n\)(B – C) = 8, \(n\)(A – B) = 7, \(n\)(A) = 13, \(n\)(\(\bf A - (B \cup C)\)) = 4, \(n\)(C – B) = 13, etc.
STEP 8: Look at the completed Venn diagram and now answer the questions posed:
| a. \(n\)(\(\bf B \cap C\)) = 12 |
| b. \(n\)(A – C) = 6 |
| c. \(n\)(\(\bf B^{c}\)) = 22 |
| d. \(n\)(C) = 25 |
| e. \(n\)(\(\bf (A \cup C) - B\)) = 17 |
| f. \(n\)(\(\bf (C - (A \cup B)\)) = 10 |
| g. \(n\)(A) = 13 |
| h. \(n\)(\(\bf (A \cup B \cup C)^{c}\)) =5 |
More often, the above problem would have been presented as a survey–type problem where answers could be answered using set theory. Consider the next example.
A survey of 42 men was taken asking about their likes of certain female names: Amy, Beth and Cindy. It was discovered that 13 men liked the name Amy, 20 of them liked Beth, 8 liked Beth but not Cindy, 13 liked Cindy but not Beth, 7 liked Amy but not Beth, 4 liked only the name Amy and 2 liked Amy and Beth but not the name Cindy. Find the following:
- How many men liked both the names Beth and Cindy?
- How many men liked the name Amy but not the name Cindy?
- How many men didn't like the name Beth?
- How many men liked the name Cindy?
- How many men didn't like the name Beth, but did like at least one of the other names?
- How many men liked only the name Cindy?
- How many men liked the name Amy?
- How many men didn't like any of the names?
This problem could be solved by first letting the letters A, B and C represent the sets of men who liked the names Amy, Beth and Cindy, respectively. Next, you could write out the eight clues given using set notation, which will give you the exact same eight clues given at the beginning of the previous example! Or, you might go straight to a Venn diagram, deciding which part of the Venn diagram each clue is linked to and start filling in the numbers. The questions asked are also exactly the same as in the previous example. Try this problem in this form and then check your answers by looking back at the previous example. Make sure you can do this one successfully on your own before trying the next two exercises.
A survey of 60 college students was taken asking about which meals they regularly ate at school. Thirty students usually ate breakfast at school, 26 usually ate lunch there
and 23 usually ate dinner at school. Six students said they ate all three meals at school. Eleven ate both breakfast and lunch there whereas 15 only ate breakfast at school and 12 only ate lunch there. Label the sets and fill in the Venn diagram below representing this information and answer the following questions:

| a. How many students ate both lunch and dinner at school? |
| b. How many didn't eat any meals at school? |
| c. How many only ate dinner at school? |
| d. How many ate breakfast and/or dinner at school? |
| e. How many ate exactly one meal at school? |
| f. How many ate at least two meals at school? |
| g. How many ate both lunch and dinner at school, but not breakfast? |
Another group of students was asked which old reruns of Dick Van Dyke, Gilligan's Island and The Honeymooners they liked to watch on late night T.V. 34 liked both Dick Van Dyke and Gilligan's Island while 7 liked only Dick Van Dyke and 11 liked only Gilligan's Island. 15 liked Dick Van Dyke but not Gilligan's Island whereas 21 liked Gilligan's Island but not Dick Van Dyke. 27 didn't like The Honeymooner's but liked at least one of the other programs. 31 didn't like The Honeymooners and 20 liked The Honeymooners but not Gilligan's Island. Label the sets and fill in the Venn diagram below representing this information. Then, answer the following questions:

In working with Venn diagrams so far, we've basically restricted the picture to three sets and shown the same template over and over again where the sets overlap each other. For a particular problem, a Venn diagram might be represented very differently. For instance, consider U = {1, 2, 3, 4, 5, 6, 7, 8, 9} with subsets A, B and C defined as follows:
A={3, 5}, B={2, 3, 4, 5} and C={7, 8}. We could show the elements of the universe in the two ways shown below. The Venn on the left shows the conventional way like we've been doing for this exercise set whereas the one on the right is actually a little more specific because it is clear from the picture that \(\bf A \subset B\) and that C has no elements in common with A or B.
 |
 |

It is especially useful to be able to draw a Venn diagram like the second Venn diagram shown above when you are asked to do something like this: Draw a Venn diagram containing sets A, B and C such that \(\bf A \subset B\) with C having no elements in common with A or B. Notice you are not given the specific elements of A and B. The diagram on the right shows one way of representing this information.

Consider these subsets of the A–blocks: Yellow, Triangle and Square. One way of showing how they might be arranged on a Venn diagram is shown on the Venn to the right. Triangles and Squares are disjoint with one another whereas both Triangles and Squares intersect with Yellow.
In the space below, arrange these subsets of the A–blocks, Red (R), Green (G) and Circle (C) in a Venn diagram that clearly shows their relationship to each other.
In the space below, arrange these subsets of the A–blocks, Green (G), Yellow (Y), Blue (B), Red(R), Small (S), in a Venn diagram that clearly shows their relationship to each other.
Let U={1, 2, 3, 4, 5, 6, 7, 8, 9} with these subsets: A={6, 7, 8}, B={2, 3}, C={3, 4}, D={5}, E={1, 2, 3, 4, 5, 6}. In the space below, arrange these sets in a Venn diagram that clearly shows their relationship to each other. It's a bit tricky because there are five subsets, but you can do it!