
Page 2.7: Piecewise Defined Functions
- Page ID
- 131858
Piecewise Defined Functions
Piecewise defined functions are used in many real-world phenomena (e.g. postal rates and income tax formulas) are modeled by such functions. It is important that we are familiar with them and know how to evaluate them.
Consider the absolute value function \(f(x)=\left|x\right|\).
The domain is real numbers and the range is values greater than or equal to 0.
If we input 0 or any positive value, the output is the same value as the input (\(f(0)=\left|0\right|=0\), \(f(3)=\left|3\right|=3\), \(f(7.2)=\left|7.2\right|=7.2\), ...).
\(f(x) = x\) if \(x \ge 0\)
If we input a negative value the sign of the output must change from negative to positive (\(f(-1)=\left|-1\right|=1\), \(f(-4.5)=\left|-4.5\right|=4.5\), ...).
\(f(x) = -x\) if \(x < 0\), since multiplying a negative value by -1 makes it positive.
Since this requires two different processes or pieces, the absolute value function is often called the most basic piecewise defined function.
A piecewise function is a function in which the formula used depends upon the domain the input lies in. We notate this idea like:
\[f(x) = \begin{cases} \text{formula 1, if domain value satisfies given criteria 1} \\ \text{formula 2, if domain value satisfies given criteria 2} \\ \text{formula 3, if domain value satisfies given criteria 3} \end{cases}\nonumber \]
Note that piecewise defined functions are not rescricted to 3 formulas, they may contain 2 or more.
A museum charges $5 per person for a guided tour with a group of 1 to 9 people, or a fixed $50 fee for 10 or more people in the group. Set up a function relating the number of people, \(n\), to the cost, \(C\).
Solution
To set up this function, two different formulas would be needed. C = 5n would work for n values under 10, and C = 50 would work for values of n ten or greater. Notating this:
\[C(n) = \begin{cases} 5n & \text{if 0 < n < 10} \\ 50 &\text{if } n \ge 10\end{cases}\nonumber \]
For the function \(f(x)=\begin{cases}x+6, & \text{if }x<1\\ 3-x^2, &\text{if }x≥1\end{cases}\), find the following:
- \(f(0)\)
- \(f(1)\)
- \(f(3)\)
Solution
- Since the input is 0, we input into the top formula, \(x+6\). So, \(f(0)=0+6=6\)
- Since the input is 1, we input into the top formula, \(x+6\). So, \(f(1)=1+6=7\)
- Since the input is 3 we input into the bottom formula, \(3-x^2\). So, \(f(0)=0+6=6\)
A cell phone company uses the function below to determine the cost, C, in dollars for g gigabytes of data transfer.
\[C(g)=\left\{\begin{array}{ccc} {25} & \text{if} & {0<g<2} \\ {25+10(g-2)} & \text{if} & {g\ge 2} \end{array}\right.\nonumber \]
Find the cost of using 1.5 gigabytes of data, and the cost of using 4 gigabytes of data.
Solution
To find the cost of using 1.5 gigabytes of data, \(C(1.5)\), we first look to see which piece of domain our input falls in. Since 1.5 is less than 2, we use the first formula, giving \(C(1.5)\) = $25.
The find the cost of using 4 gigabytes of data, \(C(4)\), we see that our input of 4 is greater than 2, so we’ll use the second formula. \(C(4)\) = 25 + 10(4 - 2) = $45.
The height \(h\) in feet of a model rocket above the ground \(t\) seconds after lift-off is given by
\[ h(t) = \left\{ \begin{array}{rcl} -5t^2 + 100t, & \mbox{if} & 0 \leq t \leq 20 \\ 0, & \mbox{if} & t > 20 \\ \end{array} \right.\nonumber\]
- Find and interpret \(h(10)\) and \(h(60)\).
- Solve \(h(t) = 375\) and interpret your answers.
Solution
- We first note that the independent variable here is \(t\), chosen because it represents time. Secondly, the function is broken up into two rules: one formula for values of \(t\) between \(0\) and \(20\) inclusive, and another for values of \(t\) greater than 20. Since \(t=10\) satisfies the inequality \(0 \leq t \leq 20\), we use the first formula listed, \(h(t) = -5t^2 + 100t\), to find \(h(10)\). We get \(h(10) = -5(10)^2 + 100(10) = 500\). Since \(t\) represents the number of seconds since lift-off and \(h(t)\) is the height above the ground in feet, the equation \(h(10) = 500\) means that \(10\) seconds after lift-off, the model rocket is \(500\) feet above the ground. To find \(h(60)\), we note that \(t=60\) satisfies \(t > 20\), so we use the rule \(h(t) = 0\). This function returns a value of \(0\) regardless of what value is substituted in for \(t\), so \(h(60) = 0\). This means that \(60\) seconds after lift-off, the rocket is \(0\) feet above the ground; in other words, a minute after lift-off, the rocket has already returned to Earth.
- Since the function \(h\) is defined in pieces, we need to solve \(h(t) = 375\) in pieces. For \(0 \leq t \leq 20\), \(h(t) = -5t^2 + 100t\), so for these values of \(t\), we solve \(-5t^2 + 100t = 375\). Rearranging terms, we get \(5t^2 - 100t + 375 = 0\), and factoring gives \(5(t-5)(t-15) = 0\). Our answers are \(t=5\) and \(t=15\), and since both of these values of \(t\) lie between \(0\) and \(20\), we keep both solutions. For \(t>20\), \(h(t) = 0\), and in this case, there are no solutions to \(0=375\). In terms of the model rocket, solving \(h(t) = 375\) corresponds to finding when, if ever, the rocket reaches \(375\) feet above the ground. Our two answers, \(t=5\) and \(t=15\) correspond to the rocket reaching this altitude twice - once \(5\) seconds after launch, and again \(15\) seconds after launch.
Graphing Piecewise Functions
Previously, we learned how to evaluate piecewise defined functions. Next, let's focus on how to graph them.
Given a piecewise function, sketch a graph.
- Indicate on the x-axis the boundaries defined by the intervals on each piece of the domain.
- For each piece of the domain, graph on that interval using the corresponding equation pertaining to that piece. Do not graph two functions over one interval because it would violate the criteria of a function.
Note: It is important to not just plot some points when graphing piecewise functions.
Sketch a graph of the following piecewise-defined function:
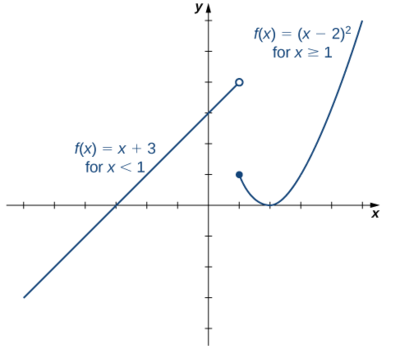
\[f(x)=\begin{cases}x+3, & \text{if } x<1\\(x−2)^2, & \text{if } x≥1\end{cases} \nonumber \]
Solution
Graph the linear function \(y=x+3\) on the interval \((−∞,1)\) and graph the quadratic function \(y=(x−2)^2\) on the interval \([1,∞)\). Since the value of the function at \(x=1\) is given by the formula \(f(x)=(x−2)^2\), we see that \(f(1)=1\). To indicate this on the graph, we draw a closed circle at the point \((1,1)\). The value of the function is given by \(f(x)=x+3\) for all \(x<1\), but not at \(x=1\). To indicate this on the graph, we draw an open circle at \((1,4)\).
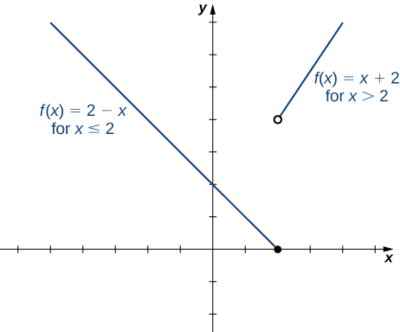
2) Sketch a graph of the function
\(f(x)=\begin{cases}2−x, & \text{if } x≤2\\x+2, & \text{if } x>2\end{cases}.\)
Solution:
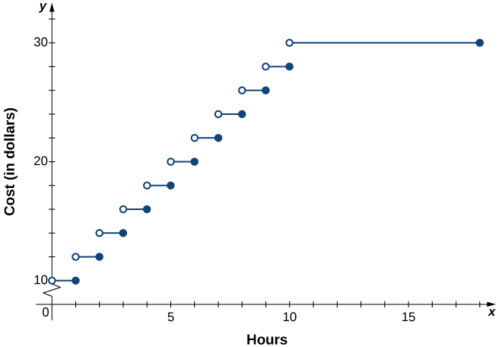
In a big city, drivers are charged variable rates for parking in a parking garage. They are charged $10 for the first hour or any part of the first hour and an additional $2 for each hour or part thereof up to a maximum of $30 for the day. The parking garage is open from 6 a.m. to 12 midnight.
- Write a piecewise-defined function that describes the cost \(C\) to park in the parking garage as a function of hours parked \(x\).
- Sketch a graph of this function \(C(x).\)
Solution
1.Since the parking garage is open 18 hours each day, the domain for this function is \(\{x\,|\,0<x≤18\}\). The cost to park a car at this parking garage can be described piecewise by the function
\[C(x)=\begin{cases}10, & \text{for } 0<x≤1\\12, & \text{for } 1<x≤2\\14, & \text{for } 2<x≤3\\16, & \text{for } 3<x≤4\\ ⋮\\30, & \text{for } 10<x≤18\end{cases}. \nonumber \]
2.The graph of the function consists of several horizontal line segments.
The cost of mailing a letter is a function of the weight of the letter. Suppose the cost of mailing a letter is \(49¢\) for the first ounce and \(21¢\) for each additional ounce. Write a piecewise-defined function describing the cost \(C\) as a function of the weight \(x\) for \(0<x≤3\), where \(C\) is measured in cents and \(x\) is measured in ounces.
- Hint
-
The piecewise-defined function is constant on the intervals \((0,1],\,(1,2],\,….\)
- Answer
-
\[C(x)=\begin{cases}49, 0<x≤1\\70, 1<x≤2\\91, 2<x≤3\end{cases} \nonumber \]
Sketch a graph of the function.
\[f(x)= \begin{cases} x^2 & \text{if $x \leq 1$} \\ 3 &\text{if $1<x\leq2$} \\ x &\text{if $x>2$} \end{cases} \nonumber \]
Solution
Each of the component functions is from our library of toolkit functions, so we know their shapes. We can imagine graphing each function and then limiting the graph to the piece we need for the indicated domain of the piecewise function we are graphing. At the endpoints of the domain interval, draw open circles to indicate where the endpoint is not included because of a less-than or greater-than inequality; we draw a closed circle where the endpoint is included because of a less-than-or-equal-to or greater-than-or-equal-to inequality.
Figure \(\PageIndex{27}\) shows the three components of the piecewise function graphed on separate coordinate systems.
![[Graph of each part of the piece-wise function f(x)]](https://math.libretexts.org/@api/deki/files/896/CNX_Precalc_Figure_01_02_023abc.jpg?revision=1)
Figure \(\PageIndex{27}\): Graph of each part of the piece-wise function f(x)
(a)\( f(x)=x^2\) if \(x≤1\); (b) \(f(x)=3\) if \(1< x≤2\); (c) \(f(x)=x\) if \(x>2\)
Now that we have sketched each piece individually, we then combine them in the same coordinate plane to form the graph of the piecewise function. See Figure \(\PageIndex{28}\).
![[Graph of the entire function.]](https://math.libretexts.org/@api/deki/files/897/CNX_Precalc_Figure_01_02_026.jpg?revision=1)
Analysis
Note that the graph does pass the vertical line test even at \(x=1\) and \(x=2\) because the points \((1,3)\) and \((2,2)\) are not part of the graph of the function, though \((1,1)\) and \((2, 3)\) are.
Graph the following piecewise function.
\[f(x)= \begin{cases} x^3 & \text{if $x < -1$} \\ -2 &\text{if $-1<x<4$} \\ \sqrt{x} &\text{if $x>4$} \end{cases} \nonumber \]
- Answer
-
![[Graph of f(x).]](https://math.libretexts.org/@api/deki/files/898/CNX_Precalc_Figure_01_02_027.jpg?revision=1)
Figure \(\PageIndex{29}\)