
8.E: Review Exercises
- Page ID
- 46291

\( \newcommand{\vecs}[1]{\overset { \scriptstyle \rightharpoonup} {\mathbf{#1}} } \)
\( \newcommand{\vecd}[1]{\overset{-\!-\!\rightharpoonup}{\vphantom{a}\smash {#1}}} \)
\( \newcommand{\dsum}{\displaystyle\sum\limits} \)
\( \newcommand{\dint}{\displaystyle\int\limits} \)
\( \newcommand{\dlim}{\displaystyle\lim\limits} \)
\( \newcommand{\id}{\mathrm{id}}\) \( \newcommand{\Span}{\mathrm{span}}\)
( \newcommand{\kernel}{\mathrm{null}\,}\) \( \newcommand{\range}{\mathrm{range}\,}\)
\( \newcommand{\RealPart}{\mathrm{Re}}\) \( \newcommand{\ImaginaryPart}{\mathrm{Im}}\)
\( \newcommand{\Argument}{\mathrm{Arg}}\) \( \newcommand{\norm}[1]{\| #1 \|}\)
\( \newcommand{\inner}[2]{\langle #1, #2 \rangle}\)
\( \newcommand{\Span}{\mathrm{span}}\)
\( \newcommand{\id}{\mathrm{id}}\)
\( \newcommand{\Span}{\mathrm{span}}\)
\( \newcommand{\kernel}{\mathrm{null}\,}\)
\( \newcommand{\range}{\mathrm{range}\,}\)
\( \newcommand{\RealPart}{\mathrm{Re}}\)
\( \newcommand{\ImaginaryPart}{\mathrm{Im}}\)
\( \newcommand{\Argument}{\mathrm{Arg}}\)
\( \newcommand{\norm}[1]{\| #1 \|}\)
\( \newcommand{\inner}[2]{\langle #1, #2 \rangle}\)
\( \newcommand{\Span}{\mathrm{span}}\) \( \newcommand{\AA}{\unicode[.8,0]{x212B}}\)
\( \newcommand{\vectorA}[1]{\vec{#1}} % arrow\)
\( \newcommand{\vectorAt}[1]{\vec{\text{#1}}} % arrow\)
\( \newcommand{\vectorB}[1]{\overset { \scriptstyle \rightharpoonup} {\mathbf{#1}} } \)
\( \newcommand{\vectorC}[1]{\textbf{#1}} \)
\( \newcommand{\vectorD}[1]{\overrightarrow{#1}} \)
\( \newcommand{\vectorDt}[1]{\overrightarrow{\text{#1}}} \)
\( \newcommand{\vectE}[1]{\overset{-\!-\!\rightharpoonup}{\vphantom{a}\smash{\mathbf {#1}}}} \)
\( \newcommand{\vecs}[1]{\overset { \scriptstyle \rightharpoonup} {\mathbf{#1}} } \)
\(\newcommand{\longvect}{\overrightarrow}\)
\( \newcommand{\vecd}[1]{\overset{-\!-\!\rightharpoonup}{\vphantom{a}\smash {#1}}} \)
\(\newcommand{\avec}{\mathbf a}\) \(\newcommand{\bvec}{\mathbf b}\) \(\newcommand{\cvec}{\mathbf c}\) \(\newcommand{\dvec}{\mathbf d}\) \(\newcommand{\dtil}{\widetilde{\mathbf d}}\) \(\newcommand{\evec}{\mathbf e}\) \(\newcommand{\fvec}{\mathbf f}\) \(\newcommand{\nvec}{\mathbf n}\) \(\newcommand{\pvec}{\mathbf p}\) \(\newcommand{\qvec}{\mathbf q}\) \(\newcommand{\svec}{\mathbf s}\) \(\newcommand{\tvec}{\mathbf t}\) \(\newcommand{\uvec}{\mathbf u}\) \(\newcommand{\vvec}{\mathbf v}\) \(\newcommand{\wvec}{\mathbf w}\) \(\newcommand{\xvec}{\mathbf x}\) \(\newcommand{\yvec}{\mathbf y}\) \(\newcommand{\zvec}{\mathbf z}\) \(\newcommand{\rvec}{\mathbf r}\) \(\newcommand{\mvec}{\mathbf m}\) \(\newcommand{\zerovec}{\mathbf 0}\) \(\newcommand{\onevec}{\mathbf 1}\) \(\newcommand{\real}{\mathbb R}\) \(\newcommand{\twovec}[2]{\left[\begin{array}{r}#1 \\ #2 \end{array}\right]}\) \(\newcommand{\ctwovec}[2]{\left[\begin{array}{c}#1 \\ #2 \end{array}\right]}\) \(\newcommand{\threevec}[3]{\left[\begin{array}{r}#1 \\ #2 \\ #3 \end{array}\right]}\) \(\newcommand{\cthreevec}[3]{\left[\begin{array}{c}#1 \\ #2 \\ #3 \end{array}\right]}\) \(\newcommand{\fourvec}[4]{\left[\begin{array}{r}#1 \\ #2 \\ #3 \\ #4 \end{array}\right]}\) \(\newcommand{\cfourvec}[4]{\left[\begin{array}{c}#1 \\ #2 \\ #3 \\ #4 \end{array}\right]}\) \(\newcommand{\fivevec}[5]{\left[\begin{array}{r}#1 \\ #2 \\ #3 \\ #4 \\ #5 \\ \end{array}\right]}\) \(\newcommand{\cfivevec}[5]{\left[\begin{array}{c}#1 \\ #2 \\ #3 \\ #4 \\ #5 \\ \end{array}\right]}\) \(\newcommand{\mattwo}[4]{\left[\begin{array}{rr}#1 \amp #2 \\ #3 \amp #4 \\ \end{array}\right]}\) \(\newcommand{\laspan}[1]{\text{Span}\{#1\}}\) \(\newcommand{\bcal}{\cal B}\) \(\newcommand{\ccal}{\cal C}\) \(\newcommand{\scal}{\cal S}\) \(\newcommand{\wcal}{\cal W}\) \(\newcommand{\ecal}{\cal E}\) \(\newcommand{\coords}[2]{\left\{#1\right\}_{#2}}\) \(\newcommand{\gray}[1]{\color{gray}{#1}}\) \(\newcommand{\lgray}[1]{\color{lightgray}{#1}}\) \(\newcommand{\rank}{\operatorname{rank}}\) \(\newcommand{\row}{\text{Row}}\) \(\newcommand{\col}{\text{Col}}\) \(\renewcommand{\row}{\text{Row}}\) \(\newcommand{\nul}{\text{Nul}}\) \(\newcommand{\var}{\text{Var}}\) \(\newcommand{\corr}{\text{corr}}\) \(\newcommand{\len}[1]{\left|#1\right|}\) \(\newcommand{\bbar}{\overline{\bvec}}\) \(\newcommand{\bhat}{\widehat{\bvec}}\) \(\newcommand{\bperp}{\bvec^\perp}\) \(\newcommand{\xhat}{\widehat{\xvec}}\) \(\newcommand{\vhat}{\widehat{\vvec}}\) \(\newcommand{\uhat}{\widehat{\uvec}}\) \(\newcommand{\what}{\widehat{\wvec}}\) \(\newcommand{\Sighat}{\widehat{\Sigma}}\) \(\newcommand{\lt}{<}\) \(\newcommand{\gt}{>}\) \(\newcommand{\amp}{&}\) \(\definecolor{fillinmathshade}{gray}{0.9}\)Chapter 4 Review Exercises
Rectangular Coordinate System
Plot Points in a Rectangular Coordinate System
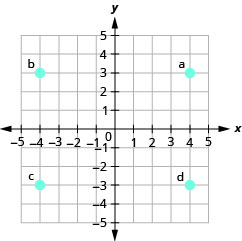
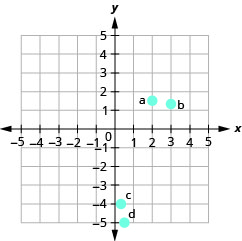
In the following exercises, plot each point in a rectangular coordinate system.
- (−1,−5)
- (−3,4)
- (2,−3)
- \(\left(1, \frac{5}{2}\right)\)
- (4,3)
- (−4,3)
- (−4,−3)
- (4,−3)
- Answer
-
- (−2,0)
- (0,−4)
- (0,5)
- (3,0)
- \(\left(2, \frac{3}{2}\right)\)
- \(\left(3, \frac{4}{3}\right)\)
- \(\left(\frac{1}{3},-4\right)\)
- \(\left(\frac{1}{2},-5\right)\)
- Answer
-
Identify Points on a Graph
In the following exercises, name the ordered pair of each point shown in the rectangular coordinate system.
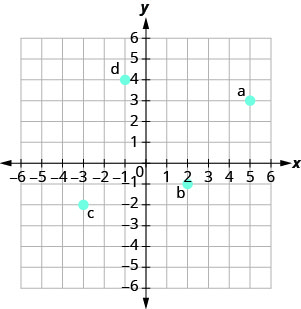
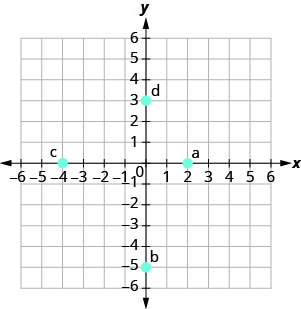
- Answer
-
a. (2,0)
b (0,−5)
c (−4.0)
d (0,3)
Verify Solutions to an Equation in Two Variables
In the following exercises, which ordered pairs are solutions to the given equations?
\(5x+y=10\)
- (5,1)
- (2,0)
- (4,−10)
\(y=6x−2\)
- (1,4)
- \(\left(\frac{1}{3}, 0\right)\)
- (6,−2)
- Answer
-
1, 2
Complete a Table of Solutions to a Linear Equation in Two Variables
In the following exercises, complete the table to find solutions to each linear equation.
\(y=4 x-1\)
| x | y | (x,y) |
| 0 | ||
| 1 | ||
| -2 |
\(y=-\frac{1}{2} x+3\)
| x | y | (x,y) |
| 0 | ||
| 4 | ||
| -2 |
- Answer
-
x y (x,y) 0 3 (0,3) 4 1 (4, 1) −2 4 (−2,4)
\(x+2 y=5\)
| x | y | (x,y) |
| 0 | ||
| 1 | ||
| -1 |
\(3x+2y=6\)
| x | y | (x,y) |
| 0 | ||
| 0 | ||
| -2 |
- Answer
-
x y (x,y) 0 −3 (0,−3) 2 0 (2,0) −2 −6 (−2,−6)
Find Solutions to a Linear Equation in Two Variables
In the following exercises, find three solutions to each linear equation.
\(x+y=3\)
\(x+y=-4\)
- Answer
-
Answers will vary.
\(y=3 x+1\)
\(y=-x-1\)
- Answer
-
Answers will vary.
Graphing Linear Equations
Recognize the Relation Between the Solutions of an Equation and its Graph
In the following exercises, for each ordered pair, decide:
- Is the ordered pair a solution to the equation?
- Is the point on the line?
\(y=−x+4\)
(0,4) (−1,3)
(2,2) (−2,6)
\(y=\frac{2}{3} x-1\)
\((0,-1) (3,1)\)
\((-3,-3) (6,4)\)
- Answer
-
- yes; yes
- yes; no
Graph a Linear Equation by Plotting Points
In the following exercises, graph by plotting points.
\(y=4x-3\)
\(y=-3x\)
- Answer
-
\(y=\frac{1}{2} x+3\)
\(x-y=6\)
- Answer
-
\(2x+y=7\)
\(3x-2y=6\)
- Answer
-
Graph Vertical and Horizontal lines
In the following exercises, graph each equation.
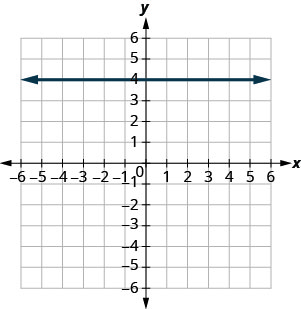
\(y=-2\)
\(x=3\)
- Answer
-
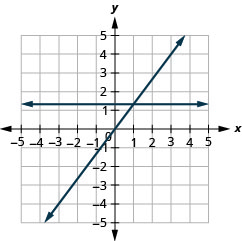
In the following exercises, graph each pair of equations in the same rectangular coordinate system.
\(y=-2 x\) and \(y=-2\)
\(y=\frac{4}{3} x\) and \(y=\frac{4}{3}\)
- Answer
-
Graphing with Intercepts
Identify the \(x\)- and \(y\)-Intercepts on a Graph
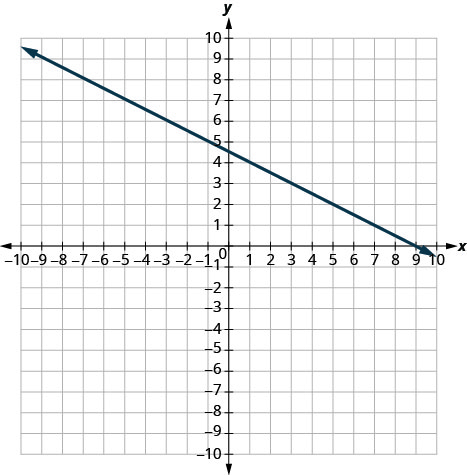
In the following exercises, find the \(x\)- and \(y\)-intercepts.
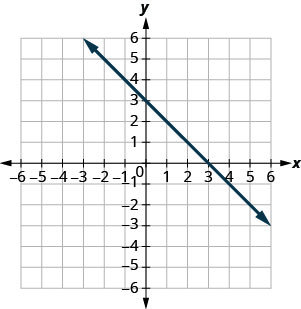
- Answer
-
\((3,0)\) and \((0,3)\)
Find the\(x\)- and \(y\)-Intercepts from an Equation of a Line
In the following exercises, find the intercepts of each equation.
\(x+y=5\)
\(x-y=-1\)
- Answer
-
\((-1,0),(0,1)\)
\(x+2y=6\)
\(2x+3y=12\)
- Answer
-
\((6,0),(0,4)\)
\(y=\frac{3}{4} x-12\)
\(y=3x\)
- Answer
-
\((0,0)\)
Graph a Line Using the Intercepts
In the following exercises, graph using the intercepts.
\(-x+3y=3\)
\(x+y=-2\)
- Answer
-
\(x-y=4\)
\(2x-y=5\)
- Answer
-
\(2x-4y=8\)
\(y=2x\)
- Answer
-
Slope of a Line
Use Geoboards to Model Slope
In the following exercises, find the slope modeled on each geoboard.


- Answer
-
\(\frac{4}{3}\)


- Answer
-
\(-\frac{2}{3}\)
\(\frac{1}{3}\)
\(\frac{3}{2}\)
- Answer
-

\(-\frac{2}{3}\)
\(-\frac{1}{2}\)
- Answer
-

Use \(m=\frac{\text { rise }}{\text { run }}\) to find the Slope of a Line from its Graph
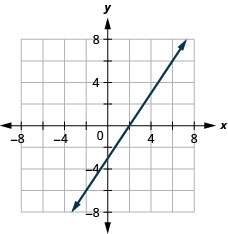
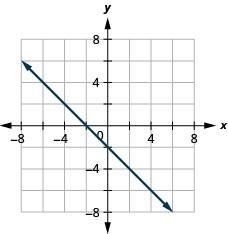
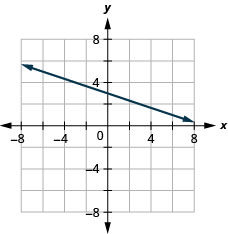
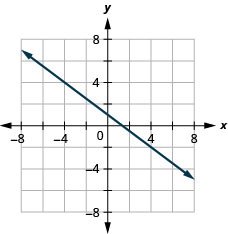
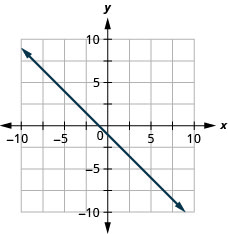
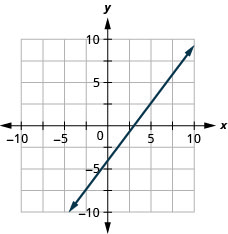
In the following exercises, find the slope of each line shown.

- Answer
-
1
- Answer
-
\(-\frac{1}{2}\)
Find the Slope of Horizontal and Vertical Lines
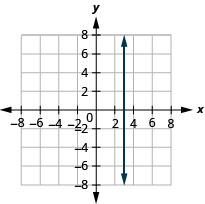
In the following exercises, find the slope of each line.
\(y=2\)
\(x=5\)
- Answer
-
undefined
\(x=-3\)
\(y=-1\)
- Answer
-
0
Use the Slope Formula to find the Slope of a Line between Two Points
In the following exercises, use the slope formula to find the slope of the line between each pair of points.
\((-1,-1),(0,5)\)
\((3,5),(4,-1)\)
- Answer
-
−6
\((-5,-2),(3,2)\)
\((2,1),(4,6)\)
- Answer
-
\(\frac{5}{2}\)
Graph a Line Given a Point and the Slope
In the following exercises, graph each line with the given point and slope.
\((2,-2) ; \quad m=\frac{5}{2}\)
\((-3,4) ; \quad m=-\frac{1}{3}\)
- Answer
-
\(x\) -intercept \(-4 ; \quad m=3\)
\(y\) -intercept \(1 ; \quad m=-\frac{3}{4}\)
- Answer
-
Solve Slope Applications
In the following exercises, solve these slope applications.
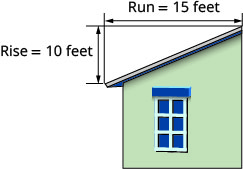
The roof pictured below has a rise of \(10\) feet and a run of \(15\) feet. What is its slope?
A mountain road rises \(50\) feet for a \(500\)-foot run. What is its slope?
- Answer
-
\(\frac{1}{10}\)
Intercept Form of an Equation of a Line
Recognize the Relation Between the Graph and the Slope–Intercept Form of an Equation of a Line
In the following exercises, use the graph to find the slope and y-intercept of each line. Compare the values to the equation \(y=mx+b\).
\(y=4x−1\)
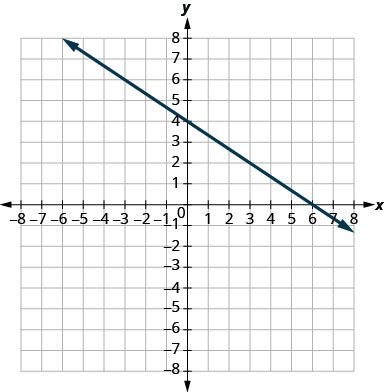
\(y=-\frac{2}{3} x+4\)
- Answer
-
slope \(m=-\frac{2}{3}\) and \(y\)-intercept \((0,4)\)
Identify the Slope and y-Intercept from an Equation of a Line
In the following exercises, identify the slope and \(y\)-intercept of each line.
\(y=-4 x+9\)
\(y=\frac{5}{3} x-6\)
- Answer
-
\(\frac{5}{3} ;(0,-6)\)
\(5x+y=10\)
\(4x-5y=8\)
- Answer
-
\(\frac{4}{5} ;\quad \left(0,-\frac{8}{5}\right)\)
Graph a Line Using Its Slope and Intercept
In the following exercises, graph the line of each equation using its slope and \(y\)-intercept.
\(y=2x+3\)
\(y=-x-1\)
- Answer
-
\(y=-\frac{2}{5} x+3\)
\(4x-3y=12\)
- Answer
-
In the following exercises, determine the most convenient method to graph each line.
\(x=5\)
\(y=-3\)
- Answer
-
horizontal line
\(2x+y=5\)
\(x-y=2\)
- Answer
-
intercepts
\(y=x+2\)
\(y=\frac{3}{4} x-1\)
- Answer
-
plotting points
Graph and Interpret Applications of Slope–Intercept
Katherine is a private chef. The equation \(C=6.5m+42\) models the relation between her weekly cost, \(C\), in dollars and the number of meals, \(m\), that she serves.
- Find Katherine’s cost for a week when she serves no meals.
- Find the cost for a week when she serves \(14\) meals.
- Interpret the slope and \(C\)-intercept of the equation.
- Graph the equation.
Marjorie teaches piano. The equation \(P=35h−250\) models the relation between her weekly profit, \(P\), in dollars and the number of student lessons, \(s\), that she teaches.
- Find Marjorie’s profit for a week when she teaches no student lessons.
- Find the profit for a week when she teaches \(20\) student lessons.
- Interpret the slope and \(P\)-intercept of the equation.
- Graph the equation.
- Answer
-
- \(−$250\)
- \($450\)
- The slope, \(35\), means that Marjorie’s weekly profit, \(P\), increases by \($35\) for each additional student lesson she teaches. The \(P\)-intercept means that when the number of lessons is \(0\), Marjorie loses \($250\).
Use Slopes to Identify Parallel Lines
In the following exercises, use slopes and \(y\)-intercepts to determine if the lines are parallel.
\(4x-3y=-1 ; \quad y=\frac{4}{3} x-3\)
\(2 x-y=8 ; \quad x-2 y=4\)
- Answer
-
not parallel
Use Slopes to Identify Perpendicular Lines
In the following exercises, use slopes and y-intercepts to determine if the lines are perpendicular.
\(y=5x-1 ; \quad 10x+2y=0\)
\(3x-2y=5 ; \quad 2x+3y=6\)
- Answer
-
perpendicular
Find the Equation of a Line
Find an Equation of the Line Given the Slope and y-Intercept
In the following exercises, find the equation of a line with given slope and \(y\)-intercept. Write the equation in slope–intercept form.
slope \(\frac{1}{3}\) and \(y\)-intercept \((0,-6)\)
slope \(-5\) and \(y\)-intercept \((0,-3)\)
- Answer
-
\(y=-5x-3\)
slope \(0\) and \(y\)-intercept \((0,4)\)
slope \(-2\) and \(y\)-intercept \((0,0)\)
- Answer
-
\(y=-2x\)
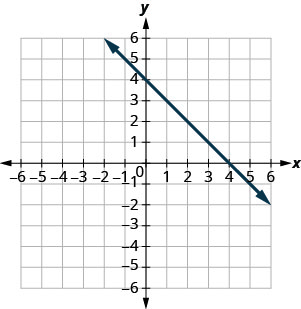
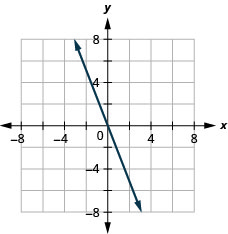
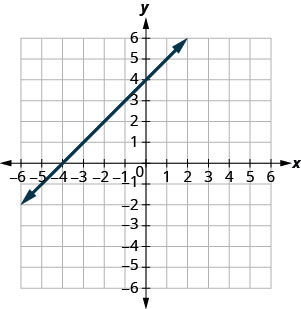
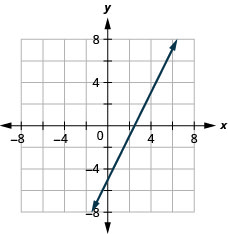
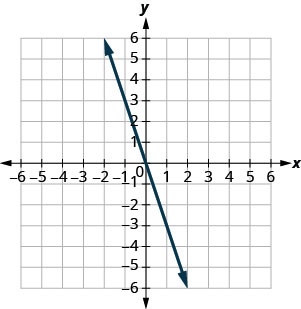
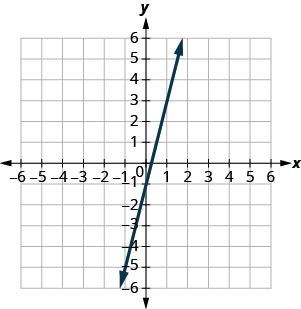
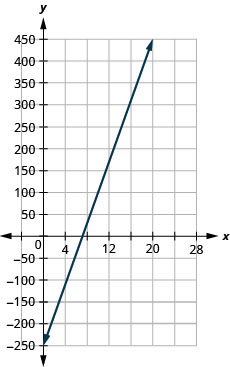
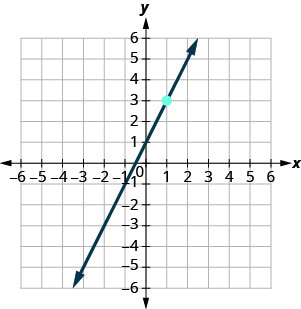
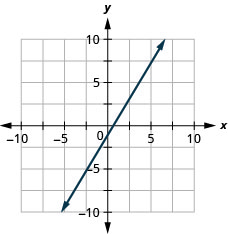
In the following exercises, find the equation of the line shown in each graph. Write the equation in slope–intercept form.
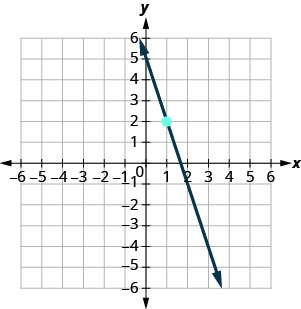
- Answer
-
\(y=-3x+5\)
- Answer
-
\(y=-4\)
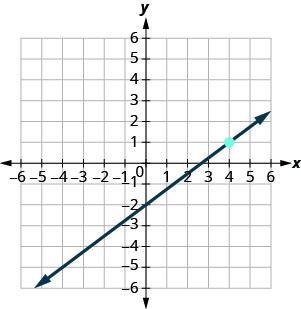
Find an Equation of the Line Given the Slope and a Point
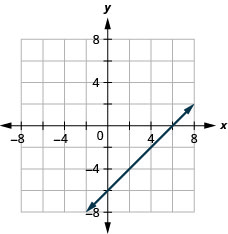
In the following exercises, find the equation of a line with given slope and containing the given point. Write the equation in slope–intercept form.
\(m=-\frac{1}{4},\) point \((-8,3)\)
\(m=\frac{3}{5},\) point \((10,6)\)
- Answer
-
\(y=\frac{3}{5} x\)
Horizontal line containing \((-2,7)\)
\(m=-2,\) point \((-1,-3)\)
- Answer
-
\(y=-2x-5\)
Find an Equation of the Line Given Two Points
In the following exercises, find the equation of a line containing the given points. Write the equation in slope–intercept form.
\((2,10)\) and \((-2,-2)\)
\((7,1)\) and \((5,0)\)
- Answer
-
\(y=\frac{1}{2} x-\frac{5}{2}\)
\((3,8)\) and \((3,-4)\)
\((5,2)\) and \((-1,2)\)
- Answer
-
\(y=2\)
Find an Equation of a Line Parallel to a Given Line
In the following exercises, find an equation of a line parallel to the given line and contains the given point. Write the equation in slope–intercept form.
line \(y=-3x+6,\) point \((1,-5)\)
line \(2x+5y=-10,\) point \((10,4)\)
- Answer
-
\(y=-\frac{2}{5} x+8\)
line \(x=4,\) point \((-2,-1)\)
line \(y=-5,\) point \((-4,3)\)
- Answer
-
\(y=3\)
Find an Equation of a Line Perpendicular to a Given Line
In the following exercises, find an equation of a line perpendicular to the given line and contains the given point. Write the equation in slope–intercept form.
line \(y=-\frac{4}{5} x+2,\) point \((8,9)\)
line \(2x-3y=9,\) point \((-4,0)\)
- Answer
-
\(y=-\frac{3}{2} x-6\)
line \(y=3,\) point \((-1,-3)\)
line \(x=-5\) point \((2,1)\)
- Answer
-
\(y=1\)
Graph Linear Inequalities
Verify Solutions to an Inequality in Two Variables
In the following exercises, determine whether each ordered pair is a solution to the given inequality.
Determine whether each ordered pair is a solution to the inequality \(y<x−3\):
- \((0,1)\)
- \((−2,−4)\)
- \((5,2)\)
- \((3,−1)\)
- \((−1,−5)\)
Determine whether each ordered pair is a solution to the inequality \(x+y>4\):
- \((6,1)\)
- \((−3,6)\)
- \((3,2)\)
- \((−5,10)\)
- \((0,0)\)
- Answer
-
- yes
- no
- yes
- yes
- no
Recognize the Relation Between the Solutions of an Inequality and its Graph
In the following exercises, write the inequality shown by the shaded region.
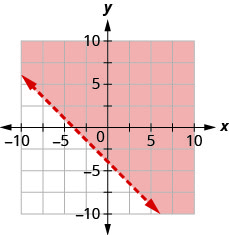
Write the inequality shown by the graph with the boundary line \(y=−x+2\).
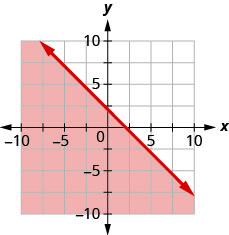
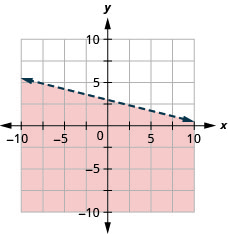
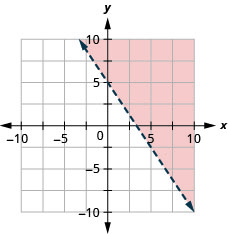
Write the inequality shown by the graph with the boundary line \(y=\frac{2}{3} x-3\)
- Answer
-
\(y>\frac{2}{3} x-3\)
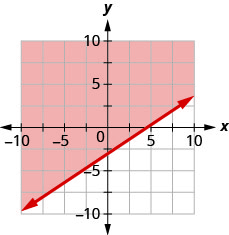
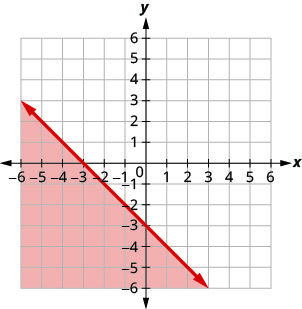
Write the inequality shown by the shaded region in the graph with the boundary line \(x+y=−4\).
Write the inequality shown by the shaded region in the graph with the boundary line \(x−2y=6\).
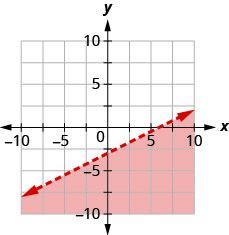
- Answer
-
\(x-2 y \geq 6\)
Graph Linear Inequalities
In the following exercises, graph each linear inequality.
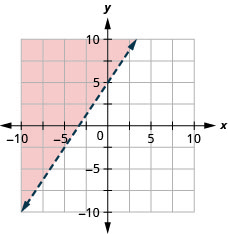
Graph the linear inequality \(y>\frac{2}{5} x-4\)
Graph the linear inequality \(y \leq-\frac{1}{4} x+3\)
- Answer
-
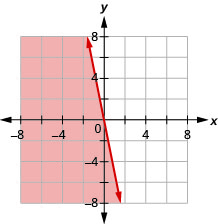
Graph the linear inequality \(x-y \leq 5\)
Graph the linear inequality \(3 x+2 y>10\)
- Answer
-
Graph the linear inequality \(y \leq-3 x\)
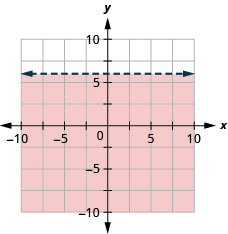
Graph the linear inequality \(y<6\)
- Answer
-
Practice Test
Plot each point in a rectangular coordinate system.
- \((2,5)\)
- \((−1,−3)\)
- \((0,2)\)
- \(\left(-4, \frac{3}{2}\right)\)
- \((5,0)\)
Which of the given ordered pairs are solutions to the equation \(3x−y=6\)?
- \((3,3)\)
- \((2,0)\)
- \((4,−6)\)
- Answer
-
- yes
- yes
- no
Find three solutions to the linear equation \(y=-2x-4\)
Find the \(x\)- and \(y\)-intercepts of the equation \(4x-3y=12\)
- Answer
-
\((3,0),(0,-4)\)
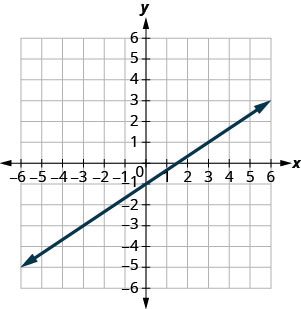
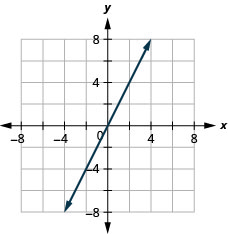
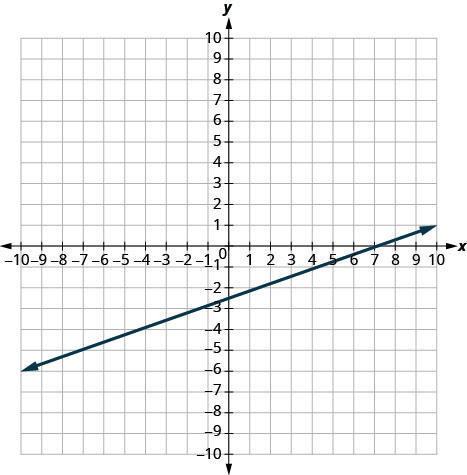
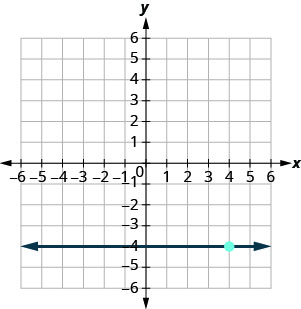
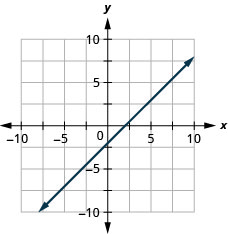
Find the slope of each line shown.
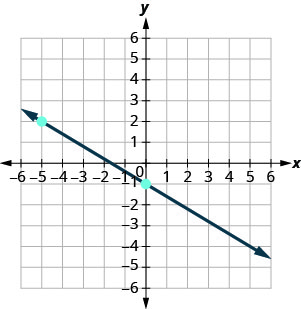
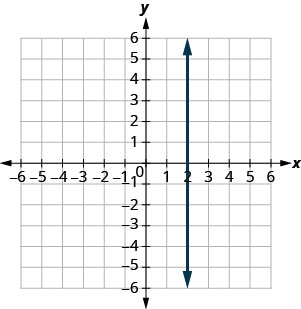
- Answer
-
undefined
Find the slope of the line between the points \((5,2)\) and \((-1,-4)\)
- Answer
-
1
Graph the line with slope \(\frac{1}{2}\) containing the point \((-3,-4)\)
Graph the line for each of the following equations.
\(y=\frac{5}{3} x-1\)
- Answer
-
\(y=-x\)
\(x-y=2\)
- Answer
-
\(4x+2y=-8\)
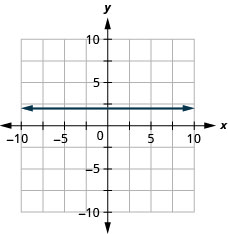
\(y=2\)
- Answer
-
\(x=-3\)
Find the equation of each line. Write the equation in slope–intercept form.
slope \(-\frac{3}{4}\) and \(y\)-intercept \((0,-2)\)
- Answer
-
\(y=-\frac{3}{4} x-2\)
\(m=2,\) point \((-3,-1)\)
containing \((10,1)\) and \((6,-1)\)
- Answer
-
\(y=\frac{1}{2} x-4\)
parallel to the line \(y=-\frac{2}{3} x-1,\) containing the point \((-3,8)\)
perpendicular to the line \(y=\frac{5}{4} x+2,\) containing the point \((-10,3)\)
- Answer
-
\(y=-\frac{4}{5} x-5\)
Write the inequality shown by the graph with the boundary line \(y=−x−3\).
Graph each linear inequality.
\(y>\frac{3}{2} x+5\)
- Answer
-
\(x-y \geq-4\)
\(y \leq-5 x\)
- Answer
-
\(y<3\)