
31.1: Tape Diagrams and Equations
- Page ID
- 35081

\( \newcommand{\vecs}[1]{\overset { \scriptstyle \rightharpoonup} {\mathbf{#1}} } \)
\( \newcommand{\vecd}[1]{\overset{-\!-\!\rightharpoonup}{\vphantom{a}\smash {#1}}} \)
\( \newcommand{\dsum}{\displaystyle\sum\limits} \)
\( \newcommand{\dint}{\displaystyle\int\limits} \)
\( \newcommand{\dlim}{\displaystyle\lim\limits} \)
\( \newcommand{\id}{\mathrm{id}}\) \( \newcommand{\Span}{\mathrm{span}}\)
( \newcommand{\kernel}{\mathrm{null}\,}\) \( \newcommand{\range}{\mathrm{range}\,}\)
\( \newcommand{\RealPart}{\mathrm{Re}}\) \( \newcommand{\ImaginaryPart}{\mathrm{Im}}\)
\( \newcommand{\Argument}{\mathrm{Arg}}\) \( \newcommand{\norm}[1]{\| #1 \|}\)
\( \newcommand{\inner}[2]{\langle #1, #2 \rangle}\)
\( \newcommand{\Span}{\mathrm{span}}\)
\( \newcommand{\id}{\mathrm{id}}\)
\( \newcommand{\Span}{\mathrm{span}}\)
\( \newcommand{\kernel}{\mathrm{null}\,}\)
\( \newcommand{\range}{\mathrm{range}\,}\)
\( \newcommand{\RealPart}{\mathrm{Re}}\)
\( \newcommand{\ImaginaryPart}{\mathrm{Im}}\)
\( \newcommand{\Argument}{\mathrm{Arg}}\)
\( \newcommand{\norm}[1]{\| #1 \|}\)
\( \newcommand{\inner}[2]{\langle #1, #2 \rangle}\)
\( \newcommand{\Span}{\mathrm{span}}\) \( \newcommand{\AA}{\unicode[.8,0]{x212B}}\)
\( \newcommand{\vectorA}[1]{\vec{#1}} % arrow\)
\( \newcommand{\vectorAt}[1]{\vec{\text{#1}}} % arrow\)
\( \newcommand{\vectorB}[1]{\overset { \scriptstyle \rightharpoonup} {\mathbf{#1}} } \)
\( \newcommand{\vectorC}[1]{\textbf{#1}} \)
\( \newcommand{\vectorD}[1]{\overrightarrow{#1}} \)
\( \newcommand{\vectorDt}[1]{\overrightarrow{\text{#1}}} \)
\( \newcommand{\vectE}[1]{\overset{-\!-\!\rightharpoonup}{\vphantom{a}\smash{\mathbf {#1}}}} \)
\( \newcommand{\vecs}[1]{\overset { \scriptstyle \rightharpoonup} {\mathbf{#1}} } \)
\(\newcommand{\longvect}{\overrightarrow}\)
\( \newcommand{\vecd}[1]{\overset{-\!-\!\rightharpoonup}{\vphantom{a}\smash {#1}}} \)
\(\newcommand{\avec}{\mathbf a}\) \(\newcommand{\bvec}{\mathbf b}\) \(\newcommand{\cvec}{\mathbf c}\) \(\newcommand{\dvec}{\mathbf d}\) \(\newcommand{\dtil}{\widetilde{\mathbf d}}\) \(\newcommand{\evec}{\mathbf e}\) \(\newcommand{\fvec}{\mathbf f}\) \(\newcommand{\nvec}{\mathbf n}\) \(\newcommand{\pvec}{\mathbf p}\) \(\newcommand{\qvec}{\mathbf q}\) \(\newcommand{\svec}{\mathbf s}\) \(\newcommand{\tvec}{\mathbf t}\) \(\newcommand{\uvec}{\mathbf u}\) \(\newcommand{\vvec}{\mathbf v}\) \(\newcommand{\wvec}{\mathbf w}\) \(\newcommand{\xvec}{\mathbf x}\) \(\newcommand{\yvec}{\mathbf y}\) \(\newcommand{\zvec}{\mathbf z}\) \(\newcommand{\rvec}{\mathbf r}\) \(\newcommand{\mvec}{\mathbf m}\) \(\newcommand{\zerovec}{\mathbf 0}\) \(\newcommand{\onevec}{\mathbf 1}\) \(\newcommand{\real}{\mathbb R}\) \(\newcommand{\twovec}[2]{\left[\begin{array}{r}#1 \\ #2 \end{array}\right]}\) \(\newcommand{\ctwovec}[2]{\left[\begin{array}{c}#1 \\ #2 \end{array}\right]}\) \(\newcommand{\threevec}[3]{\left[\begin{array}{r}#1 \\ #2 \\ #3 \end{array}\right]}\) \(\newcommand{\cthreevec}[3]{\left[\begin{array}{c}#1 \\ #2 \\ #3 \end{array}\right]}\) \(\newcommand{\fourvec}[4]{\left[\begin{array}{r}#1 \\ #2 \\ #3 \\ #4 \end{array}\right]}\) \(\newcommand{\cfourvec}[4]{\left[\begin{array}{c}#1 \\ #2 \\ #3 \\ #4 \end{array}\right]}\) \(\newcommand{\fivevec}[5]{\left[\begin{array}{r}#1 \\ #2 \\ #3 \\ #4 \\ #5 \\ \end{array}\right]}\) \(\newcommand{\cfivevec}[5]{\left[\begin{array}{c}#1 \\ #2 \\ #3 \\ #4 \\ #5 \\ \end{array}\right]}\) \(\newcommand{\mattwo}[4]{\left[\begin{array}{rr}#1 \amp #2 \\ #3 \amp #4 \\ \end{array}\right]}\) \(\newcommand{\laspan}[1]{\text{Span}\{#1\}}\) \(\newcommand{\bcal}{\cal B}\) \(\newcommand{\ccal}{\cal C}\) \(\newcommand{\scal}{\cal S}\) \(\newcommand{\wcal}{\cal W}\) \(\newcommand{\ecal}{\cal E}\) \(\newcommand{\coords}[2]{\left\{#1\right\}_{#2}}\) \(\newcommand{\gray}[1]{\color{gray}{#1}}\) \(\newcommand{\lgray}[1]{\color{lightgray}{#1}}\) \(\newcommand{\rank}{\operatorname{rank}}\) \(\newcommand{\row}{\text{Row}}\) \(\newcommand{\col}{\text{Col}}\) \(\renewcommand{\row}{\text{Row}}\) \(\newcommand{\nul}{\text{Nul}}\) \(\newcommand{\var}{\text{Var}}\) \(\newcommand{\corr}{\text{corr}}\) \(\newcommand{\len}[1]{\left|#1\right|}\) \(\newcommand{\bbar}{\overline{\bvec}}\) \(\newcommand{\bhat}{\widehat{\bvec}}\) \(\newcommand{\bperp}{\bvec^\perp}\) \(\newcommand{\xhat}{\widehat{\xvec}}\) \(\newcommand{\vhat}{\widehat{\vvec}}\) \(\newcommand{\uhat}{\widehat{\uvec}}\) \(\newcommand{\what}{\widehat{\wvec}}\) \(\newcommand{\Sighat}{\widehat{\Sigma}}\) \(\newcommand{\lt}{<}\) \(\newcommand{\gt}{>}\) \(\newcommand{\amp}{&}\) \(\definecolor{fillinmathshade}{gray}{0.9}\)Lesson
Let's see how tape diagrams and equations can show relationships between amounts.
Exercise \(\PageIndex{1}\): Which Diagram is Which?
- Here are two diagrams. One represents \(2+5=7\). The other represents \(5\cdot 2=10\). Which is which? Label the length of each diagram.
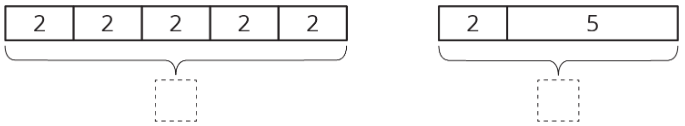
- Draw a diagram that represents each equation.
\(4+3=7\qquad 4\cdot 3=12\)
Exercise \(\PageIndex{2}\): Match Equations and Tape Diagrams
Here are two tape diagrams. Match each equation to one of the tape diagrams.
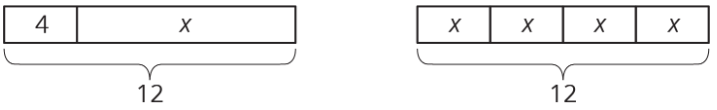
- \(4+x=12\)
- \(12\div 4=x\)
- \(4\cdot x=12\)
- \(12=4+x\)
- \(12-x=4\)
- \(12=4\cdot x\)
- \(12-4=x\)
- \(x=12-4\)
- \(x+x+x+x=12\)
Exercise \(\PageIndex{3}\): Draw Diagrams for Equations
For each equation, draw a diagram and find the value of the unknown that makes the equation true.
- \(18=3+x\)
- \(18=3\cdot y\)
Are you ready for more?
You are walking down a road, seeking treasure. The road branches off into three paths. A guard stands in each path. You know that only one of the guards is telling the truth, and the other two are lying. Here is what they say:
- Guard 1: The treasure lies down this path.
- Guard 2: No treasure lies down this path; seek elsewhere.
- Guard 3: The first guard is lying.
Which path leads to the treasure?
Summary
Tape diagrams can help us understand relationships between quantities and how operations describe those relationships.
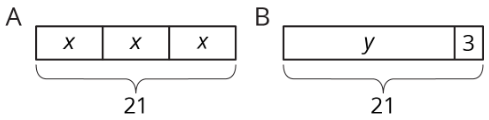
Diagram A has 3 parts that add to 21. Each part is labeled with the same letter, so we know the three parts are equal. Here are some equations that all represent diagram A:
\(\begin{aligned} x+x+x&=12 \\ 3\cdot x&=21 \\ x&=21\div 3 \\ x&=\frac{1}{3}\cdot 21\end{aligned}\)
Notice that the number 3 is not seen in the diagram; the 3 comes from counting 3 boxes representing 3 equal parts in 21.
We can use the diagram or any of the equations to reason that the value of \(x\) is 7.
Diagram B has 2 parts that add to 21. Here are some equations that all represent diagram B:
\(\begin{aligned} y+3&=21 \\ y&=21-3 \\ 3&=21-y \end{aligned}\)
We can use the diagram or any of the equations to reason that the value of \(y\) is 18.
Practice
Exercise \(\PageIndex{4}\)
Here is an equation: \(x+4=17\)
- Draw a tape diagram to represent the equation.
- Which part of the diagram shows the quantity \(x\)? What about 4? What about 17?
- How does the diagram show that \(x+4\) has the same value as 17?
Exercise \(\PageIndex{5}\)
Diego is trying to find the value of \(x\) in \(5\cdot x=25\). He draws this diagram but is not certain how to proceed.

- Complete the tape diagram so it represents the equation \(5\cdot x=35\).
- Find the value of \(x\).
Exercise \(\PageIndex{6}\)
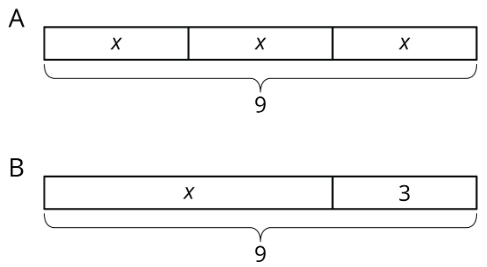
Match each equation to one of the two tape diagrams.
- \(x+3=9\)
- \(3\cdot x=9\)
- \(9=3\cdot x\)
- \(3+x=9\)
- \(x=9-3\)
- \(x=9\div 3\)
- \(x+x+x=9\)
Exercise \(\PageIndex{7}\)
For each equation, draw a tape diagram and find the unknown value.
- \(x+9=16\)
- \(4\cdot x=28\)
Exercise \(\PageIndex{8}\)
A shopper paid $2.52 for 4.5 pounds of potatoes, $7.75 for 2.5 pounds of broccoli, and $2.45 for 2.5 pounds of pears. What is the unit price of each item she bought? Show your reasoning.
(From Unit 5.4.5)
Exercise \(\PageIndex{9}\)
A sports drink bottle contains 16.9 fluid ounces. Andre drank 80% of the bottle. How many fluid ounces did Andre drink? Show your reasoning.
(From Unit 3.4.5)
Exercise \(\PageIndex{10}\)
The daily recommended allowance of calcium for a sixth grader is 1,200 mg. One cup of milk has 25% of the recommended daily allowance of calcium. How many milligrams of calcium are in a cup of milk? If you get stuck, consider using the double number line.
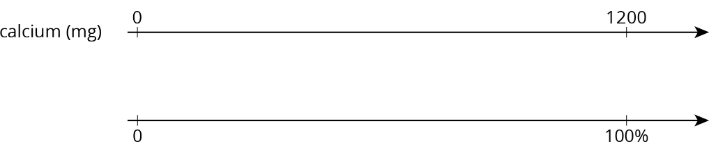
(From Unit 3.4.2)