3.2: The Derivative as a Function
( \newcommand{\kernel}{\mathrm{null}\,}\)
- Use the definition of the derivative to differentiate f(x)=2.
- Use the definition of the derivative to differentiate g(x)=3x−4.
- Use the definition of the derivative to differentiate h(x)=x2.
- Use the definition of the derivative to differentiate y=2x2−x+4.
- Use the definition of the derivative to differentiate f(t)=t3−5.
- Use the definition of the derivative to differentiate g(t)=√t.
- Use the definition of the derivative to differentiate h(t)=√2−3t.
- Use the definition of the derivative to differentiate y=1x−2.
- Use the definition of the derivative to differentiate f(x)=1x2.
- Use the definition of the derivative to differentiate g(x)=1√x+1.
- Use the definition of the derivative to differentiate h(x)={−x,x≤0,x2,x>0.
[Hint: Be careful at x=0.]
- Use the definition of the derivative to differentiate f(x)={−x,x≤0,x2−x,x>0.
[Hint: Be careful at x=0.]
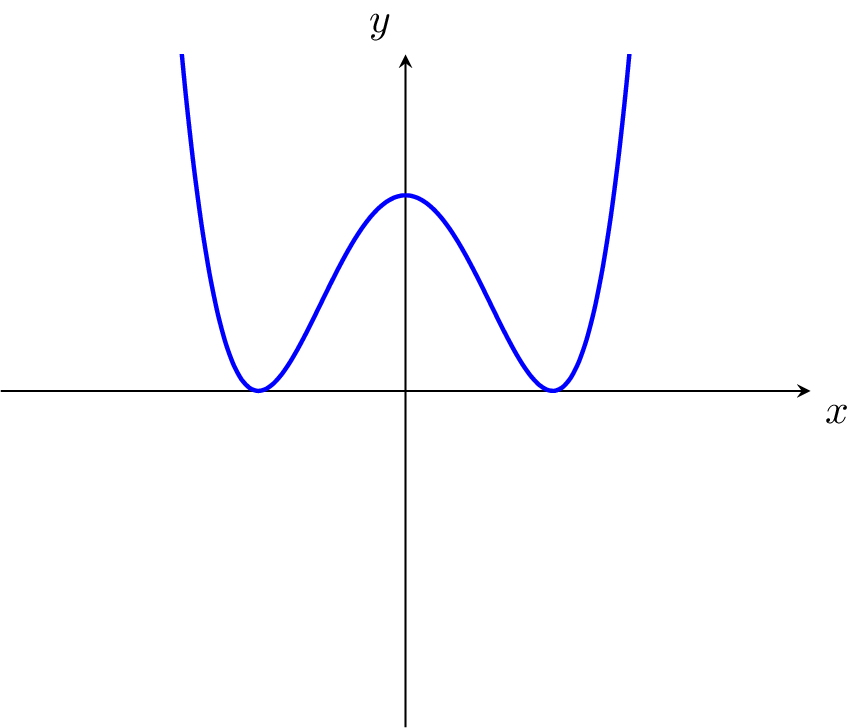
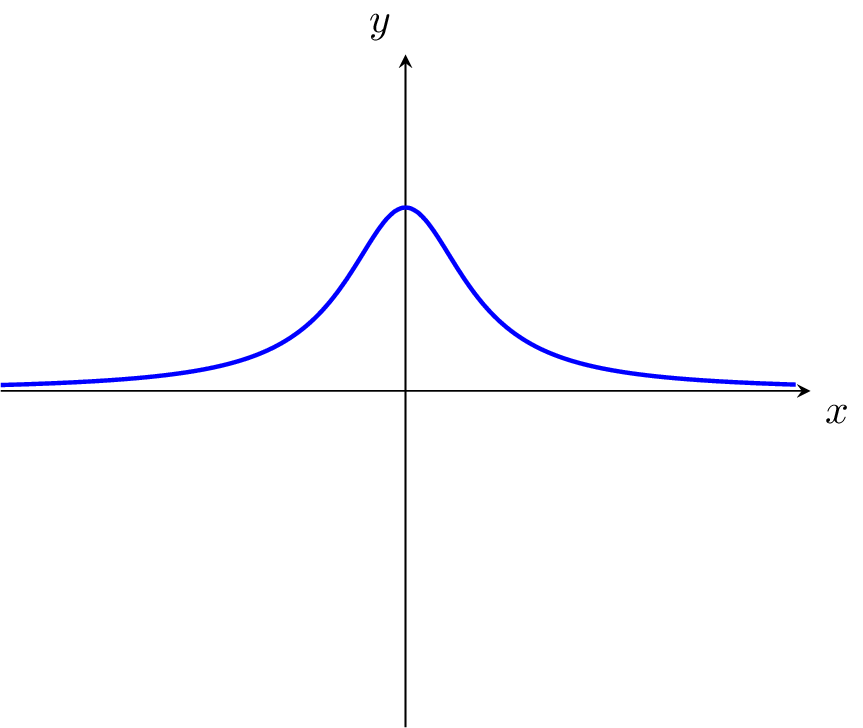
- The graph of g(x) is shown below. Sketch the graph of g′(x).

- The graph of h(x) is shown below. Sketch the graph of h′(x).

- The graph of f(x) is shown below. Sketch the graph of dfdx.

- The graph of g(x) is shown below. Sketch the graph of dgdx.

- The graph of h(x) is shown below. Sketch the graph of dhdx.

- The graph of f(x) is shown below. Sketch the graph of f′(x).

- The graph of g(x) is shown below. Sketch the graph of g′(x).

- The graph of h(x) is shown below. Sketch the graph of h′(x).

- The graph of f(x) is shown below. Sketch the graph of dfdx.

- The graph of g(x) is shown below. Sketch the graph of dgdx.
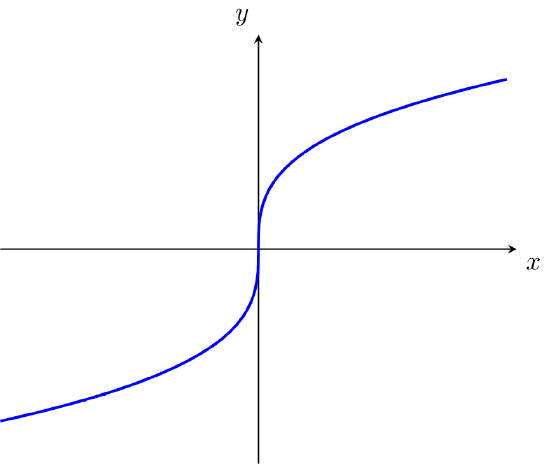
- The graph of h(x) is shown below. Sketch the graph of dhdx.

- Use the graph of f(x) below to answer the following.
- List all values of x for which f(x) is not defined.
- List all values of x for which limt→xf(t) does not exist.
- List all values of x for which f(x) is not continuous.
- List all values of x for which f(x) is not differentiable.
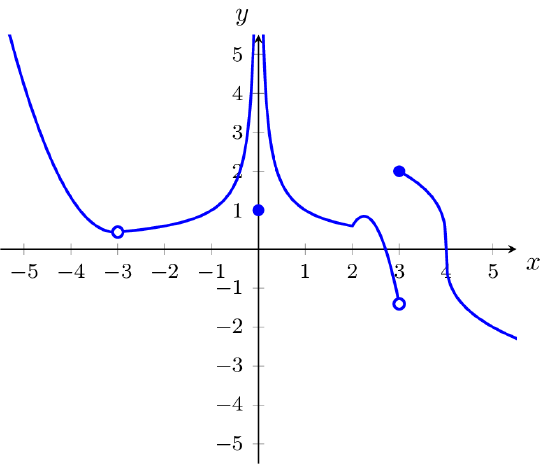
- List all values of x for which f(x) is not defined.